You have probably told yourself that the next indicator, setup or course will fix your account. In Brazil, researchers tracked equity-index futures day traders who kept going for more than 300 days. 97% of them still lost money after fees.
They persisted. Persistence did not turn into progress, and that gap is where trader development levels become useful.
In a roughly 13-minute video on FXStreet, Kathy Lien of BKTraders and Prop Traders Edge argues that most traders stay stuck because of their behaviour, not because their strategies are flawed. She organises that behaviour into ten levels and suggests many people sit in the middle ones without knowing it.
Treat the ten levels as a teaching map, not a scientifically proven staircase. Edge still matters, and you will see why.
This walks you through the levels, shows where most traders stall and why, and gives you one habit to test against your own trading record this week.
Why does behaviour break strategies that might otherwise work?
When your account shrinks, the natural conclusion is that your method is wrong. Sometimes it is. Population-level data suggests the problem often sits elsewhere.
The core distinction Strategy decides whether your process has positive expectancy. Behaviour decides whether you execute it long enough, and consistently enough, for that expectancy to show up.
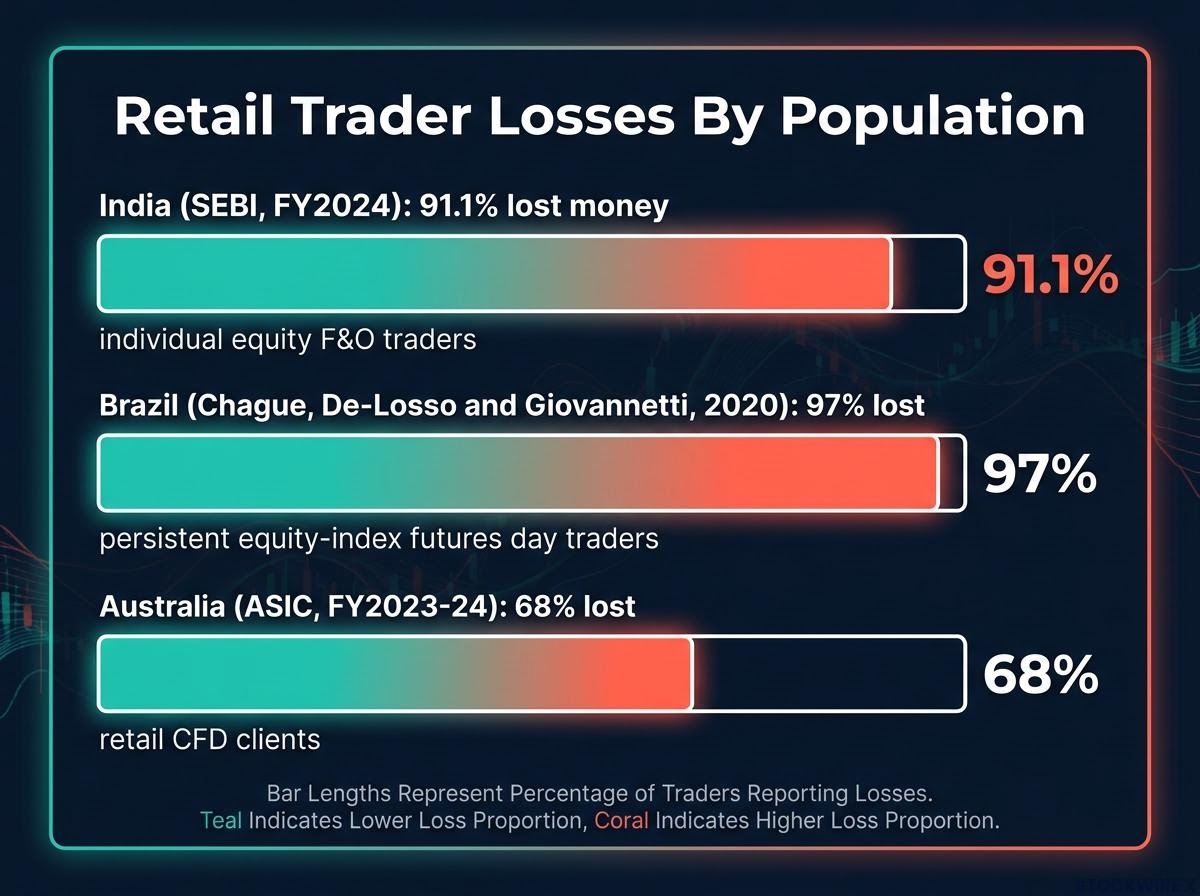
Positive expectancy means a method that, across many trades, earns more than it loses after costs. Regulators in several countries have measured how retail traders actually fare, and the results point in one direction.
| Market or population | Figure | Source | Year | What it measures |
|---|---|---|---|---|
| India, individual equity F&O traders | 91.1% lost money (about 91% in FY2025) | SEBI | FY2024 (published September 2024) | Share of traders losing after transaction costs |
| Australia, retail CFD clients | 68% lost; over $458 million in losses, incl. $73 million in fees | ASIC | FY2023-24 | Share of clients with a net loss |
| Brazil, persistent equity-index futures day traders | 97% lost (1,551 of 19,646 entrants persisted) | Chague, De-Losso and Giovannetti | 2020 | Traders lasting 300+ days who lost after fees |
| US, individual stock investors | Most active earned 11.4% a year vs 17.9% for the market | Barber and Odean | 2000 | Underperformance, not share who lost |
These figures use different denominators, so they cannot be merged into one global loss rate. Leverage, fees and product complexity also drive the losses. Still, Barber and Odean found the most active households trailed by about 7.04 percentage points a year, against just 0.25 points for the least active.
Regulators measure how often traders lose, but the psychology behind retail losses explains why: you tend to chase FOMO-driven entries, take profits early and delay stop-loss exits, and these habits repeat across markets.
More activity and more strategy-hopping tend to sit alongside worse results. Before you change anything, ask whether your problem is the method or the execution.
The balance cuts both ways, though. A disciplined trader with no edge still loses. Behaviour and edge work as a pair, not as rivals.
When big ASX news breaks, our subscribers know first
The ten levels explained: where do you actually sit?
Lien’s framework groups the levels into three broad bands. The research available does not give a verified description of all ten individual levels, so the stages below are the confirmed ones, grouped by band rather than numbered.
Guessing levels
This is trading without a defined process. You buy lottery-ticket trades hoping for a big win, follow tips from forums or social feeds, and collect indicators as if the right combination will finally reveal the answer.
Emotional levels
Here you have some knowledge, but your emotions run the account. Revenge trading means increasing your trade size or frequency after a loss to win the money back quickly. Plan-breaking is the other hallmark. Lien says many traders spend years in these levels. Revenge trading and FOMO (fear of missing out) are recognisable, but regulators measure them less consistently than overtrading.
Professional levels
You journal, set risk before entry and execute without drama. Behaviour becomes progressively less reactive until the final stage, where trading looks deliberately boring: consistent, rule-based and low on emotion.
| Band | Typical behaviour | Warning sign | What changes next |
|---|---|---|---|
| Guessing | Tips, lottery-ticket trades, indicator collecting | You cannot write down your setup | Defining a repeatable process |
| Emotional | Revenge trading, breaking your own plan | Your size jumps after a loss | Recording what you actually do |
| Professional | Journaling, risk-first entries, steady execution | Boredom tempts you to improvise | Scaling only once execution holds |
Try these quick checks on yourself:
- Can you state your entry, exit and position size before you place a trade?
- Did you break a written rule in the last ten trades?
- Do you trade larger after a loss than after a win?
- Could you prove your answers from platform records rather than memory?
Expect your memory to flatter you. Honest self-placement is the first useful step.
This model is one lens among several. Van Tharp uses the four-stage conscious-competence map: unconscious incompetence, conscious incompetence, conscious competence and unconscious competence. Mark Douglas describes movement from externally controlled trading towards rule-based consistency. Brett Steenbarger separates building competence from developing expertise.
All of these models are simplifications. You can be advanced in risk control but weak in strategy research, or disciplined in simulation and erratic with real money.
What keeps the same mistakes repeating long after you know better?
If you already know revenge trading hurts you, why does it keep happening? Because markets teach the wrong lessons with unusual efficiency. Each of these loops reinforces itself:
- Variable reward. It feels like being right just often enough to keep going. Intermittent wins get misread as skill, and Barber and Odean linked that overconfidence to overtrading.
- Outcome-based learning. It feels like proof. A rule-breaking winner rewards bad process, while a well-executed loser punishes good process.
- No feedback loop. It feels like you know your record. Without a journal, you remember the dramatic trades, not the full spread of results.
- Undefined risk and size-driven emotion. It feels like negotiating with a losing position. A strategy you can tolerate at small size can become impossible to execute at larger size, and the disposition effect (selling winners early while holding losers) takes over.
- Strategy switching. It feels like progress. A normal losing streak looks like a broken method, so you change systems before a meaningful sample builds up.
Underneath sits identity. Admitting your problem is execution, rather than the market, broker or strategy, is harder than buying another indicator.
Persistence is not development In Brazil, only 1,551 of 19,646 new day traders lasted beyond 300 days, and 97% of those survivors still lost money after fees.
India shows a similar pattern at scale. Participation stayed high, yet about 91% lost in FY2025 after comparable rates from FY2022 to FY2024.
Time spent trading without feedback simply repeats the same behaviour. Judge your progress by process quality and rule compliance, not by how many years you have been at it.
The disposition effect also distorts exits, and research finds randomly chosen sells beat professional managers by up to 150 basis points a year, which shows how costly reactive selling can be.
What moves you up a level, and what will not
Plenty of practices help. These are the ones the research ties most closely to steadier execution.
| Practice | What it fixes | Common pitfall |
|---|---|---|
| Predefined entries and exits | In-trade improvisation and FOMO entries | Treating rules as a profit guarantee |
| Fixed position sizing | One impulse causing outsized damage | Sizing by conviction instead of stop distance |
| Daily or weekly loss limit | Bad sessions spiralling into revenge trading | Setting a cap that does not suit your strategy |
| Weekly reviews | Confusing good outcomes with good process | Reviewing profit and loss only |
| Scaling after stable execution | Discipline collapsing at larger dollar exposure | Scaling after a lucky streak |
| Prop-firm rules | Missing risk boundaries | Gaming the evaluation, mistaking a pass for an edge |
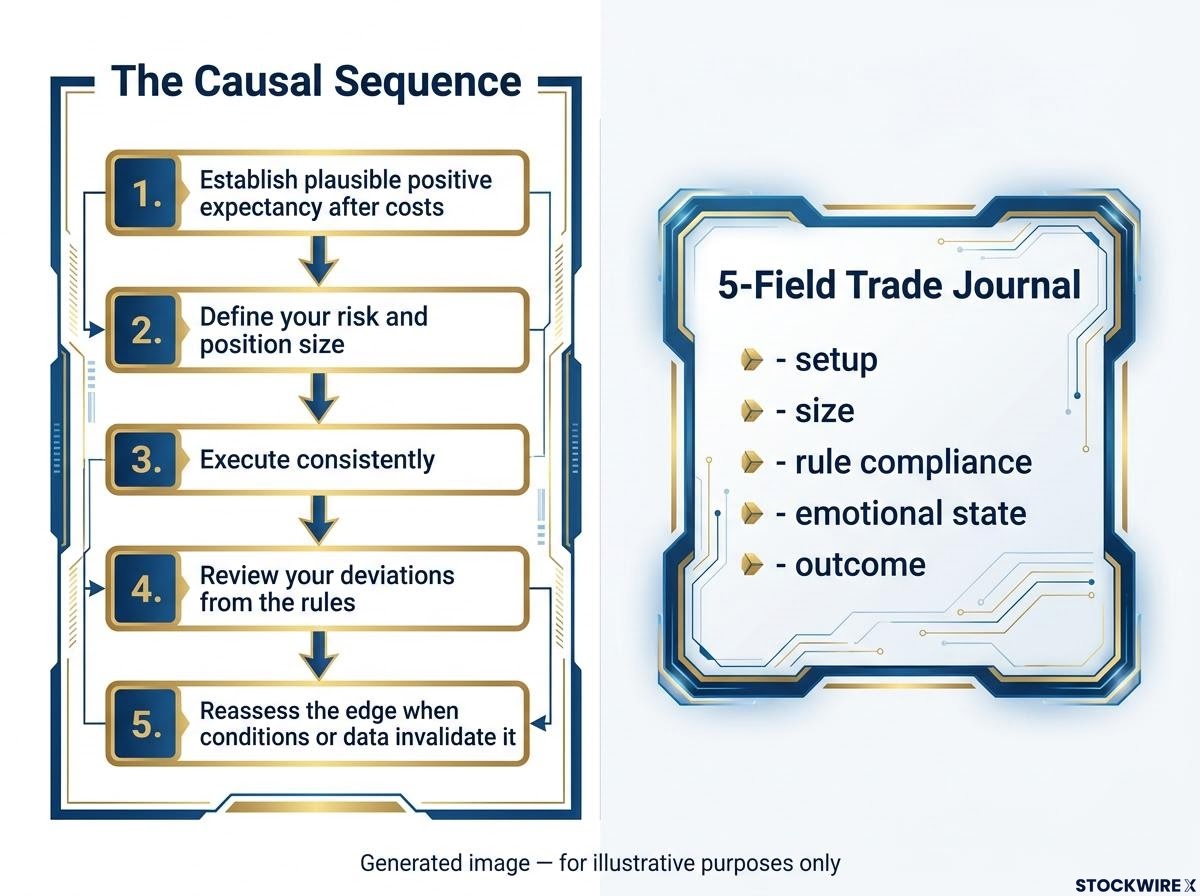
Order matters. The research sets out a causal sequence:
- Establish plausible positive expectancy after costs.
- Define your risk and position size.
- Execute consistently.
- Review your deviations from the rules.
- Reassess the edge when conditions or data invalidate it.
The one habit to start this week
If you start one thing, make it a structured trade journal. It closes the gap between what you intend to do and what you actually do, which matches Steenbarger’s emphasis on self-observation and feedback as the route from competence to expertise.
Record five fields for every trade: setup, size, rule compliance, emotional state and outcome. Pull entries and exits from platform data and timestamps rather than memory, because traders tend to recall the rules they meant to follow.
Once a week, sort your trades by setup, market condition, rule violation, size and emotional state. Look past the profit and loss figure.
A journal replaces memory with evidence. Expect it to show you at least one pattern you did not know you had, such as moved stops or creeping size.
Know its limit. A perfect journal cannot rescue a method with negative expectancy; it can only show you whether you executed it faithfully.
For traders ready to build a journal and review habit, our dedicated guide to building a professional trading playbook shows how to start with 20 annotated screenshots graded on process quality.
What the ten levels tell you, and what they cannot
The ten levels give you a useful behavioural map. They are not a validated law, and no amount of discipline replaces a tested edge. The regulator data from India, Australia and Brazil shows how common losses are, while the behavioural research shows how often traders get in their own way.
Go back to where you placed yourself. Pick one level you want to leave and one habit to start, most likely the five-field journal.
Then make a decision before you touch your strategy. Log your next thirty trades against written rules, review them weekly, and only reassess the method once you know whether you actually followed it.
This article is for informational purposes only and should not be considered financial advice. Investors should conduct their own research and consult with financial professionals before making investment decisions. Past performance does not guarantee future results, and trading frameworks are simplified models that may not reflect every trader’s experience.