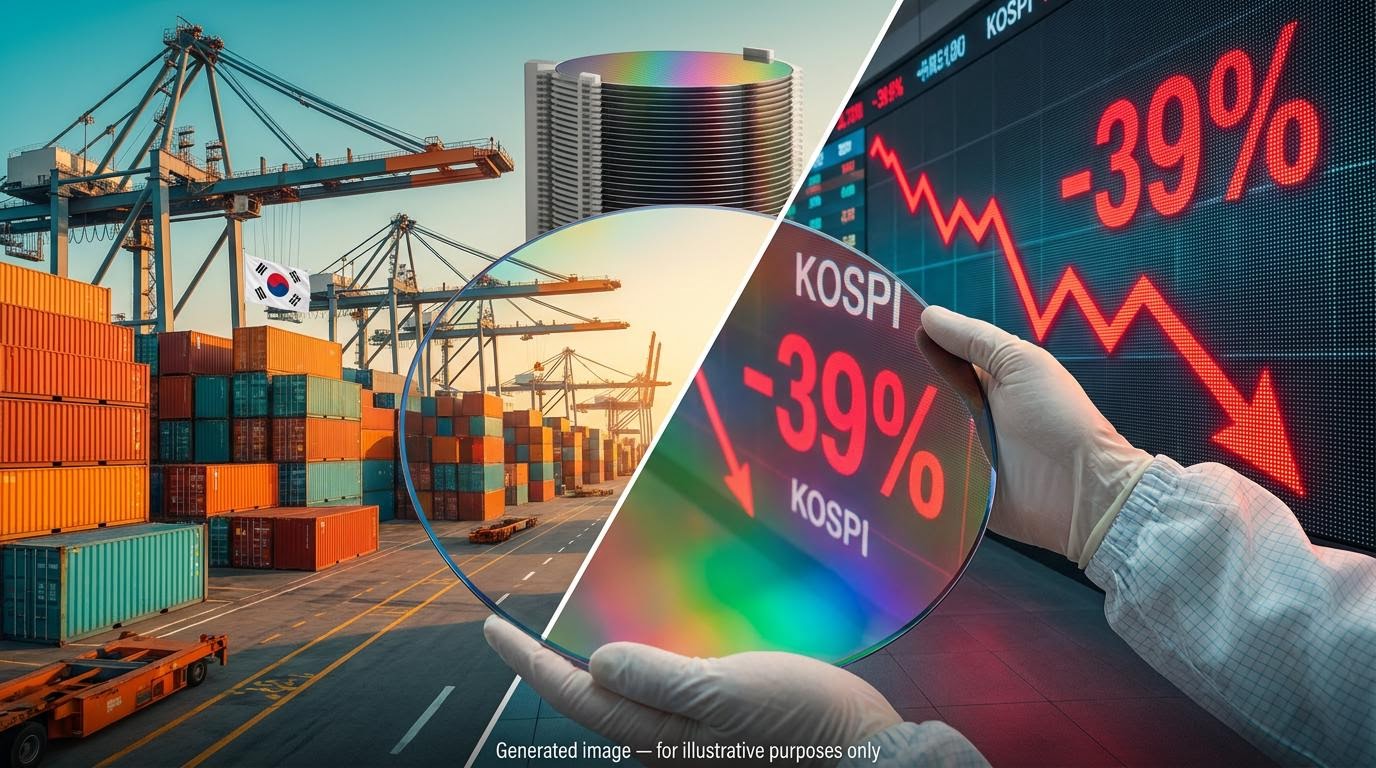
Roughly one dollar in every two that South Korea earned from exports in September came from semiconductors: US$60.3 billion of a record US$120.9 billion. Over the same stretch, the Kospi has fallen about 39% from its June record close. For anyone weighing South Korea AI chip stocks, record fundamentals alongside a collapsing index is a signal that is easy to misread.
In a note dated 21 October 2026, Yardeni Research argued that no other large economy has tied its growth so completely to artificial intelligence as Korea has. That makes the country a live case study. A single-sector bet now shows up in trade figures, corporate earnings, equity prices and central bank policy all at once.
The Korean case is useful well beyond Seoul. It shows how concentration risk behaves when one theme dominates an entire economy. It also points to the indicators that can help you judge whether this selloff is a repricing or the start of something deeper.
What does Korea’s record export boom reveal about how concentrated the economy has become?
Start with the headline strength. September exports hit US$120.9 billion, a record and the 16th straight monthly gain. Reuters put annual growth at 83.7%, while the figure cited by Yardeni was 83.5%, a gap most likely explained by rounding or revision.
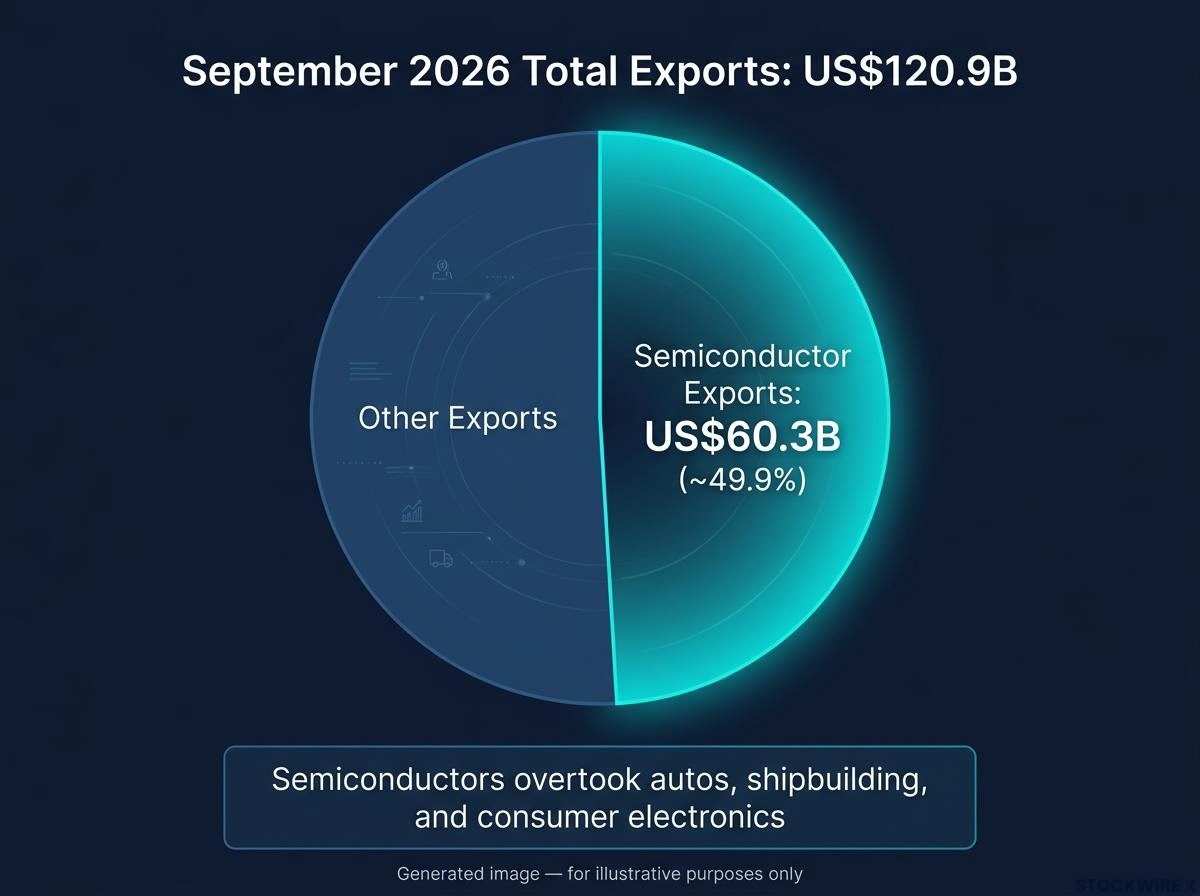
Chips did most of the lifting. Semiconductor exports reached US$60.3 billion, up 262.8% on a year earlier, and overtook autos, shipbuilding and consumer electronics as the country’s top export sector. That is a structural shift, not a one-month spike.
Now turn the same numbers around.
| Measure | Figure | Period | Chip share |
|---|---|---|---|
| Total exports | US$120.9B (+83.7% y/y) | September 2026 | n/a |
| Semiconductor exports | US$60.3B (+262.8% y/y) | September 2026 | ~49.9% |
| Total exports (preliminary) | US$61.6B (+105.4% y/y) | 1-20 October 2026 | n/a |
| Semiconductor exports (preliminary) | US$27.5B (+222.5% y/y) | 1-20 October 2026 | 44.7% |
In a US$2.25 trillion economy, a near-50% chip share is the cleanest single measure of how far the country has tilted. Yardeni’s point is not merely that the stock market is crowded.
Yardeni Research’s framing The concentration is macroeconomic. Samsung Electronics and SK Hynix drive exports, profits, investment and the equity index at the same time, which leaves Korea more exposed than most to swings in worldwide AI spending.
Earnings tell the same story. Samsung reported preliminary Q3 operating profit of 107.4 trillion won, up roughly 782.5% year on year, and SK Hynix is expected to post around 77.0 trillion won. There is one partial counterweight: the Bank of Korea (BOK) reportedly noted that non-IT exports also accelerated in September, though that claim has not been independently confirmed.
What this tells you is that Korean export data now works as an AI-spending indicator, not a diversified read on global trade.
Why the October preliminary data matters
The early-October figures arrived after the equity slide was well under way, and chips still accounted for 44.7% of exports. Concentration did not ease as prices fell.
These are preliminary numbers. As of 25 October, Q3 GDP and final results from SK Hynix (28 October) and Samsung (29 October) were still pending.
When big ASX news breaks, our subscribers know first
How did two memory-chip makers pull the Kospi up to a record and then down 39%?
The rally ran on a loop, and loops can run backwards.
The rally loop
- AI data-centre spending lifted demand for high-bandwidth memory (HBM, stacked memory chips used in AI servers) and advanced DRAM (the working memory inside computers).
- Memory prices and expected margins climbed.
- Analysts raised earnings forecasts for Samsung and SK Hynix.
- Domestic and foreign money, ETFs and momentum traders piled in.
- With the two stocks carrying roughly half the index, their gains lifted the whole Kospi.
- Strong export and earnings data appeared to confirm the higher valuations.
The Kospi hit an intraday record of 9,385.59 in June and a record close of 9,114.55 on 22 June 2026. The intraday figure is the highest point reached during trading; the close is where the index settled at the end of the day.
The slide, and why strong data did not stop it
By 23 October the index closed at 5,550.30, a drawdown of about 39.1% from the record close. Even after a 3.7% fall on 20 October, it remained up about 32% for the year. Several forces reversed the loop:
- Foreign selling: a net 20.3 trillion won of Korean equities in the month reported on 4 October, mostly the two chipmakers
- Higher global bond yields and expectations of tighter policy
- Doubts about returns on AI capital expenditure (capex, the money companies spend on infrastructure)
- Concern over Chinese DRAM competition, particularly CXMT’s technical progress
- The end of Samsung and SK Hynix buyback programmes, removing a steady buyer
Park Yeon-ju of Mirae Asset Securities linked the fall to doubts over AI returns, citing weaker growth signals from Anthropic and sliding CoreWeave bonds, rather than any disappearance of AI demand. That explains the paradox: exports and earnings stayed strong while the market began pricing a possible memory-cycle peak.
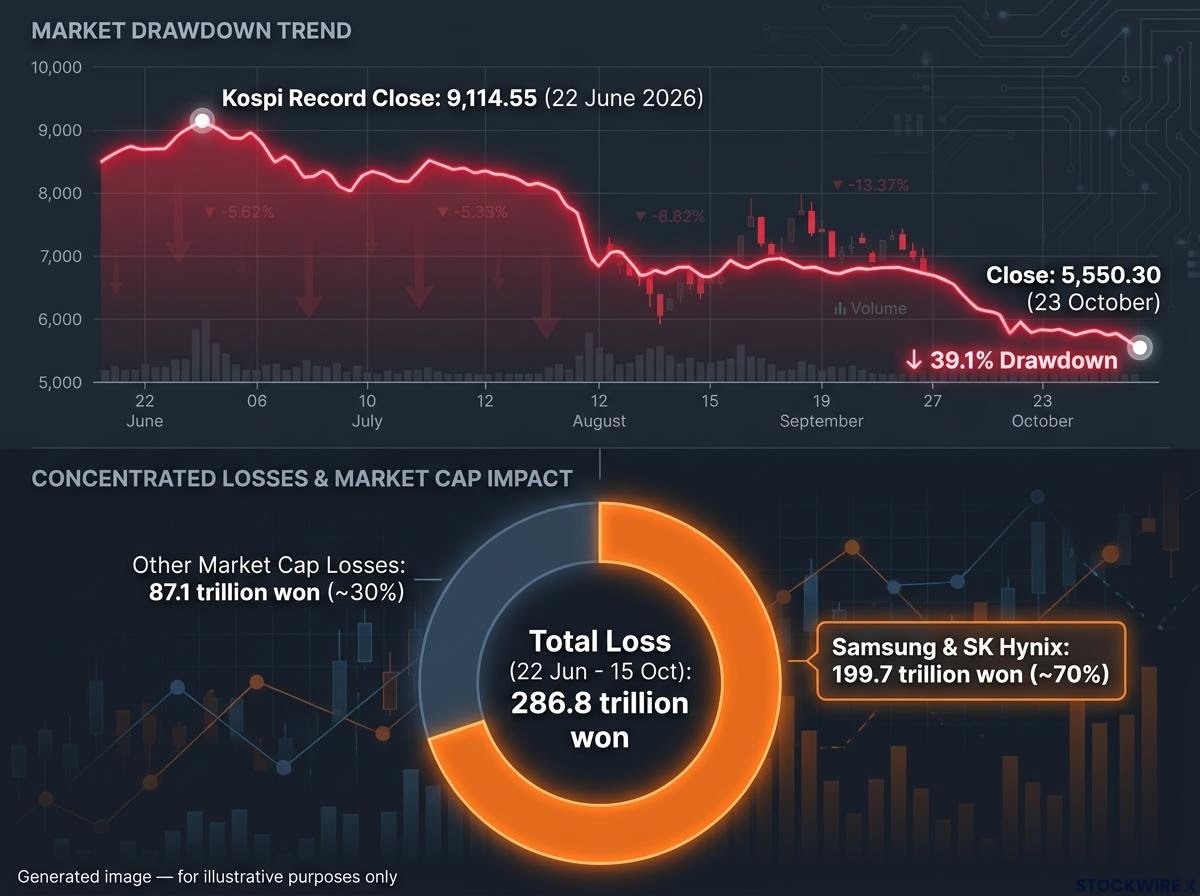
Where the losses landed Between 22 June and 15 October, Kospi market capitalisation fell 286.8 trillion won. Samsung and SK Hynix accounted for 199.7 trillion won of that, about 70%.
The two stocks made up about 47% of the index in October, against 55.5% in July according to the Korea Economic Institute and 22% at the end of 2023. The exact share moves with prices; the stable fact is roughly half. Owning the Kospi is functionally owning a leveraged view on memory pricing, so weigh that against whatever you think you are diversifying into.
The two stocks’ index weight has a mechanical cost: the Kospi’s single-session crash in June showed how margin calls and leveraged ETF rebalancing can turn one chipmaker headline into a near-10% index drop.
Why is the Bank of Korea caught between strong growth and above-target inflation?
On the surface, the BOK has the kind of economy central bankers like. Exports above US$120 billion gave it a positive near-term impulse, and it held the policy rate at 3.00% on 22 October after two 25 basis point hikes (0.25 percentage points each) in July and August.
Then the constraints pile up. September inflation ran at 2.9% (core 2.8%) against a 2% target, which rules out easing. Household debt and uneven domestic demand argue against hiking hard.
| Factor | Supports hike or hold | Supports easing | Current reading |
|---|---|---|---|
| Chip exports | Strong external demand | Only if AI spending reverses | US$60.3B in September |
| Inflation | Above target | No | 2.9% vs 2% target |
| Household debt | Cuts risk reigniting property | Limits aggressive hikes | Financial-stability concern |
| Growth | Solid first half | Slowing pace | Q2 +0.6% q/q (Q1 +1.8%) |
Growth figures need care. Q2 rose 0.6% quarter on quarter, while a separate year-on-year measure showed 3.7%. Q3 preliminary GDP is due on 27 October.
The won cuts both ways:
- A stronger won shrinks exporters’ margins once overseas earnings are converted home
- A weaker won helps exporters but imports inflation
The BOK kept a tightening bias, and the Reuters consensus cited on 22 October saw a possible hike to 3.25% at the 26 November meeting. Because the central bank cannot easily cushion a chip-led shock with quick cuts, any reversal in AI spending would likely be magnified rather than absorbed. That makes November’s decision a read on how much room is left.
Is this a cyclical correction or a structural risk? What the comparisons and the policy response suggest
Single-sector concentration risk means one industry drives exports, earnings and the stock index together, so a shock to that industry hits all three at once. Korea fits that description. The question is what it implies.
Three ways to read the selloff
The cyclical reading points to record exports and accelerating earnings, and treats the fall as profit-taking within a normal memory cycle. The structural reading warns that if hyperscaler returns disappoint, earnings, exports and equities could reverse together. The intermediate reading accepts the opportunity is real but argues the market priced an unusually long, profitable boom.
Bulls argue the memory supercycle differs from past booms because multi-year supply agreements and a supply vacuum before 2027 lengthen the profit window, which is the core claim the intermediate reading tests.
Michael Drury, McVean Trading & Investments Any AI-led market correction could well be centred in Asia, where South Korea and Taiwan stand out as the most vulnerable given how heavily they depend on the chip and AI-investment cycle.
The risks worth tracking:
- A reversal in hyperscaler AI capex
- Memory pricing, which tends to weaken once record profits spur new capacity
- Simultaneous exposure in Korea and Taiwan
- Household debt limiting policy options
What history and policy add
| Case or view | What it says | Key lesson | Relevance to Korea |
|---|---|---|---|
| Cyclical view | Demand intact, normal correction | Strong data can coexist with falling prices | Records in exports and profits |
| Structural view | Overdependence on one narrative | Shocks transmit everywhere at once | Half the index in two firms |
| Intermediate view | Duration and margins repriced | Real demand, overstretched price | Fits the October paradox |
| Taiwan | Chip-led growth | High sensitivity to tech spending | Could fall alongside Korea |
| Nokia and Finland | One firm, one cycle | Leadership is not permanent | Competitiveness must hold |
| Japan, 1989 | Valuations and credit stretched | Fundamentals did not prevent collapse | Liquidity matters as much as earnings |
| Dot-com era | Real technology, overinvestment | Transformation and excess coexist | AI demand and memory overpricing can both be true |
Concentration is not automatically fragility. Samsung and SK Hynix are globally competitive, and their dominance may reflect genuine advantage. No IMF or major-bank assessment of this specific concentration could be located.
President Lee Jae Myung’s public-private AI programme adds a twist. Reported mega-projects worth about 1,000 trillion won (described in the original reporting as more than US$1 trillion) span semiconductors, AI data centres and physical AI. The programme could diversify Korea through domestic AI industry, or deepen its exposure to the same chip cycle first.
The useful question for you is not whether AI demand is real. It is whether prices already assume a longer, more profitable boom than memory cycles typically deliver.
These views are speculative and subject to change based on market developments and company performance. Past performance does not guarantee future results.
What the Korean case changes, and what it does not
Record exports and a 39% drawdown can coexist because markets price how long margins last, not this month’s data. That is the through-line of Korea’s AI trade.
Three markers will sharpen the picture: final Q3 results from SK Hynix and Samsung on 28-29 October, the BOK decision on 26 November, and signals on hyperscaler AI capex. None settles the debate alone, but together they test the intermediate reading.
What the case does not prove is equally important. Concentration is not collapse, and AI demand has not ended. The lasting lesson is to check how much of your own portfolio quietly rides on a single theme.
Investors exploring whether hyperscaler spending can be justified will find our full explainer on AI capex versus returns, which shows capex absorbing 93-94% of operating cash flow.
This article is for informational purposes only and should not be considered financial advice. Investors should conduct their own research and consult with financial professionals before making investment decisions.
—