Meta and Tesla both beat headline expectations this week. On Thursday 22 October 2026, the Nasdaq Composite still fell 2.60% to 26,008.86, its worst session since June. That gap between strong results and falling shares is the signal behind the Big Tech selloff, and it is easy to misread: good earnings were not enough.
The damage reached beyond technology. The S&P 500 slid 1.21% to 7,663.43. At the same time, buyers moved into retail, business services and restaurant names that had spent most of the year out of favour.
The stakes for your portfolio are practical. If this is a pause, mega-cap leadership returns and little changes. If it is a broadening, the source of market returns is moving, and portfolios built around a handful of AI giants may need a second look.
This analysis gives you a way to tell a rotation from a retreat. It also offers a standard for judging which claims about the winners deserve your trust.
Why did good earnings still trigger a Big Tech selloff?
Beats are supposed to be rewarded. On 22 October they were punished, and the reason sat below the revenue line.
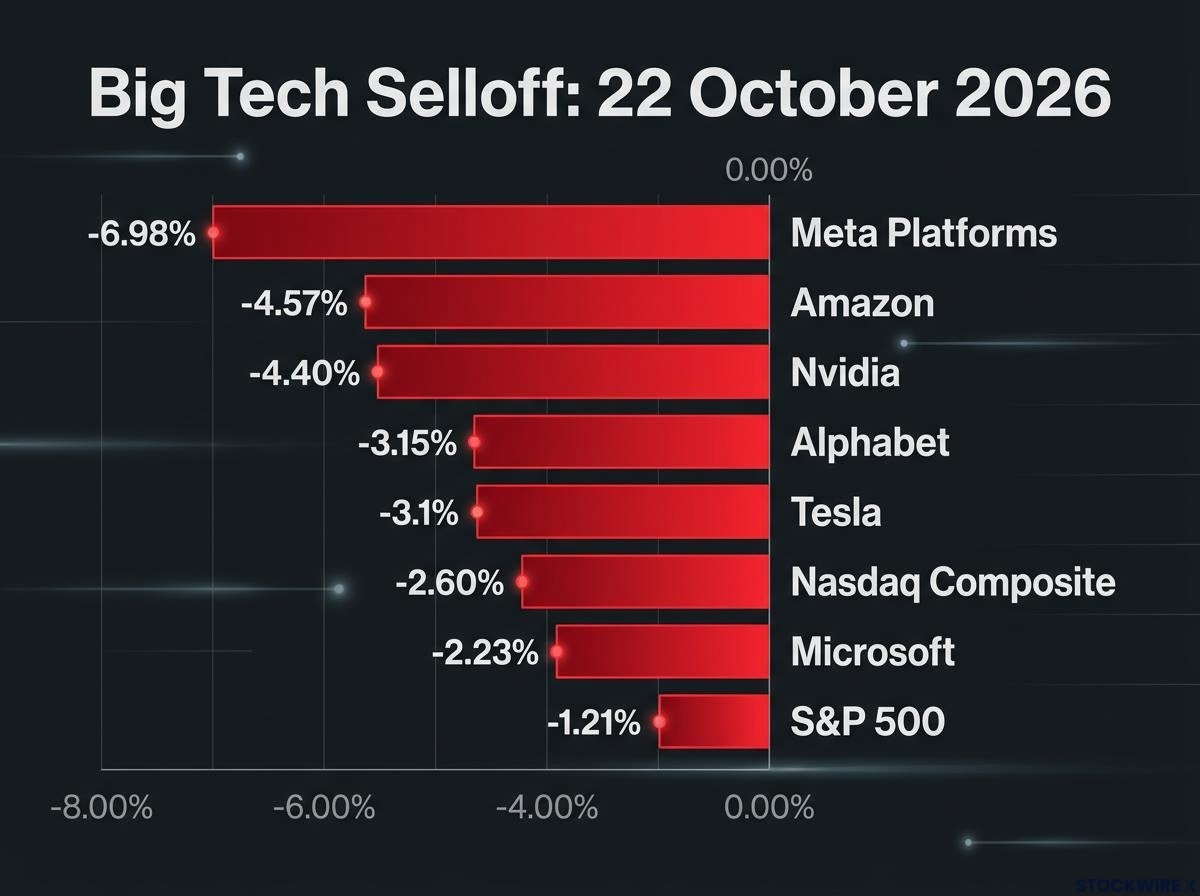
| Security | 22 October move | Close |
|---|---|---|
| Nasdaq Composite | -2.60% | 26,008.86 |
| S&P 500 | -1.21% | 7,663.43 |
| Meta Platforms | -6.98% | approx. $648.85 |
| Amazon | -4.57% | Not available |
| Nvidia | -4.40% | Not available |
| Alphabet | -3.15% | Not available |
| Tesla | about -3.1% | Not available |
| Microsoft | -2.23% | Not available |
Meta: strong revenue, strained cash flow
Meta Platforms reported Q3 revenue of $64.60B, ahead of the $63.37B LSEG consensus. On demand, nothing was wrong.
The problem was the bill. Quarterly capital expenditure (money spent on long-lived assets such as data centres) reached about $35B, pushing Meta to its first negative quarterly free cash flow since listing. Free cash flow is the cash left after running the business and paying for that investment.
Meta also plans to issue non-voting shares to help fund the build-out. Investors read that as a sign that hyperscaler AI spending is leaning on capital markets, and the stock fell 6.98%.
The market has already shown it will pay up for measurable AI revenue: in July, Microsoft and Amazon surged on Azure and AWS growth while Meta fell on thin free cash flow, a split that foreshadowed this week’s reaction.
Tesla: a beat undercut by lower spending
Tesla posted revenue of $28.05B and adjusted EPS of $0.48, both above expectations. Yet investors fixed on weaker profitability and a cut to 2026 capex, now about $20B from $25B.
That cut raised questions about how much conviction sits behind Tesla’s AI, robotics and autonomous-driving plans. The shares slipped about 3.1%.
The lesson for you is direct. A beat no longer protects a stock when the market doubts the return on the capital behind it, so earnings headlines alone are an unreliable guide to how your holdings will trade. The question has moved from whether AI demand is real to whether it pays.
When big ASX news breaks, our subscribers know first
How to read AI capex: the return-on-capital framework
Strip away the jargon and every analyst quoted this week is asking one thing: does the money spent on AI earn more than it costs?
Spending only creates value when the return beats the cost of the capital behind it. JPMorgan Asset Management frames the test as whether monetisation can scale fast and widely enough to justify the capital intensity. Strong demand for computing power, it argues, is not evidence of attractive returns.
Four pressure points decide the answer:
- Debt funding. JPMorgan’s September research found AI capex is increasingly debt-funded rather than paid from free cash flow, which raises the return required.
- Capex running ahead of revenue. Bank of America research, reported by TechFlowPost, put the return on incremental invested capital (ROIIC, the profit earned on each new dollar invested) below the weighted average cost of capital (WACC, the blended cost of a company’s debt and equity).
- Depreciation. Graham Mould, quoted by Trustnet, warned that chips, power and data-centre infrastructure will drive a later surge in depreciation (the accounting cost of assets wearing out), so revenue must climb fast just to cover it.
- Margin compression. State Street Global Advisors said compute operators and model developers could see thinner margins, with even infrastructure layers at risk of a valuation de-rating.
Bank of America on 2026 AI capex Spending beat expectations by 50%, while revenue beat by only 20%.
BNY Wealth’s Kevin Shea put it simply: profit must grow faster than capex. Chuck Carlson of Horizon Investment Services added that higher capital costs make the whole build-out more expensive.
The shift toward debt-funded capex matters because borrowed money raises the return a project must earn, and aggregate free cash flow across major AI-exposed firms is forecast to swing negative in 2026, with the gap largely filled by debt.
The bull case deserves a hearing. JPMorgan says it is too early to call a peak in AI capex, and Francis Gannon of Royce Investment Partners sees the opportunity spreading to companies that use AI to lift margins. David Rosenberg counters that tighter spending by big tech could ripple painfully through the AI supply chain.
You can run this test on any AI-exposed holding: is profit growing faster than the capital being spent, and who is paying for it?
Where did the money go? The rotation winners examined
If the market is penalising spending without returns, the companies drawing fresh buying should show the opposite. Here is what rotation buyers bought.
| Company | Move | Key driver | Key metric |
|---|---|---|---|
| Kohl’s | +31% in October | Gordon Haskett upgrade, store traffic | EPS $1.28 vs $0.57 expected |
| Gartner | +21.60% in October | Record contract value, larger buyback | Adjusted EPS $4.37 (+24%) |
| TriNet | +33.54% since July pick | Embedded HR and AI tools | EPS $1.55 vs $0.93 expected |
| Wingstop | Up to 24% in October | Restaurant expansion | Systemwide units +16% |
| Everforth | +123.06% since selection | Army AI award | About 6x adjusted earnings at selection |
Kohl’s jumped 11.82% after Gordon Haskett upgraded it to Buy, and its long-term debt has fallen to the lowest level since 2007. Buybacks have resumed as the balance sheet improved.
Gartner delivered record research contract value of $5.3B and expanded its buyback to $500M. TriNet says its new AI assistant cut customer-service contacts by 6%, with Q3 results still pending. Wingstop beat Q2 forecasts by about 15% with EPS of $1.18.
Everforth carries a $115M US Army AI research award. Independent reporting on an October 2026 development could not be found, and its figures come from self-reported ProPicks material, as do several of the valuation numbers behind these picks.
Look across the list and a pattern appears. These are companies generating cash, returning it through buybacks, delivering earnings and starting from modest valuations.
That should shape your next question. These gains already price in a good deal of good news, so the useful test is what remains in the valuation, not whether the businesses are sound.
Broadening or pullback? Weighing the rotation and the AI-picking track record
Strategists looking at the same flows reach very different conclusions:
- Durable broadening: Francis Gannon, cited in Franklin Templeton commentary, sees capital moving from crowded mega-caps into cheaper value stocks, cyclicals, small caps and AI users.
- Short-term pullback: Deutsche Bank strategists said the tech rotation had gone too far, and RBC pulled back its technology recommendation.
- Yield-driven defence: Real Investment Advice called it rotation, not liquidation, tied to lower bond yields and defensive positioning.
No attributable 2026 strategist comparison to the 2000 tech bust, the 2022 drawdown or the July 2024 rotation could be found. Any parallel you draw is your own context, not market consensus.
Chasing the winners carries four risks:
- Valuation: a few strong weeks can be extrapolated into a permanent edge that does not exist.
- Momentum reversal: flows can swing back if mega-caps rebound or rates rise.
- Index concentration: a few giants still dominate major US indexes, so their falls can swamp gains elsewhere.
- Fundamental exposure: some value names depend on a strong consumer, lower rates or a cyclical recovery.
How much weight should a self-reported track record carry?
Investing.com’s ProPicks AI service says its tech list has returned 183.18% since November 2023, beating the S&P 500 by 102.25 points, for under $9 a month. It picks up to 20 stocks per strategy, equal-weighted and rebalanced monthly.
Evidence check The 183.18% figure is self-reported. No independent audit of it was found.
Investing.com’s own educational material separates backtests (simulated results on past data) from live results. Backtests can suffer from survivorship, look-ahead and selection bias, and published returns may exclude costs and taxes or blend several strategies. Apply the same scepticism to any headline return you meet, whether a stock’s or a service’s.
Readers interested in how rotations are confirmed can read our full explainer on 2026 sector rotation signals, which details the XLK/SPY relative-strength level that separates tactical from structural moves.
What next week’s earnings and central bank meetings will test
The case for broadening faces its first real exam within days. Three mega-caps report, and three central banks decide.
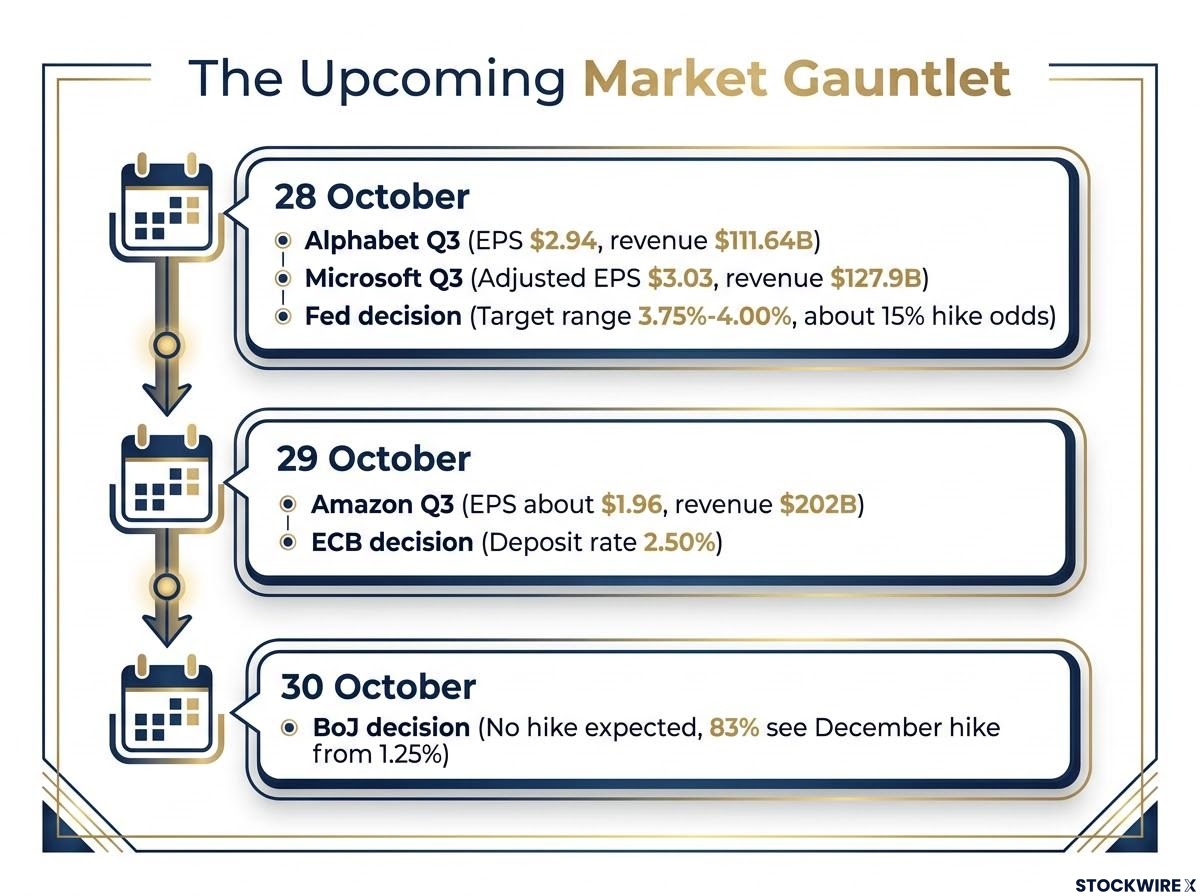
| Event | Date | Expectation |
|---|---|---|
| Alphabet Q3 | 28 October | EPS $2.94, revenue $111.64B (Zacks) |
| Microsoft Q3 | 28 October | Adjusted EPS $3.03, revenue $127.9B (FactSet) |
| Fed decision | 28 October | Target range 3.75%-4.00%, about 15% hike odds |
| Amazon Q3 | 29 October | EPS about $1.96, revenue $202B (FactSet) |
| ECB decision | 29 October | Deposit rate 2.50%, possible December rise to 2.75% |
| BoJ decision | 30 October | No hike expected; 83% of economists see December hike from 1.25% |
Fed figures vary by source. A 4.05% figure in one calendar appears to be an effective-rate forecast, so treat the target range as the policy setting and the hike odds as approximate.
For the tech giants, the numbers that matter are cloud growth, margins and guidance. Those are the places where heavy AI investment either shows up as profit or does not.
Rates then decide which style holds the advantage:
- Federal Reserve (Fed): a hold keeps discount rates high, which shrinks the present value of distant growth earnings and favours cash-generative value. Falling yields would help tech.
- European Central Bank (ECB): higher-for-longer supports value and cyclicals over expensive growth.
- Bank of Japan (BoJ): a hawkish turn could lift Japanese yields, tighten global conditions and pressure high-valuation growth stocks.
Put together, strong cloud and margin results with steady yields could revive Big Tech leadership. Higher-for-longer rates would keep the edge with cash-generative value.
Higher discount rates drive most of the early equity weakness around tightening, a valuation repricing rather than an earnings problem, and Goldman Sachs data shows the S&P 500 has historically recovered well over the following 12 months.
These are forward-looking scenarios, subject to change as market conditions and company results develop. Past performance does not guarantee future results.
What the selloff changes, and what it leaves open
One session moved the market’s question from whether AI demand exists to whether AI spending pays. The rotation winners show where investors are now rewarding cash generation and earnings delivery.
Three tests carry forward. Is profit growing faster than the capital spent? What is left in a valuation after a sharp run? How strong is the evidence behind a headline return?
Next week’s results and rate decisions will show whether the broadening holds or fades. That is the moment to check your own exposure against those signals, rather than against last week’s price moves.
This article is for informational purposes only and should not be considered financial advice. Investors should conduct their own research and consult with financial professionals before making investment decisions.