
The price on your options screen is a quote, not a promise. When Autoliv shares fell roughly $7 to about $111.73 after earnings, one contract’s spread had stretched to about $1.20 wide, against roughly 60 cents the day before. The 100-strike put showed no bid at all.
That gap matters because option liquidity during a selloff decides whether your carefully defined risk can be closed at a fair price or only at a painful one. A sharp drop forces two questions: can you get out, and is this an equity scare or something broader?
Nobody reliably predicts crashes. The useful skill is managing your exit and reading the evidence as it arrives.
Here is how to judge how tradable your options really are in a shock, which cross-asset signals to check, and which strategy rules keep your risk and reward in proportion. This is evergreen education, not trade advice or a market call.
Why do option spreads widen and exits get harder during a selloff?
You probably trust the midpoint. It sits halfway between the bid (the highest price a buyer will pay) and the offer (the lowest price a seller will accept), and most platforms use it to value your position. In calm markets, that is close enough to reality.
Your screen quote is only as reliable as the order book behind it, and the bids and offers resting there decide what price you actually receive when you try to close a position in a hurry.
In a shock, it can stop being a price you can trade at all.
The Autoliv example
Autoliv reported Q3 results on 23 October 2026. Adjusted earnings per share came in at $2.19 against consensus near $2.23. Revenue was $2.69 billion against about $2.73 billion expected, and the adjusted operating margin was 9.7% versus 10.0%, according to MarketBeat. The shares fell about 6.8%.
The option quotes come from a trading show discussing the move and were not independently verified. The show’s share price also differs slightly from MarketBeat’s figure of about $110.69-$110.75, likely because of timing. The mechanism still matches broader evidence: the spread roughly doubled overnight, and one put had no buyer at any price.
The wider market was not in crisis. The stock simply moved faster than dealers could comfortably hedge.
Four reasons dealers widen quotes
Market makers are firms that continuously quote bids and offers. Cboe says their pricing models draw on the underlying price, time to expiry, volatility, dividends and interest rates. When those inputs lurch, four motives push quotes apart:
- Hedging uncertainty. A hedge placed at one price can stop working seconds later in a fast move.
- Inventory imbalance. If customers all buy puts at once, dealers end up holding a lopsided book they want to avoid.
- Volatility repricing. Old volatility assumptions become dangerous, so dealers reprice upward to avoid being picked off by faster traders.
- Less appetite to hold risk. Dealers cut quote sizes, widen prices or briefly step away when the risk outweighs what the spread pays them.
The widening is lopsided. Offers tend to rise much more than bids, so your position can look healthy at the midpoint while the real exit costs far more.
A quoted price is not necessarily an executable price during a shock.
Treat that quote as the opening of a negotiation. Judge your position by what it would cost to leave, not by its mark.
When big ASX news breaks, our subscribers know first
How bad can it get? Evidence from August 2024 and April 2025
A single stock gapping after earnings is one thing. The harder lesson is that the deepest options market can fail the same test.
S&P 500 index options (SPX), a US product, usually set the benchmark for liquidity. Here is how they compare with single-stock options:
- SPX options: deep liquidity, narrower everyday spreads, continuous institutional market-making, and hedgeable with highly liquid instruments.
- Single-stock options: exposed to earnings gaps, with sparse strikes, lower open interest (the number of contracts still outstanding) and little offsetting flow.
On 5 August 2024, that advantage shrank dramatically. The VIX, a US index of expected S&P 500 volatility, jumped from about 23.9 to above 65 in pre-market trading. The US Securities and Exchange Commission’s economic research division found spreads on some options used in the VIX calculation went from under $1 to more than $50.
The Bank for International Settlements (BIS) found that dealers raised offers more than bids, especially on out-of-the-money puts (puts with strikes below the current price). Because the VIX is built from mid-quotes rather than trades, that lopsided widening pushed the index higher without matching trading volume. Even the headline fear gauge was partly a quoting effect.
Because the index is built from mid-quotes, it can overstate fear in thin markets, and the history of VIX regimes shows why a spike on its own is a poor guide to what comes next.
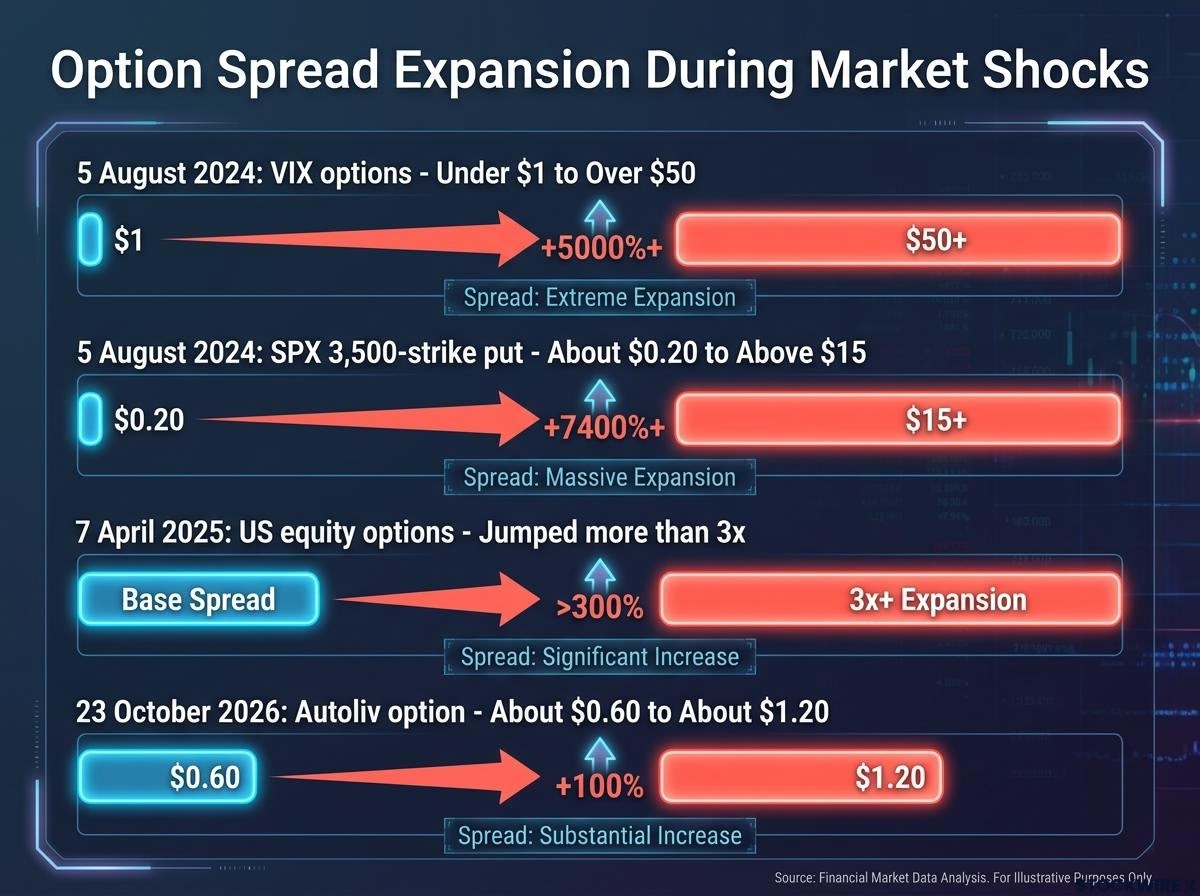
7 April 2025 showed a broader strain. The median S&P 500 stock spread hit about 22 basis points, according to the Heisenberg Report. A basis point is 0.01 percentage point. Bloomberg reported that options spreads jumped more than threefold within seconds.
| Episode | Instrument | Normal spread | Stressed spread |
|---|---|---|---|
| 5 August 2024 | Options in VIX calculation | Under $1 | Over $50 in some cases |
| 5 August 2024 | SPX 3,500-strike put | About $0.20 | Above $15 |
| 7 April 2025 | US equity options | Pre-shock level | More than 3x within seconds |
| 23 October 2026 | Autoliv option (unverified) | About $0.60 | About $1.20 |
Choosing liquid products lowers your liquidity risk but never removes it. Plan for spreads that are multiples of normal, not a few cents wider.
Is it an equity scare or something broader? Reading cross-asset signals
The trading show hosts made a blunt point: people who constantly predict crashes are like a stopped clock, occasionally right. Your goal is not forecasting. It is classifying conditions as they unfold.
On the day of the broadcast, the hosts noted that triple-C credit (XCCC) and the high-yield bond ETF JNK were both down. The dollar was weak and the euro under pressure, with a possible French rating downgrade pending a Moody’s update. Those clues only mean something when you read them against a baseline.
CCC credit spreads sitting at the 100th percentile since October 2023 show how strain can concentrate in the weakest borrowers while broad high yield stays calmer.
Credit and Treasuries
High-yield spreads measure the extra yield investors demand to hold riskier corporate debt. US high-yield spreads reached about 401 basis points in early April 2025, the highest since November 2023, according to Reuters. First Eagle observed that in August 2024, equity volatility rose far more than high-yield spreads, a sign the stress had not reached credit.
US Treasuries tell you what kind of fear is in play. Falling yields usually mean a flight to quality: the 10-year yield fell to about 3.78% on 5 August 2024, then rebounded about 12 basis points the next day. Between 7 and 9 April 2025, it swung about 35 basis points intraday and rose about 17 basis points in one session, which looks more like a dash for cash.
The dollar, gold and silver
These signals mislead more often. On 5 August 2024, the US dollar index fell 0.46% to 102.68, and gold fell 1.52% to $2,406.16, even as equities sold off. Gold can drop when investors sell what they can to raise cash. Silver’s industrial uses make it a weaker hedge signal still, and no comparable silver figure exists for these episodes.
| Signal | Equity-only scare | Broader stress | Caveat |
|---|---|---|---|
| High-yield credit | Widens modestly | Widens sharply, lower grades worst | No comparable CCC spread data found |
| US Treasuries | Yields fall, trading orderly | Abrupt, jumpy selloff | Rate expectations also move yields |
| US dollar | Mixed | Can rise on a scramble for cash | Growth and policy views also drive it |
| Gold and silver | Mixed | Can be sold heavily for cash | Gold fell on 5 August 2024 |
No single indicator is infallible. Read the signals together, not one at a time.
If credit and Treasuries stay orderly while equities fall, you are more likely facing a technical scare. If credit widens and Treasuries turn jumpy, treat liquidity risk as higher and cut exposure sooner.
Defined-risk, positive-theta rules that survive a bad day
Once you have read the conditions, you need rules you can act on this week. Then you need to know where those rules break.
Strategy rules
The hosts express any view only through high-probability, defined-risk trades with positive theta. Defined risk means your maximum loss is fixed by the trade’s structure. Positive theta means the position gains value as time passes, all else equal.
They also demand adequate pay for the risk. If bearish, they sell a call spread only when they collect about one-third of the strike width; otherwise, they use a put spread. A $1-wide spread sold for $0.33 still carries about $0.67 of defined risk before costs.
Volatility tends to revert towards its average over time, which supports selling premium after a spike. The timing can be wrong, though, and studying history invites curve-fitting, where a rule matches past data but fails in future.
For readers wanting to see how positive theta works in practice, our dedicated guide to credit spread theta decay explains the three separate paths to maximum profit.
What can still go wrong
Defined risk caps your loss at expiration. It does not remove these risks:
- Gap risk: after earnings, a stock can jump through both strikes before you can adjust.
- Execution risk: your spread may be marked at a midpoint nobody will trade.
- Elevated volatility: implied volatility can keep rising and make your short options pricier despite time decay.
- Early assignment: short American-style options can be exercised early, especially near ex-dividend dates. Many index options are European-style and avoid this.
- Tail events: in February 2018, the volatility products XIV and SVXY lost more than 90% after the VIX more than doubled on 5 February, according to Cboe and the IMF. The one-third rule does not cover losses like that.
Defined risk caps the theoretical loss, not the cost of leaving.
Six habits help you size for the exit you might actually get:
- Use limit orders, not market orders.
- Close spreads as a single package rather than one leg at a time.
- Size positions assuming spreads may double or bids may vanish.
- Check volume, open interest and spread at each strike you trade.
- Never assume a midpoint mark is executable.
- Treat earnings as a discrete event with gap risk.
What stays constant when markets stop being orderly
Spreads widen when hedging gets hard, and they widen against you, with offers climbing faster than bids. Cross-asset signals help you classify the stress without predicting it, as long as you read credit, Treasuries, the dollar and gold together. Exit-aware sizing matters more than the mark on your screen.
Before your next trade, ask one question: what would it cost you to leave this position on a bad day? If the answer is unclear or uncomfortable, shrink the position or choose a more liquid instrument.
The episodes here are historical illustrations, not a forecast. Past performance does not guarantee future results.
This article is for informational purposes only and should not be considered financial advice. Investors should conduct their own research and consult with financial professionals before making investment decisions.