Ken Griffin told a New York audience this week that investors are “almost certainly” in an AI bubble. The headlines stopped there. Griffin did not: he went on to argue that the companies surviving a bubble tend to lead markets for decades, which makes the word “bubble” far less of a sell signal than it first sounds.
The timing matters. On a broad definition, AI-related stocks now make up close to 49% of the S&P 500, and hyperscaler spending guidance has kept climbing through 2026. If you hold an index fund, you already carry this exposure.
The risk is treating “bubble” as a verdict when it works better as a diagnostic question. Below are three options signals you can use to test speculation in any AI stock, along with a clear account of where the evidence backs Griffin and where it falls short.
What did Ken Griffin actually say about an AI bubble, and should you take it at face value?
Griffin, who founded Citadel, spoke at Citadel Securities’ Future of Global Markets Conference on 20 October 2026. He linked the bubble to uncertainty over how much companies should spend on AI and how the technology will change the economy. He framed it as a pattern rather than a crash forecast, saying “any radical transformation of our economy is generally intertwined with a bubble.”
Then came the half that drew less attention.
“The companies that are on the other side of that bubble are the market leaders for decades to come.” Ken Griffin, Founder and CEO, Citadel
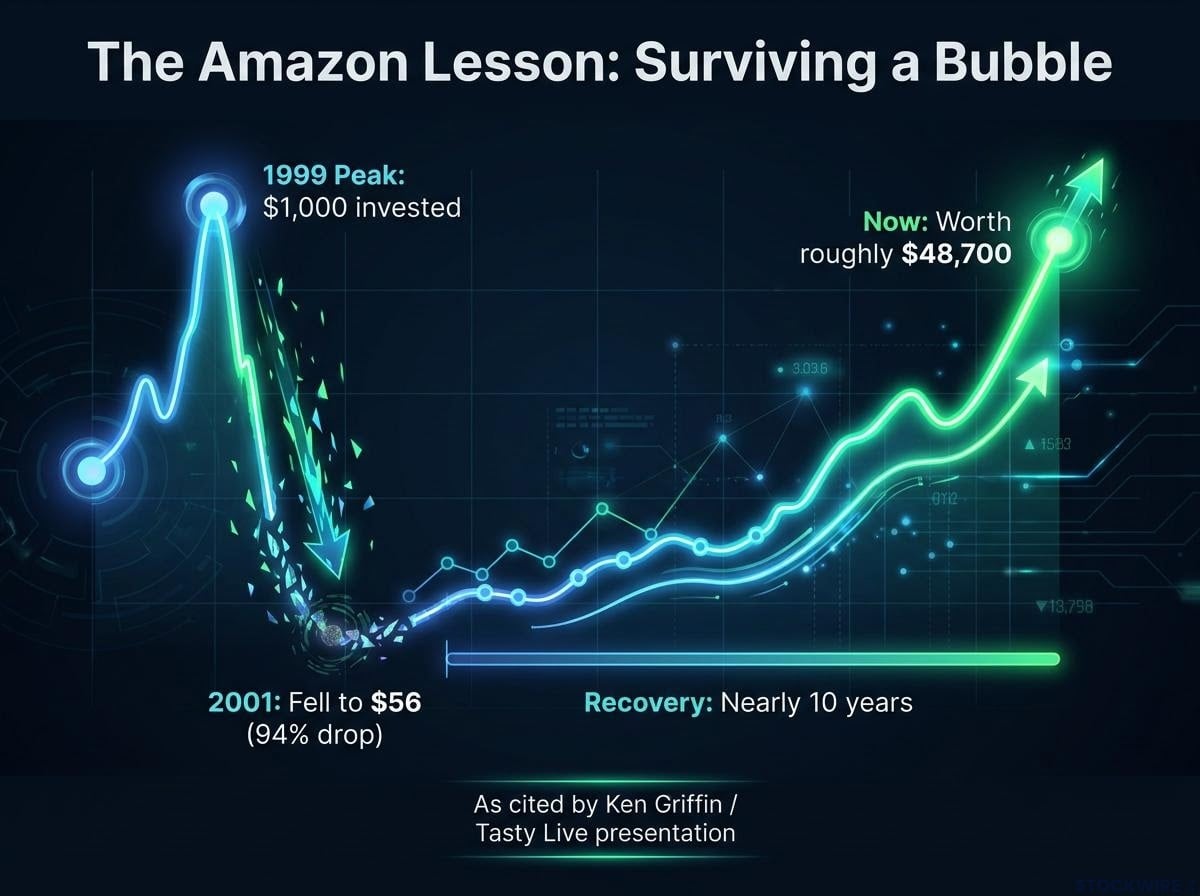
His example was Amazon, and he admitted he wished he had held onto his shares. The return path, though, was brutal. According to figures from the Tasty Live presentation that examined Griffin’s comments, which were not independently verified:
- $1,000 invested at the 1999 peak fell to about $56 by 2001, a 94% drop
- Recovery took nearly 10 years
- That stake is now worth roughly $48,700
Amazon is also an unusually successful survivor. Many dot-com companies never came back, and survivorship bias (judging a period only by its winners) flatters the lesson.
Consider the messenger as well. Griffin runs a hedge fund and a major market maker, and both businesses can profit from volatility and heavy trading. That does not make him wrong, but it does mean his view is informed rather than disinterested. Coverage came mainly from Bloomberg and outlets that syndicated its report.
For you, the point is that owning a future winner and buying a bubble at any price are different things. Your entry price and time horizon decide whether Griffin’s logic helps you or leaves you waiting ten years to break even.
Cisco investors offer the sharpest warning on this point: they were right about the internet yet lost 80-90% of their capital, and the stock took more than 25 years to regain its 2000 peak.
When big ASX news breaks, our subscribers know first
How big is the AI concentration in the S&P 500, and why do the numbers disagree?
The headline figure is striking. Bianco Research, using a 41-stock basket tied to JPMorgan’s classification, puts AI-related stocks at about 48.68% to 49% of S&P 500 market capitalisation. The presenter claimed only US railroads in 1881 were larger, ahead of the dot-com peak, Japan in 1988 and 1929. That historical ranking comes from one source and should be read with that in mind.
Look at what the basket measures, though. It is a share of market value. It does not show 49% of companies or 49% of revenue coming from AI. It includes utilities that power data centres, equipment suppliers, and the entire market value of Apple, Amazon, Alphabet and Meta, even though AI is not the main business of all of them.
Narrow the definition and the number falls.
| Source | Estimate | Definition |
|---|---|---|
| Bianco Research / JPMorgan basket (Oct 2026) | ~49% | 41 AI-related stocks, full market caps, includes utilities and suppliers |
| Bank of America (reported Oct 2026) | ~39%-42% | Roughly 10 major AI names |
| Goldman Sachs (May 2026) | ~41% of market cap, ~34% of earnings | Top 10 companies, not a pure AI measure |
| Goldman Sachs (Jan 2026) | 53% of 2025 return | Contribution of top tech stocks to performance |
The gap between Goldman’s market-cap share and its earnings share is the more telling detail. The largest companies are priced above their current contribution to profits.
Whichever figure you accept, the takeaway is the same. A broad index fund already gives you heavy AI exposure whether or not you chose it, so check your own holdings before adding more.
Which options signals reveal speculation, and how do you read them without being fooled?
Concentration tells you how much money sits in AI. Options activity can show how aggressively traders are betting on it. An option is a contract giving the right to buy (a call) or sell (a put) a stock at a set price, called the strike, before a set date.
Far-OTM call volume
A far out-of-the-money (OTM) call has a strike well above today’s share price, so it only pays off after a large rally.
- What it shows: Micron’s January chain has listed strikes from $100 up to $1,000. Heavy call buying at distant strikes with almost no puts points to one-sided, lottery-style positioning. Compare current volume with the past 20-30 days.
- How it misleads: A trade could be a purchase, a sale or part of a spread. Cheap contracts can produce big volume with little money behind them. A 2025 study found short-dated OTM options can carry information about later returns, but the evidence is mixed. No reliable 2026 figure exists for the far-OTM share of volume in these names.
Put/call balance
The put/call ratio divides put volume by call volume.
- What it shows: Nvidia’s ratio jumped from 0.76 to 1.10 in one session, about a three-standard-deviation move over three years, which signals a sharp shift in sentiment.
- How it misleads: A high ratio can come from put selling as well as defensive buying. A low ratio can reflect covered-call selling. You have to read it alongside direction, maturity and moneyness (how far strikes sit from the share price).
Implied versus realised volatility
Implied volatility (IV) is the size of future price swings priced into options. Realised volatility is how much the stock actually moved.
Because implied volatility is backed out of live option prices rather than past price moves, it captures what traders expect next, which is why a reading far above a stock’s own history deserves scrutiny.
- What it shows: In July, 30-day call IV stood near 45% for Nvidia (52-week range 32%-55%), 95% for Micron and 156% for Nebius. The presenter said most AI names trade with volatility in the 50s-60s or higher and likened 80 to a biotech stock.
- How it misleads: High IV may reflect upcoming earnings or thin, illiquid markets. The presenter’s 80-100+ reading for Nebius and the 156% call IV are different measures taken on different dates.
Run all four checks together:
- Compare call volume with its 20-30 day average
- Check whether put activity balances it
- Compare IV with realised volatility
- Look for confirmation in the company’s fundamentals
A single reading proves nothing. When most of the signals point the same way, that agreement is your clearest sign of froth.
Is the AI buildout different from the dot-com era?
Options data can flag froth in a single stock. Whether the whole cycle repeats 2000 depends on what sits underneath the share prices.
Where the comparison holds
Valuations rest on a powerful story, and the announced infrastructure pipeline is enormous. According to one industry dataset, about 65 GW (gigawatts) of data-centre capacity is under construction and 361 GW has been announced, yet only 12.9 GW is expected to come online in 2026. That gap points to delays or cancellations.
Financing has shifted as well. LSEG data cited by The Hill shows Amazon, CoreWeave, Google, Meta, Microsoft and Oracle issued $193B in bonds by early August, against $16.7B in all of 2024. IMF economist Nathalie van Leenders has warned about companies financing each other and buying each other’s stock. The IMF’s “triple-whammy” scenario combines falling equity values, harder debt servicing and missed revenues.
Where it breaks
Today’s leaders earn real profits and own physical assets. Demand is also measurable. JLL reports 66 GW under construction in North America, 95% pre-committed to tenants, hyperscalers accounting for 59% of 2026 tenant demand, and vacancy at 1%.
Spending keeps rising. Reuters, citing LSEG, reported that consensus 2026 capex (capital expenditure) for five hyperscalers climbed from about $485B in January to $730B in July. Later estimates range from $660B to $800B, depending on how Oracle’s commitments and fiscal years are treated.
| Factor | Dot-com era | Today |
|---|---|---|
| Earnings | Many firms with little revenue | Profitable incumbents with large cash flows |
| Assets | Websites and fibre | GPUs, power, buildings |
| Valuations | Peak forward multiples | Below dot-com peaks (Bank of England) |
| Financing | Equity-heavy | Bond issuance rising fast |
Watch for these slowdown warnings:
- Falling GPU rental prices or utilisation
- Customers deferring capacity
- Hyperscaler free cash flow staying negative for longer than expected
- Delays caused by power and permitting
The real test is whether utilisation covers depreciation and interest costs. A slowdown in construction would tell you more than any single week of share price swings.
For readers wanting to test whether spending is earning returns, our full explainer on AI capex versus monetisation shows how capex now absorbs 93-94% of hyperscaler operating cash flow.
Where do the major voices land, and what is the recent pullback telling us?
The leading voices broadly agree on the risk. Where they split is on the label.
| Voice | Date | Position |
|---|---|---|
| Bank of England FPC | Oct 2025 | Sharp correction risk raised; valuations below dot-com peaks |
| IMF | Oct 2026 | Correction possible if AI earnings disappoint; baseline does not call it a bubble |
| Sam Altman, OpenAI | 2025 | Investors may be overexcited |
| Jamie Dimon, JPMorgan | 2025 | Correction possible given spending and valuations |
| Ken Griffin, Citadel | Oct 2026 | Almost certainly a bubble, with durable leaders |
IMF Managing Director Kristalina Georgieva summed up the tension this month.
Amara’s Law: Societies tend to overestimate a technology’s short-term effects and underestimate its long-term ones, a framing Georgieva applied to AI.
None of these voices doubts that AI matters economically. The disagreement is over whether prices, debt and spending plans already assume too much future value.
Applying four analytical frameworks, including Minsky, Kindleberger, Sharma and Shiller CAPE, produces split verdicts on the AI bubble question, because each measures different variables and none settles the debate alone.
The pullback in AI names that began in June and lasted at least a month complicates the tidy bubble story. The Tasty Live presenter argued that a sustained correction of that kind is not typical bubble behaviour, though that is one analyst’s reading.
On balance, the evidence supports Griffin’s narrower claim that parts of the market look speculative. It does not support a dot-com-style collapse thesis. The better question for you is which of your holdings depend on AI earnings arriving on schedule.
What the evidence supports, and the signals worth tracking from here
Parts of the AI trade look speculative, yet the demand behind the buildout is real and measurable. The open question is whether earnings catch up with the concentration, capex and debt already priced in. Options signals help you gauge froth in individual names, but they are not timing tools. Griffin’s Amazon lesson cuts both ways: winners can survive, and buyers at the peak can still wait a decade to recover.
From here, four signals deserve your attention:
- GPU rental prices and data-centre utilisation
- Hyperscaler free cash flow trends
- Several options signals turning frothy at the same time
- Delays or cancellations in construction
This article is for informational purposes only and should not be considered financial advice. Investors should conduct their own research and consult with financial professionals before making investment decisions. Past performance does not guarantee future results, and forward-looking estimates are subject to change.