The S&P 500 rose just 0.28% on Tuesday, a move that looks like a quiet session until you check what sat underneath it. 403 of the index’s stocks finished higher, the most since April, while the equal-weighted version of the index climbed 1.15%. The stock market breadth behind that modest headline was among the strongest in six months.
That strength came after a rough start. AI worries, rising oil prices and stress in French government debt pushed equities lower early in the day, before the selling reversed once US trading opened.
The timing matters. Meta reports after the close today, Wednesday 21 October, as the first of the hyperscalers (the giant cloud and platform companies spending heavily on AI infrastructure) to post results.
Here is what Tuesday’s session does and does not prove about who is leading this market, and how you can read breadth signals like it without being misled by a single day.
What did Tuesday’s reversal actually show beneath the index level?
On the surface, Tuesday was unremarkable. A gain of 0.28% barely registers in a year of sharp swings.
The session’s path was more eventful. Deutsche Bank strategist Jim Reid pointed to a wide-ranging selloff at the open, fuelled by unease over AI, pricier crude and lingering strain in French government bonds. Chip stocks fell close to 2.5% at their worst before recovering most of that ground.
Jim Reid, Deutsche Bank: Reid said the early decline turned around once US trading began, as cheaper energy toward the close of European hours supported a rally and investors shook off part of their earlier unease about AI.
The comparison between indices tells you where the buying went.
| Index or measure | Tuesday’s move |
|---|---|
| S&P 500 | +0.28% (403 advancers, most since April) |
| Equal-weighted S&P 500 (RSP) | +1.15% |
| Nasdaq Composite | -0.02% |
| Philadelphia Semiconductor Index | -0.29% |
The equal-weighted index holds the same companies as the S&P 500 but gives each one roughly a 0.2% weight, so a small retailer counts as much as Nvidia. According to MarketWatch, that version rose 1.15%, beating the cap-weighted index by 0.87 percentage points.
Meanwhile the Nasdaq and the semiconductor index finished essentially flat. The exact number of decliners was not available, but the pattern is clear without it.
What this tells you is that Tuesday’s gain came from the median stock, not from the handful of giants that usually decide the index’s direction. The real story of the session sits in that gap.
When big ASX news breaks, our subscribers know first
How do you read stock market breadth without overreading one day?
Breadth measures how many stocks are taking part in a move, rather than how far the index itself travelled. Because the S&P 500 is capitalisation-weighted, meaning larger companies carry more influence, a few mega-caps can lift the index while most of its members fall.
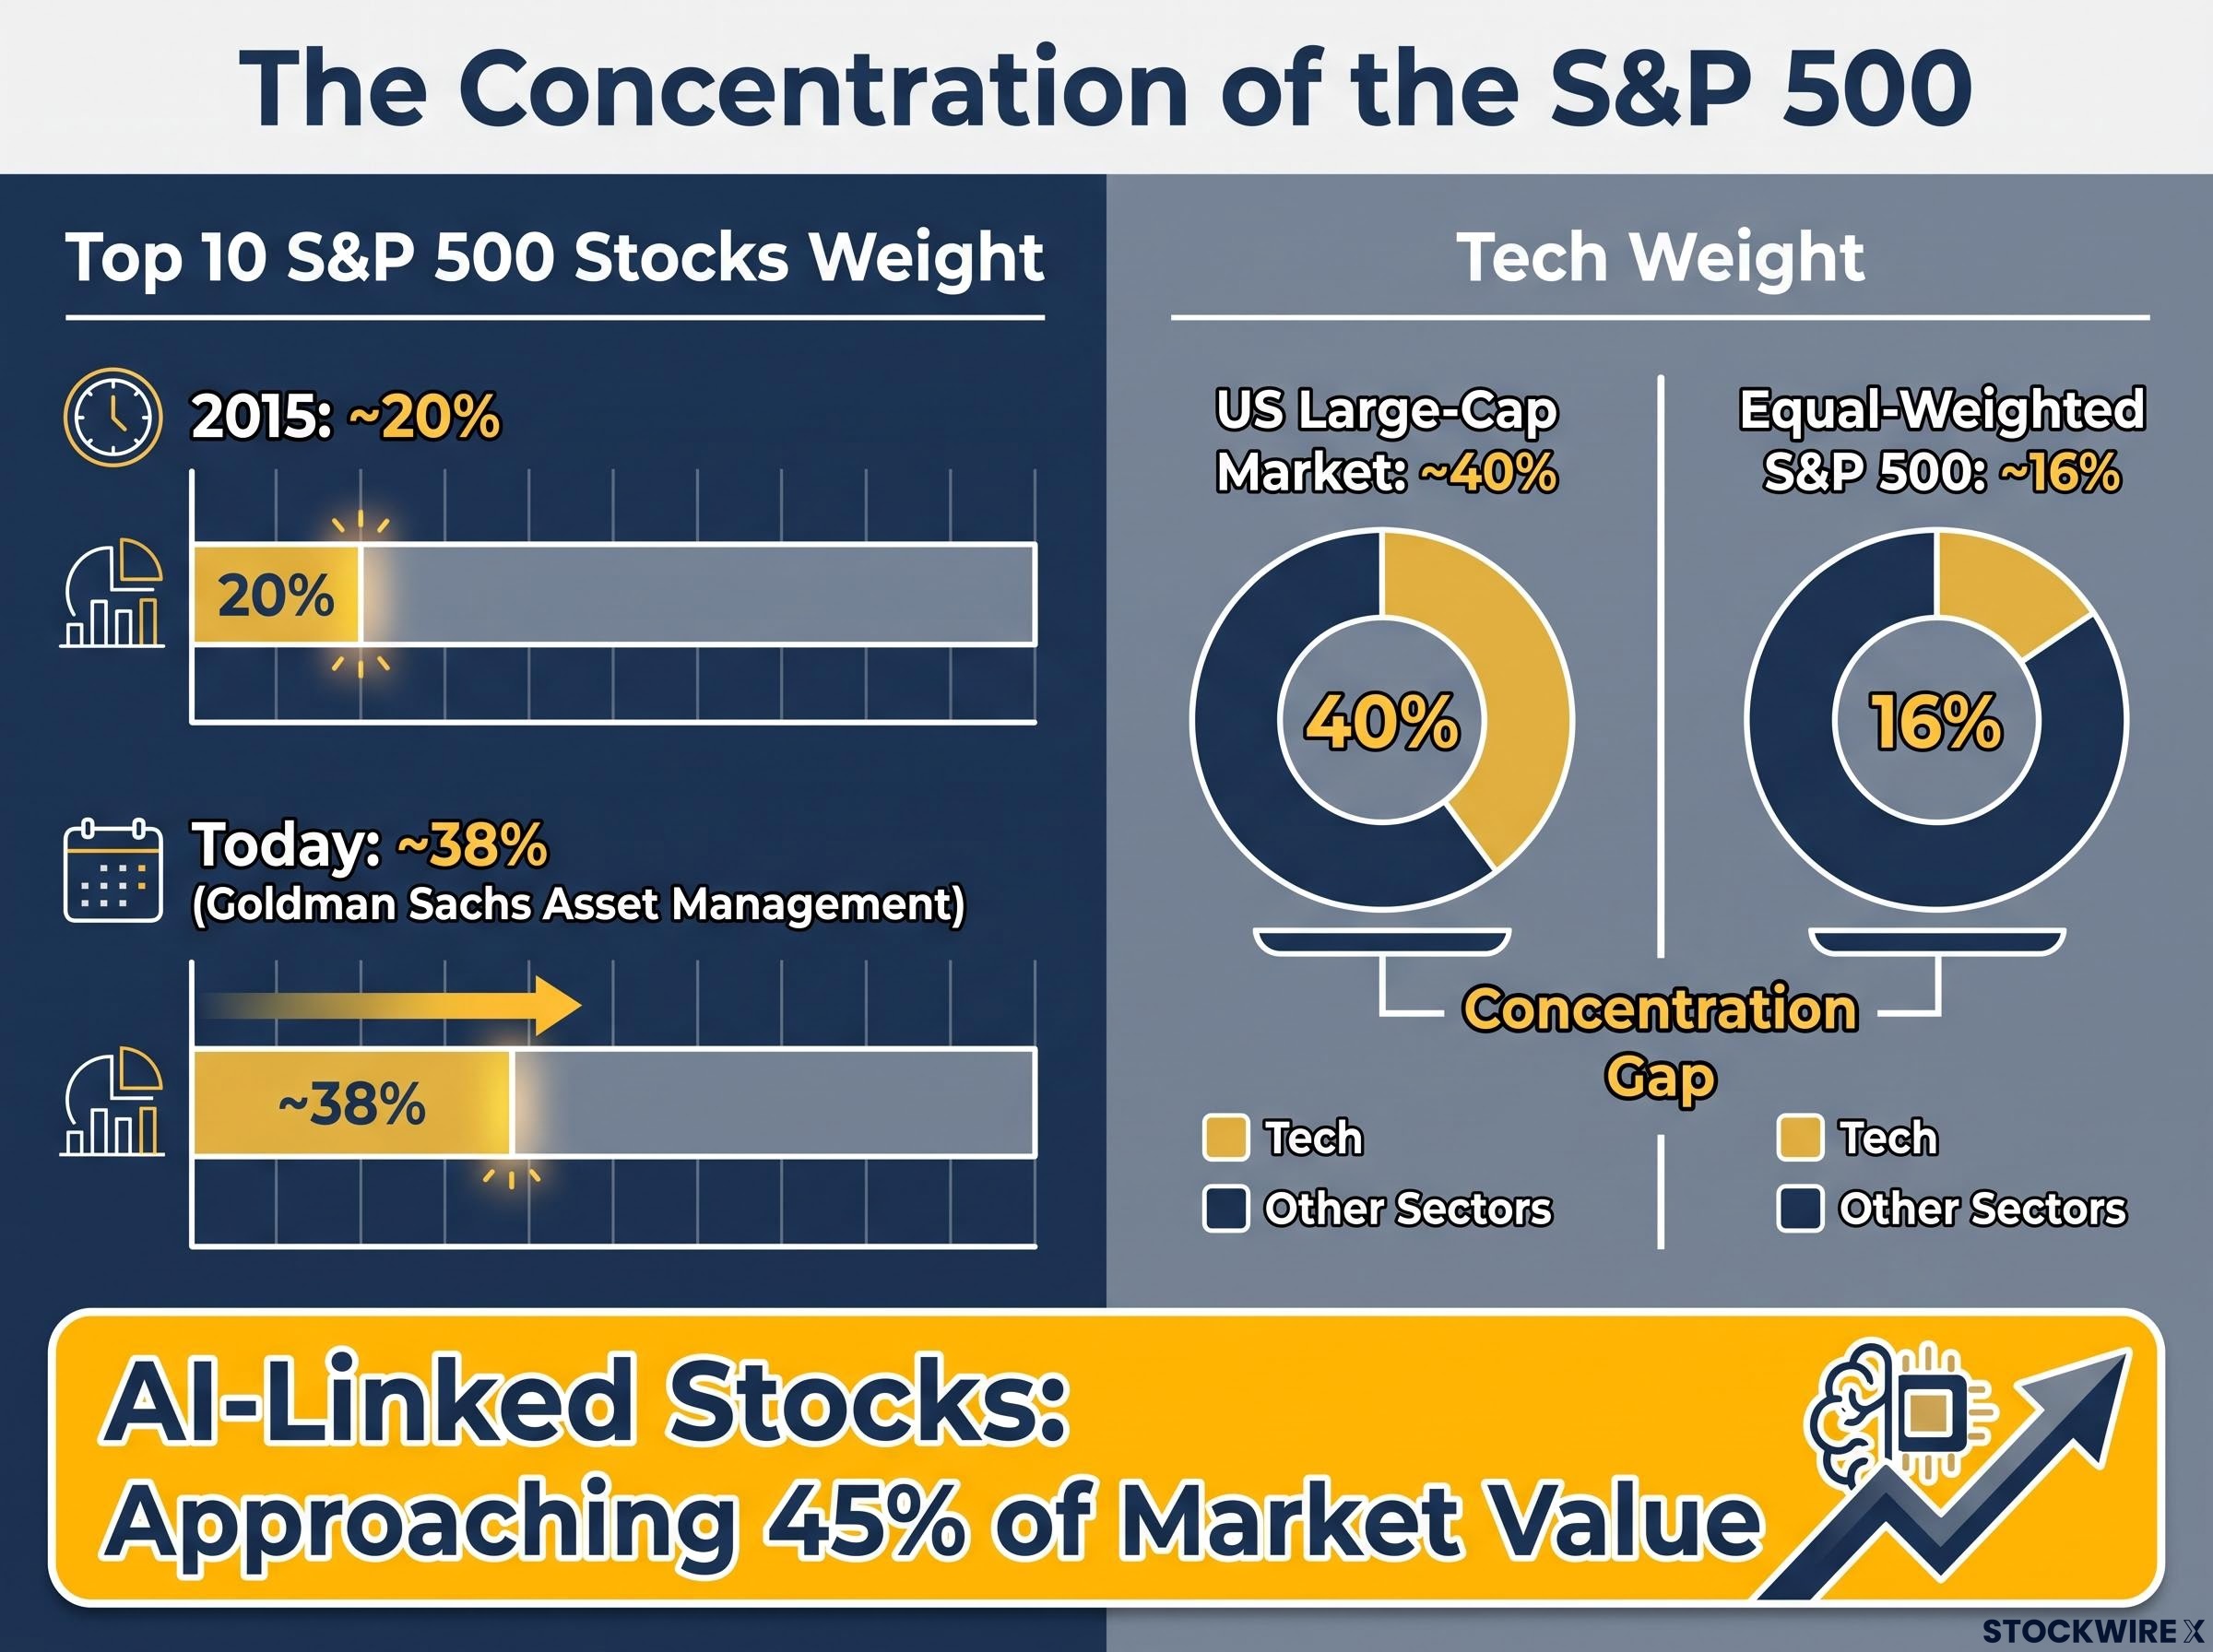
The scale of that distortion is large. Recent reporting put technology at about 40% of the US large-cap market, against only about 16% of the equal-weighted S&P 500.
The main gauges each catch a different angle:
- Advance-decline line: a running total of advancing minus declining stocks, showing whether participation is building or fading over time.
- New highs versus new lows: whether more stocks are breaking upward than collapsing to fresh lows.
- Percentage of stocks above moving averages: how many companies trade above their average price over a set period, a gauge of underlying trend health.
- Equal-weight relative performance: whether the typical stock is beating the index’s largest names.
Charles Schwab frames advancing-versus-declining counts and moving-average participation as complementary measures, each filling gaps the other leaves. A rising index paired with weak breadth is the warning sign: it tells you leadership has narrowed.
Moving average participation has been the weak point this autumn, with fewer than a third of S&P 500 stocks trading above their 50-day average even as the headline index held near its highs, which is why one strong session needs confirmation.
The most celebrated breadth signal is the Zweig breadth thrust. It triggers when the share of advancing stocks jumps from below 40% to above 61.5% within ten trading days, marking a rapid swing from broad selling to broad buying. Commonly cited examples include 1962, 1971, 1982 and 2009, with the 1982 and 2009 signals arriving near major market bottoms.
Tuesday was not a confirmed thrust.
Why a single session is noisy
One day of 403 advancers cannot establish a trend. Breadth earns its credibility through repetition: cumulative advance-decline lines turning higher, rising volume, and leadership spreading into sectors that respond to economic growth.
The practical rule: A positive breadth day confirms that participation improved. It is not, on its own, a confirmed breadth thrust.
Treat Tuesday as evidence that participation improved, and wait for several weeks of confirming readings before calling it a change in market regime.
Why does AI spending concentrate the index, and is the broadening healthy?
To understand why breadth has been so weak, follow the money from AI budgets to index weights. The chain has four links:
- Concentrated capital spending. S&P Global‘s consensus for 2026 hyperscaler capex (capital expenditure, money spent on long-term assets such as data centres) sits at about $790 billion, against $404 billion the prior year.
- Spenders absorb near-term costs. The platforms building capacity may carry weaker margins, higher depreciation and uncertain returns.
- Suppliers collect immediate revenue. Chip, memory, networking and power firms can grow earnings faster than their customers.
- Index arithmetic magnifies the result. When the largest stocks rise, their weight drags the S&P 500 up regardless of the median stock.
Reid splits the AI trade into companies that pay for infrastructure and companies that get paid by it. Spenders have lagged while suppliers benefited, which explains how the index can stay resilient even when some of its biggest names stumble.
The concentration that results is striking. Goldman Sachs Asset Management calculates that the ten largest S&P 500 stocks rose from roughly 20% of index weight in 2015 to about 38% today. Goldman-related reporting describes AI-linked stocks as approaching 45% of the index’s market value.
Healthy broadening or just rotation?
Goldman Sachs strategist Lee Coppersmith said the bank’s preferred breadth measure had sunk to its weakest level since the dot-com bubble, yet he still favoured the S&P 500 over one to three months, arguing a tech reset could let other sectors and small caps participate. In August 2026, Goldman’s research team found equal-weight performance had beaten cap-weight by more than 7.3% for the first time since 2009.
Morningstar offers the counterweight: broadening may reflect a shift into lower-quality or cyclical areas rather than better economic conditions.
| Type | Signal | What you would see | Risk |
|---|---|---|---|
| Healthy broadening | Sustained equal-weight lead | Improving earnings revisions; banks, industrials, consumer names and small caps rising with volume | Lower; less reliance on one narrative |
| Rotation-driven broadening | Equal-weight lead driven by tech selling | Defensives and laggards bought as mega-caps are sold; no earnings improvement | Higher; breadth improves mechanically without stronger fundamentals |
For your portfolio, an equal-weight lead is only reassuring if earnings revisions and cyclical participation back it up. Otherwise it may simply mean the mega-cap names dominating your index fund are being sold.
What could confirm or break the breadth signal this week?
The debate will not stay theoretical for long. Three catalysts land within days, and each could validate or undo Tuesday’s message.
Meta reports after today’s close alongside Tesla. According to S&P Global Market Intelligence, consensus expects revenue of $63.3 billion, operating profit of $16.9 billion and a Reality Labs loss of about $5.7 billion, with 2026 capex forecast at $139.7 billion. That spending figure sets a high bar for advertising and AI revenue to clear.
Some banks argue hyperscaler capex forecasts still sit well below where spending is heading, with Barclays modelling roughly $1 trillion in 2027, which raises the bar for Meta and its peers to show matching revenue growth.
SpaceX offered an early lift. Its Q3 revenue reached $14.58 billion, up 161%, with adjusted earnings per share of $0.45 against $0.13 expected and capex of $19.6 billion. Reports of the after-hours reaction conflict: CNBC and Reid cited roughly 8% initially, while later Yahoo Finance reports recorded about 2%.
Overnight, Nasdaq futures rose 0.75% and S&P futures 0.30%. Still, one supplier-side beat does not prove hyperscaler spending will earn adequate returns.
Macro pressure has not gone away either. Reuters puts Brent crude near or above $111, roughly a five-month high. The French 10-year bond (OAT) yield sits around 4.92%-4.94% after touching close to 4.99%, its highest since 2002, while the gap over German Bunds is reported at 144-151 basis points depending on source and timing.
| Catalyst | Latest reading | What would challenge breadth |
|---|---|---|
| Meta Q3 results | 2026 capex consensus $139.7B | Revenue growth lagging spending |
| Brent crude | Near or above $111 | Further gains reviving inflation and rate fears |
| French debt | 10-year yield about 4.92%-4.94% | A disorderly selloff tightening global conditions |
The main risks to watch:
- Oil reversing the rotation by hurting both tech and cyclical stocks
- Fiscal stress spreading from France across asset markets
- Earnings disappointment punishing the wider AI complex
- Supplier strength mistaken for end-demand strength
Read Meta’s capex and revenue growth as the first real test of whether the spender side of the AI trade can justify its costs. That answer decides whether tech drags on the market or joins the broadening.
Past performance does not guarantee future results. Forecasts and consensus figures are subject to market conditions and may change.
Reading the rebound: what Tuesday settles, and what it leaves open
Tuesday settles one thing: participation improved, and it improved outside mega-cap tech. It does not settle whether the AI concentration problem has ended.
Three checks will tell you more. Watch whether equal-weight leadership holds for weeks, whether Meta’s revenue story keeps pace with its capex, and whether oil and French yields stay contained.
Your practical step is simple. Track one breadth gauge, such as the advance-decline line or equal-weight relative performance, over weeks rather than days, and check how much of your own holdings sits in the same handful of names driving the index.
Index fund concentration means holders of a standard US fund carry heavy exposure to a handful of mega-cap names by default, so it is worth checking how much of your own holdings overlap with the same top five.
This article is for informational purposes only and should not be considered financial advice. Investors should conduct their own research and consult with financial professionals before making investment decisions.
—