
Sterling rose about 0.70% against the US Dollar on 20 October 2026, climbing from an intraday low near 1.3300 to trade close to 1.3400. It was the strongest major currency of the session, and it shifted the GBP/USD forecast just as the pair reached a level that has capped previous rallies.
Three forces drove the move. A UK jobs report beat forecasts by a wide margin, money markets moved to price a November Bank of England (BoE) rate rise as near certain, and the Dollar softened on geopolitical headlines and weak US housing data.
The rally now sits directly beneath a stacked technical ceiling. Here is which driver is solid, which is shaky, and which price levels will decide whether the rebound extends.
What is really holding the Dollar down: a thin Iran report and a record-weak US housing print
The Dollar side of the pair is the less certain half of the story. FXStreet reported the US Dollar Index (DXY), which measures the Dollar against a basket of major currencies, falling 0.32% to 101.66. Other sources have not independently confirmed that level.
The Iran reports: what is confirmed and what is not
Israel’s Channel 12 reported that a proposal delivered by Pakistan’s army chief had US approval and tentative acceptance from Tehran. Reports attributed to Al-Araby Al-Jadeed described a Pakistan and Qatar compromise under which Qatar would release $6 billion of Iranian funds and Iran would permit a confidential International Atomic Energy Agency (IAEA) visit to its nuclear sites.
No final agreement is confirmed. Official statements cited by Reuters said Tehran was still reviewing US proposals, and Pakistan’s Interior Minister Mohsin Naqvi said peace could not be achieved in one meeting. Sequencing, nuclear scope, frozen funds, verification and the Strait of Hormuz all remain unresolved.
The market logic still runs in a clear chain:
- A credible arrangement lowers the risk of renewed escalation.
- Lower escalation risk trims the oil risk premium.
- Cheaper oil eases inflation pressure.
- Reduced safe-haven demand weakens the Dollar.
- A weaker Dollar lifts GBP/USD.
Reuters reported that sterling had already benefited as oil fell. The reverse also holds: failed mediation or disruption around Hormuz could lift oil and send investors back into the Dollar.
US housing: a record low with mixed Fed signals
The harder data point came from the National Association of Realtors (NAR).
Pending home sales, September Index at 66.0, down 7.3% month-on-month and 11.3% year-on-year, the lowest since the series began in 2001. Consensus was about -0.5%.
Freddie Mac data showed the 30-year mortgage rate averaging 7.40%, the highest in nearly three years. NAR chief economist Lawrence Yun blamed rapidly rising mortgage rates, adding that they may be near a ceiling.
Mortgage rates track long-end Treasury yields more closely than the Fed’s benchmark rate, which is why the 7.40% average can keep housing weak while still supporting the Dollar.
You should treat the Iran headline as sentiment that can reverse within hours, while the housing slump is confirmed. Even so, it does not prove the Federal Reserve will change course, and the higher yields behind those mortgage rates can support the Dollar in the short term.
Why the UK jobs surprise lifted sterling, and why the Bank of England case is not settled
The UK numbers did the heavy lifting. The Office for National Statistics (ONS) reported employment rising by 102,000 in the June-August quarter, against forecasts of just 5,100.
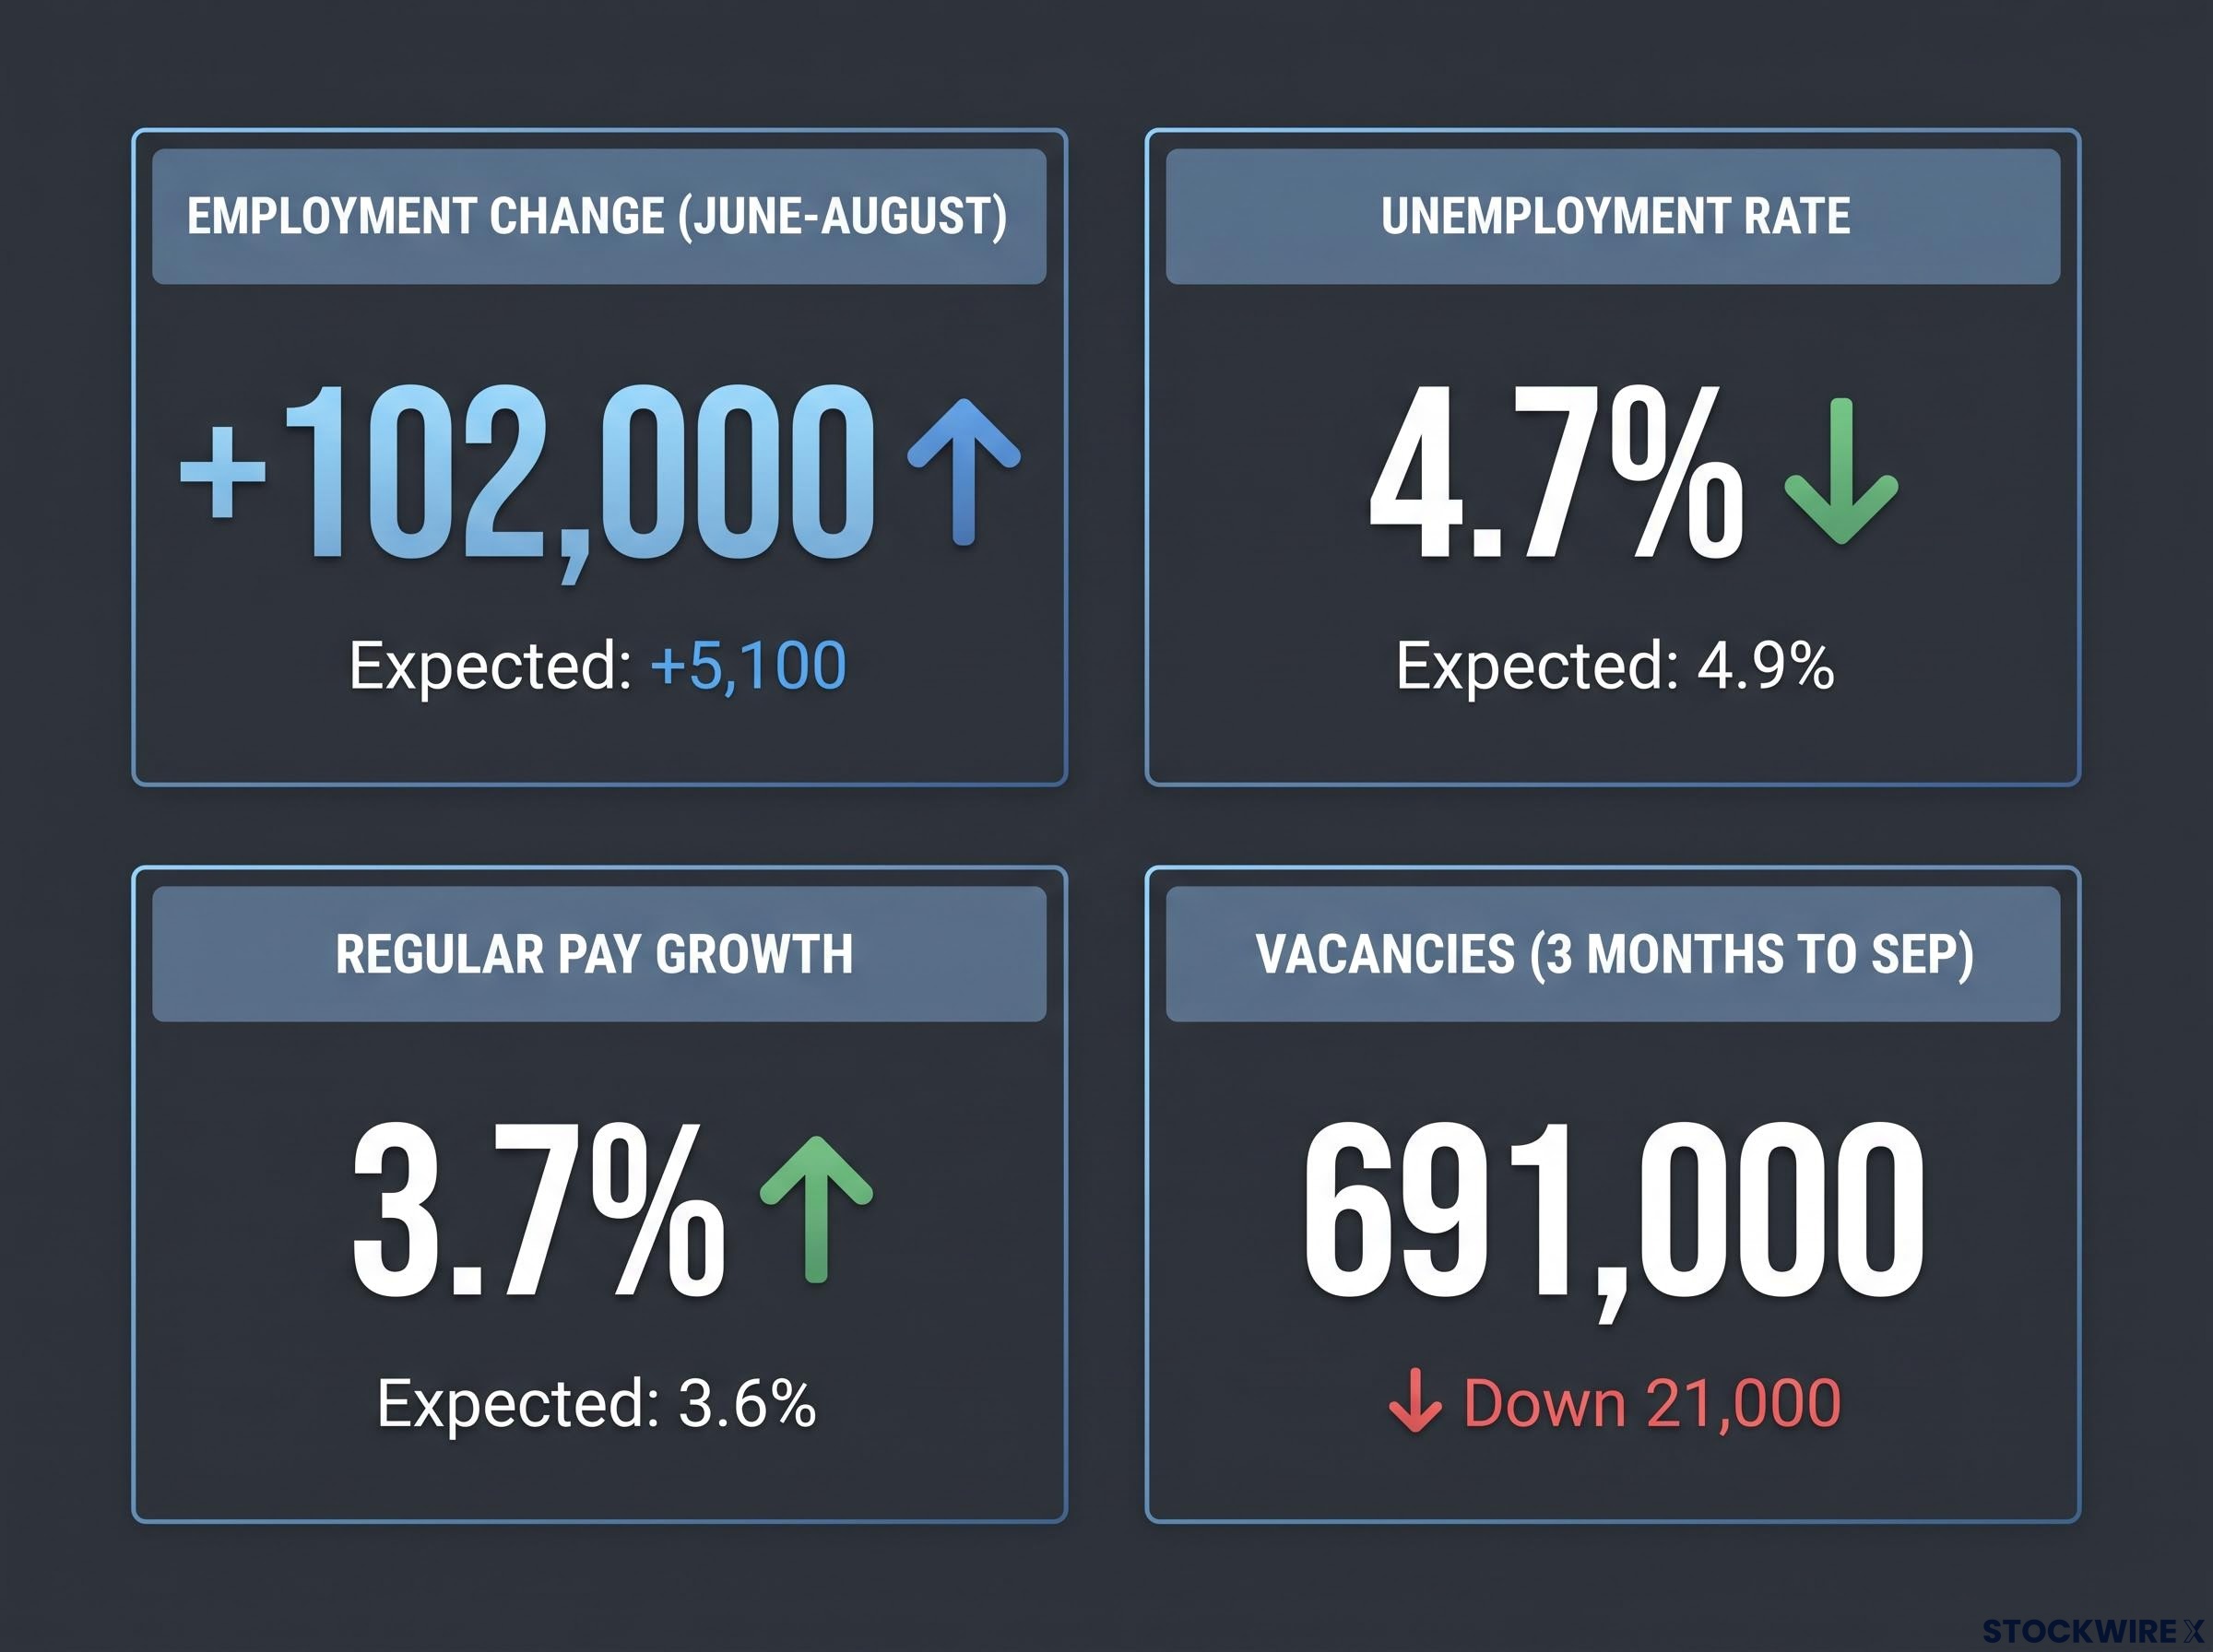
The numbers behind the beat
| Indicator | Latest | Expected/Prior |
|---|---|---|
| Employment change (June-August) | +102,000 | +5,100 expected |
| Unemployment rate | 4.7% | 4.9% expected |
| Regular pay growth | 3.7% | 3.6% expected |
| Vacancies (three months to September) | 691,000 | Down 21,000 |
Reuters read the figures as a sign the labour market may be bottoming. Money markets were “almost fully pricing” a 25 basis point rise (a quarter of a percentage point), and Prime Terminal put the odds at 93%. Bank Rate stands at 3.75% after a 6-3 vote to hold, with Huw Pill, Megan Greene and Catherine Mann backing 4.00%.
Hawks, doves and the data quality problem
“Exceedingly likely.” Thomas Pugh, Economist, RSM UK, on a November hike.
Economists split on what comes next:
- Case for a November hike: Pugh sees the growth and inflation trade-off easing, while Deutsche Bank says the case strengthens if inflation climbs above 4%.
- Reasons for caution: Lloyds’ Nikesh Sawjani says falling vacancies do not justify an aggressive run of hikes, and ING judges roughly 100 basis points of 2027 tightening as too hawkish.
The base is contested too. The Labour Force Survey is being overhauled, the employment gain carries a margin of about ±176,000, and vacancies are at their lowest outside the pandemic since 2014. Rabobank adds that rising sterling short positions and budget worries could offset the data.
The employment surge sits against a bifurcated UK labour market, where private-sector wage growth has cooled while public-sector pay runs far hotter, which complicates how much weight the MPC can place on one strong quarter.
With a hike almost fully priced, the jobs beat is largely in sterling already. Watch whether September inflation confirms it, rather than expecting the jobs data alone to push the pair higher.
GBP/USD forecast: the levels and dates that decide whether 1.3400 breaks
That leaves the pair at a decision point on the chart, where the fundamentals now have to prove themselves.
Key levels
StoneX and FXStreet map different layers of the same structure rather than contradicting each other. A simple moving average (SMA) is the average closing price over a set number of days. The FXStreet technical section was written with AI assistance and puts price at 1.3375, with the Relative Strength Index (RSI), a momentum gauge, at a mildly positive 56.3.
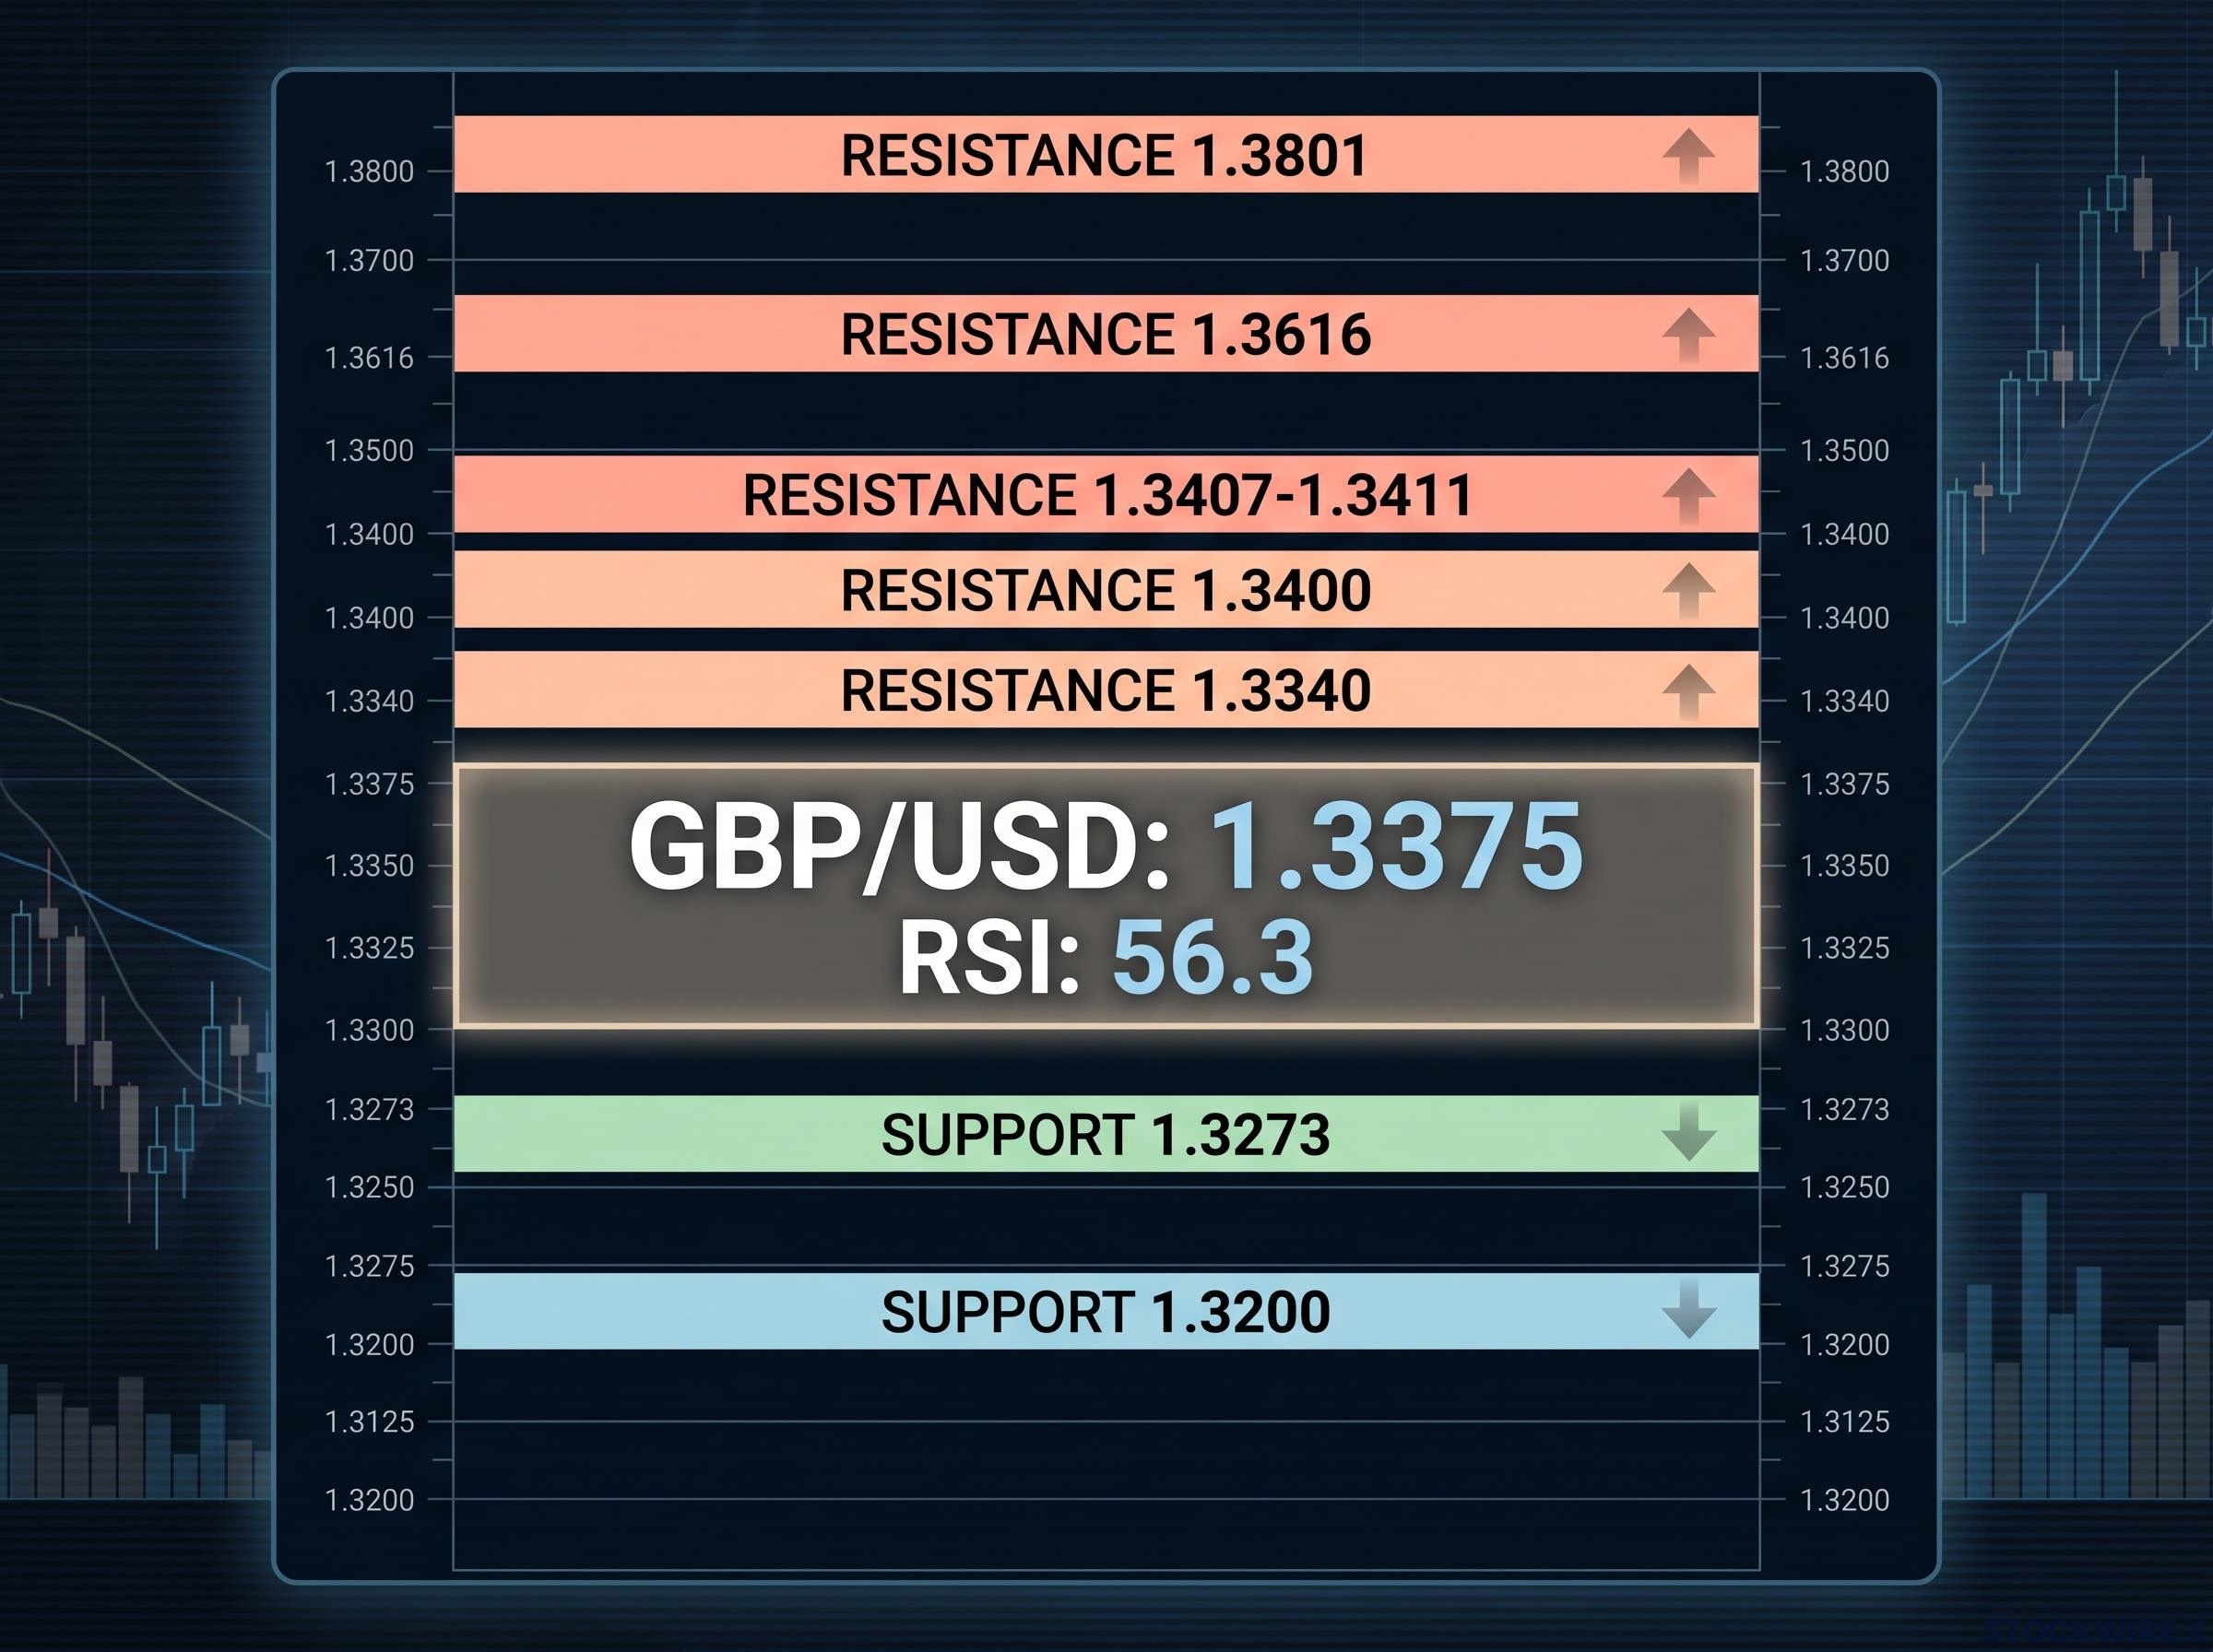
| Level | Type | Source | What it signals |
|---|---|---|---|
| 1.3801 | Resistance | FXStreet | Extended target after a breakout |
| 1.3616 | Resistance | FXStreet | First target above the SMA cluster |
| 1.3407-1.3411 | Resistance | FXStreet | Trendline and 50, 100, 200-day SMAs |
| 1.3400 | Resistance | StoneX | 200-day EMA; failure risks retracement |
| 1.3340 | Resistance | StoneX | Initial hurdle |
| 1.3273 | Support | FXStreet | Break adds bearish pressure |
| 1.3200 | Support | StoneX | Main support zone |
Below the SMA cluster and trendline, the rebound reads as corrective, meaning a bounce within a weaker trend. Treat a daily close above roughly 1.3411 as the signal that matters, and a slip under 1.3273 as the sign the rally is fading.
For readers wanting to read these levels systematically, our dedicated guide to a repeatable GBP/USD framework shows how moving averages, RSI and layered resistance combine into a directional call.
Calendar to watch
- 22 October: US Initial Jobless Claims, with no major US data on 21 October.
- UK September inflation.
- UK September Retail Sales.
- The November BoE meeting.
What the rebound confirms, and what it still has to prove
The rally combined one confirmed driver in strong UK labour data, one fragile driver in unconfirmed Iran reports, and one ambiguous driver in record-weak US housing. Only the first rests on published numbers, and even that carries survey caveats.
Technically, the move still looks corrective while GBP/USD trades below the 1.3400-1.3411 zone. The next UK inflation print, and whether the pair closes above or below those levels, will show which narrative wins.
This article is market reporting for informational purposes only and should not be considered financial advice. Investors should conduct their own research and consult with financial professionals before making investment decisions. Past performance does not guarantee future results, and technical levels and forecasts are subject to market conditions and various risk factors.