
The UK economy is producing more with fewer people. Payrolls are shrinking, vacancies are at their lowest in five years, and yet the Bank of England just voted 6-3 to keep interest rates at 3.75%.
That combination is harder to read than it first looks. Falling headcount usually signals an economy under strain, the kind of slack a central bank wants to see before it starts cutting rates. But output is still growing, which means productivity is rising by arithmetic alone, and wages in parts of the economy remain uncomfortably warm.
For anyone tracking where UK rates go next, the September labour market release is a moment of genuine ambiguity. Private-sector wage growth has cooled to 2.9%, yet public-sector pay is running at 6.3% and services inflation has refused to retreat cleanly. Which of those signals is doing the most work inside the Monetary Policy Committee (MPC) matters enormously for the rate path.
Here is the map you need: which labour market indicators the MPC actually watches, why the productivity subplot muddies the story, and what the 6-3 split reveals about the internal debate that will shape the decision on 17 September 2026.
What the September data actually show about UK employment
Start with the payrolls, because that is where the weakness is clearest. HMRC data show 30.2 million payrolled employees in July 2026, down 101,000 on the year and down 19,000 on the month. A flash estimate for August 2026 points to a further monthly fall of 26,000.
Vacancies tell the same story from a different angle. There were 712,000 open positions across April to June 2026, following a quarter that had already fallen by 29,000 to 711,000 — the lowest level since early 2021. Fewer roles advertised means firms are pulling back on hiring intentions, not just replacements.
Unemployment, meanwhile, held steady at 4.9%. That stability alongside falling payrolls suggests the labour market is loosening at the edges rather than cracking outright.
| Indicator | Latest figure | Period | Change | Direction |
|---|---|---|---|---|
| HMRC payrolled employees | 30.2 million | July 2026 | -101,000 YoY | Falling |
| Payrolled employees (flash) | -26,000 | August 2026 | -0.1% MoM | Falling |
| ONS Workforce Jobs | 36.7 million | June 2026 | +60,000 YoY | Broadly flat |
| Job vacancies | 712,000 | Apr-Jun 2026 | Up from 711,000 in Jan-Mar 2026 | Falling |
| Unemployment rate | 4.9% | Latest | Steady | Stable |
The broader ONS Workforce Jobs measure sits at 36.7 million for June 2026, an annual increase of just 60,000. That figure is the counterpart to the HMRC payroll series, and the two tell a consistent story: labour demand is weak, but it is not collapsing.
The ONS UK labour market release for August 2026 provides the underlying series behind the payroll, vacancy, and wage figures the MPC is actively weighing, including the breakdown between private and public sector pay that has proven most consequential for the rate debate.
Sanjay Raja, Chief UK Economist at Deutsche Bank, sums up the backdrop as “still weak,” pointing to falling employment and vacancies sitting alongside rising productivity. That last detail is what stops this from being a straightforward bad-news release.
The UK GDP growth trajectory through 2026 complicates the rate story further: Q1 2026 delivered a 0.6% quarterly expansion that prompted the IMF to hold its full-year forecast at just 0.8%, implying subsequent quarters must slow sharply, a deceleration path that would add labour market slack faster than the current payroll data alone suggests.
Read together, these numbers confirm that restrictive policy is generating exactly the labour market slack the MPC expected. For investors, that reduces the probability the committee feels forced to tighten further, though it does not eliminate it.
Productivity rising as headcount falls
The arithmetic here is simple. If GDP grows faster than the number of workers producing it, output per worker rises by definition.
Raja frames it directly: “economic growth continues to outpace expectations with fewer employees,” which means “productivity growth, by definition, is pushing higher.” That is a supportive signal for the disinflation story, because an economy that grows without adding jobs is generating less wage pressure.
He is careful not to overstate it. There is no evidence yet, in his view, that the labour market has fully stabilised, which keeps the read honest rather than optimistic.
When big ASX news breaks, our subscribers know first
Why the wage picture is more complicated than the headline
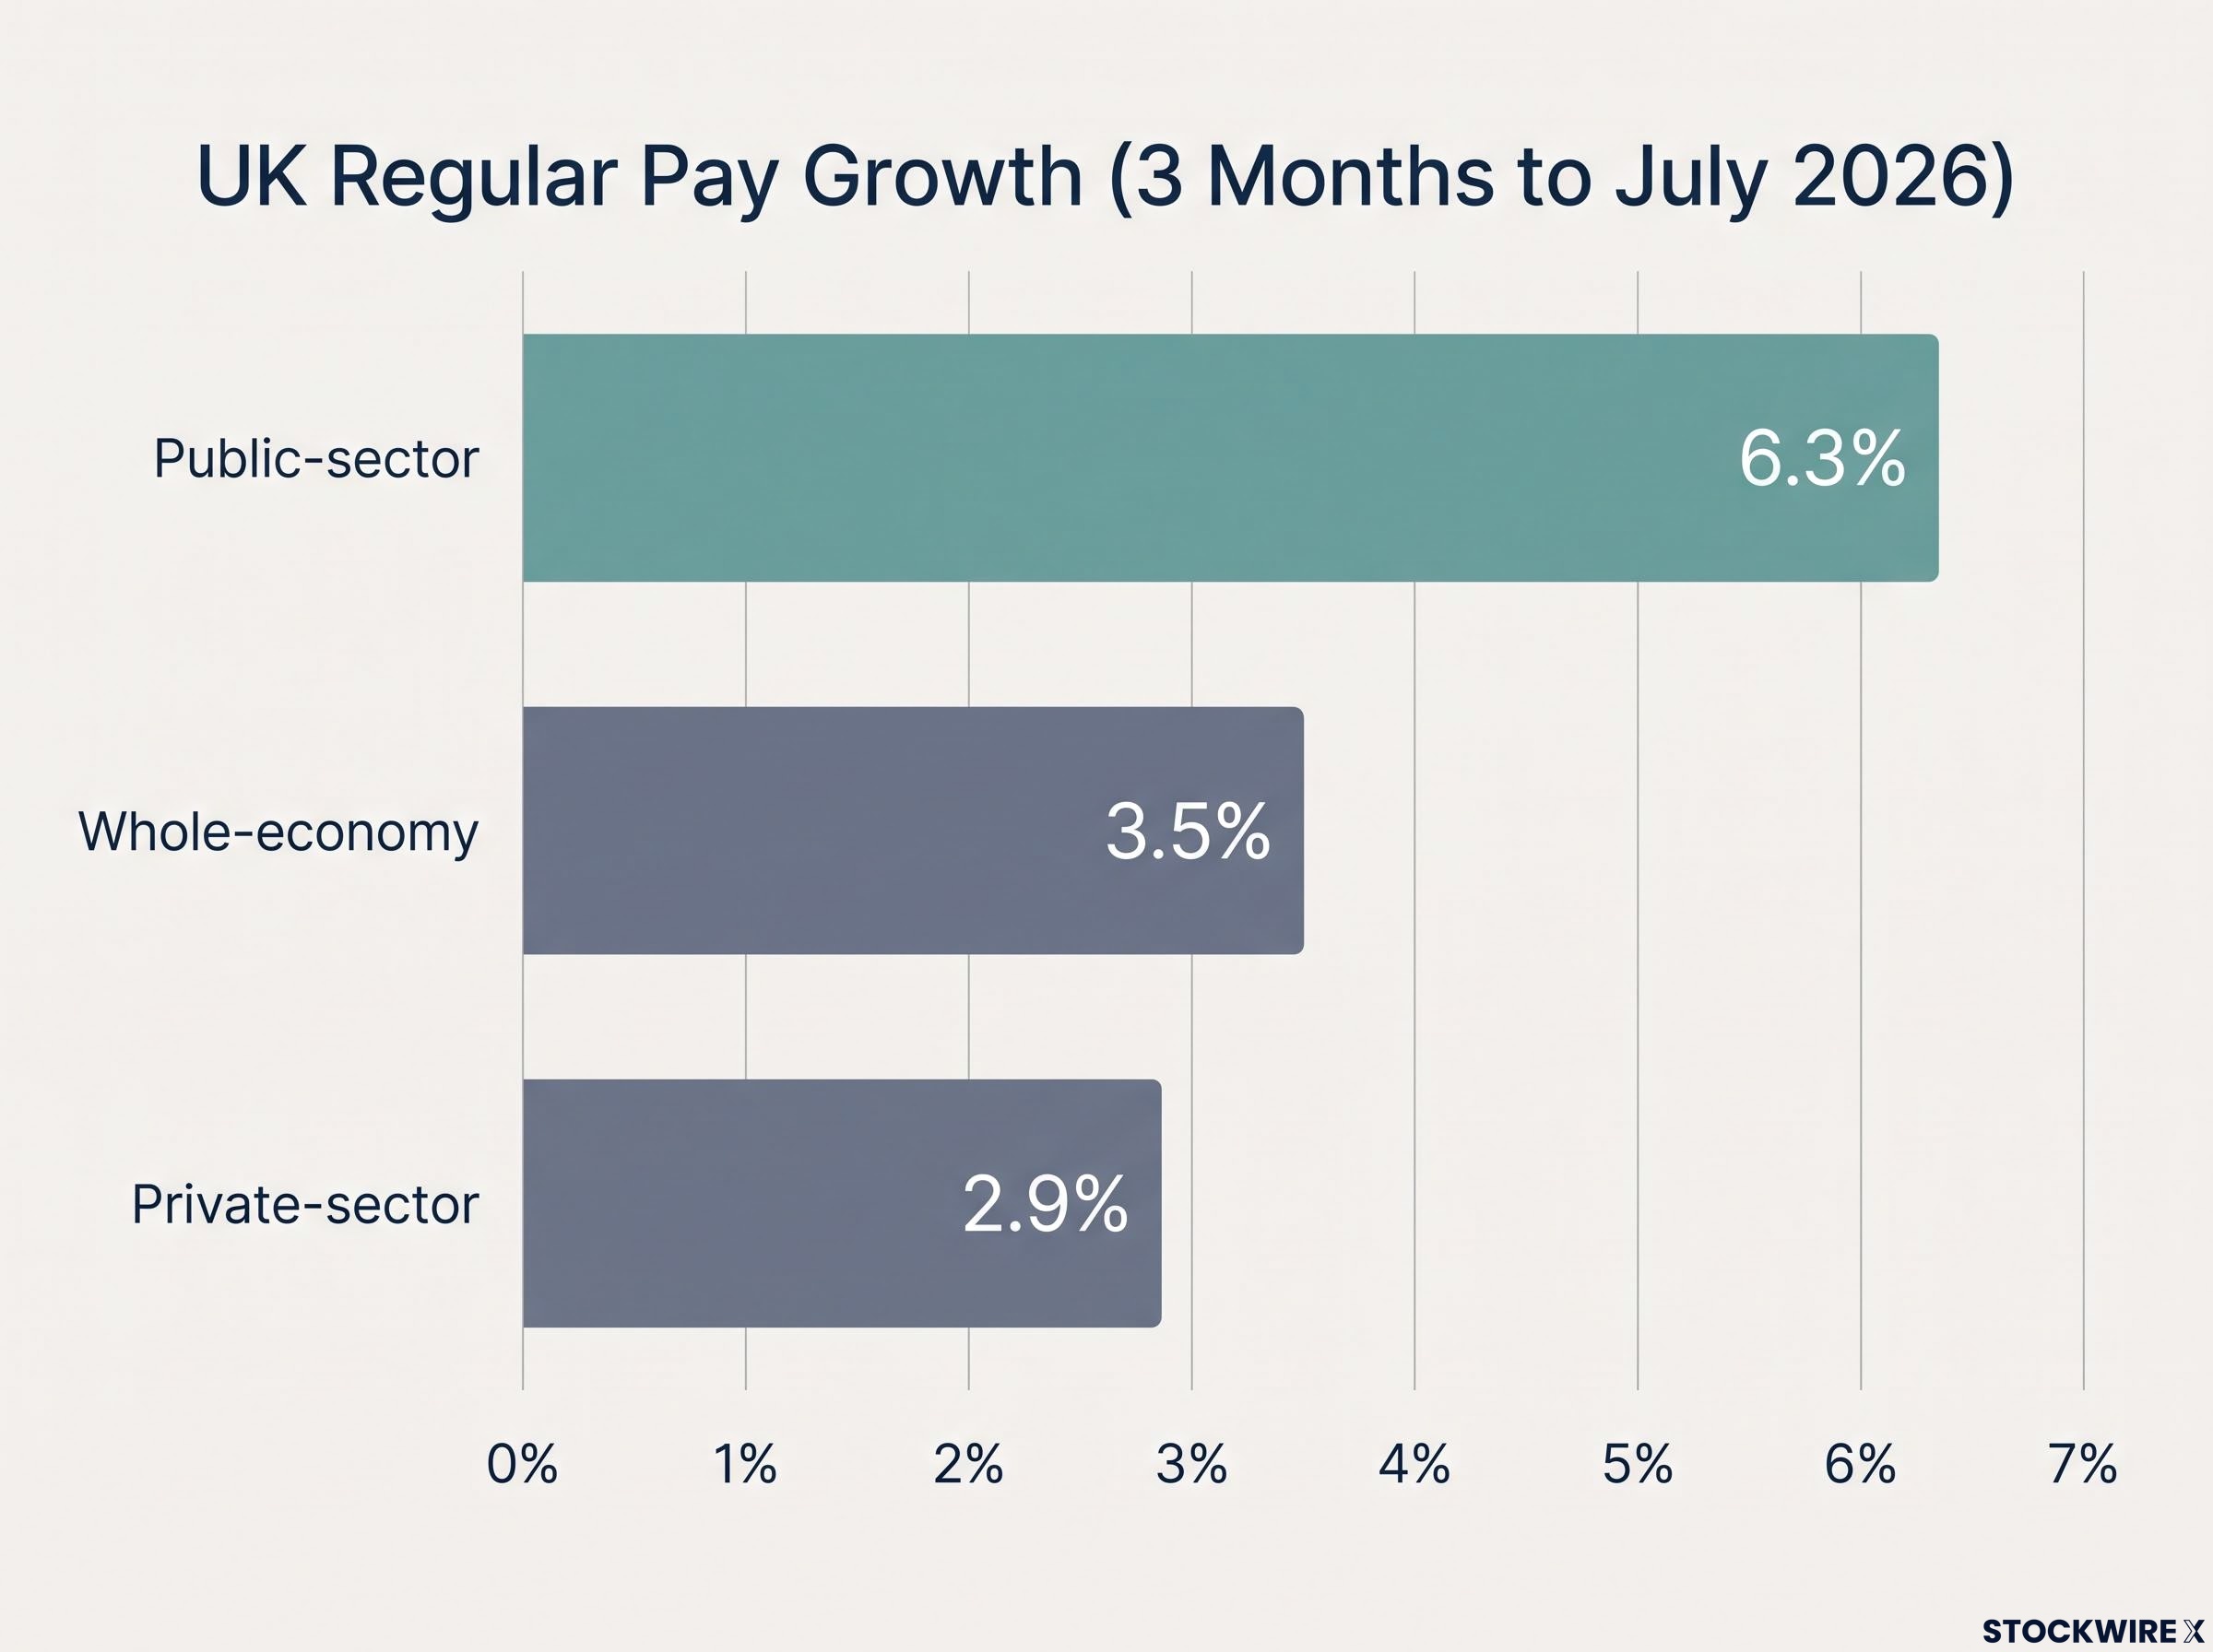
The wage figure the MPC watches most closely has moved in the right direction. Private-sector average weekly earnings (AWE) regular pay grew 2.9% in the three months to July 2026, and the committee cares about this measure more than any other because private wages, unlike public-sector settlements, respond directly to labour market conditions and firm-level cost pressure.
That cooling is the directional evidence the MPC wanted. The awkwardness sits underneath it.
Whole-economy regular pay grew 3.5% over the same period, a figure described as relatively stable across the past five consecutive three-month readings. And the reason the whole-economy number sits above the private-sector one is entirely public sector.
Consider the three readings side by side:
- Private-sector regular pay: 2.9%
- Whole-economy regular pay: 3.5%
- Public-sector regular pay: 6.3%
Public-sector pay running at more than double the private rate is an asymmetry the committee cannot ignore. Bank of England Agents reported average pay settlements of around 3.5% for 2026, consistent with gradual cooling but nothing like rapid disinflation.
The MPC has said out loud that this matters. In its February 2026 Monetary Policy Report, the committee flagged that how far domestic inflation pressures fall will “crucially” depend on how much slack develops in the labour market. Wages are the transmission belt between that slack and inflation.
MPC member Megan Greene made the caution explicit earlier in the year.
Wages appear to be growing strongly again and could prevent inflation from easing as much as expected, potentially limiting the scope for interest-rate cuts, Greene told The Guardian in January 2026.
For investors, this is the granularity that headline-watching misses. Private-sector pay at 2.9% is the signal the MPC wanted to see, but the persistence of public-sector pay and sticky services inflation means the committee cannot treat it as a clean all-clear for easing. The wage picture is bifurcated, and that split is actively informing the caution priced into the rate path.
How the MPC translates labour data into rate decisions
The committee is not reacting to job numbers on instinct. It follows a specific causal chain, and understanding that chain lets you read each data release the way the MPC does.
Set out in its own December 2025 and February 2026 summaries, the logic runs in four steps:
- A higher Bank Rate restrains demand across the economy.
- Weaker demand builds slack in the labour market, seen in falling vacancies, rising unemployment and softer hiring.
- That slack lowers wage growth and services inflation, the two indicators the committee treats as the truest signs of inflation persistence.
- As those indicators ease, the MPC gains confidence that disinflation is durable and can contemplate easing.
The December 2025 summary put it plainly, noting that restrictive policy and building labour market slack had allowed pay growth and services inflation to continue easing, pointing to further underlying disinflation toward target.
The July 2026 vote is where the theory meets disagreement. The committee split 6-3 to hold at 3.75%, with three members preferring a rise to 4.0%. That split tells you the internal debate is live, not settled.
Deputy Governor Sarah Breeden leans toward patience. She observed in July 2026 that a weak economy reduces the risk of sticky inflation spilling into wages and price-setting, a view that supports holding steady rather than tightening.
The 6-3 balance is the number investors should sit with. Three members saw a case for tightening even as the labour market weakened, which means any deterioration in services inflation or wages could tip the balance in an uncomfortable direction. The rate path is not on autopilot toward cuts.
The hawkish bloc inside the MPC grew from one dissenter in April 2026 to three by July, with Pill, Greene, and Mann all voting for a rise to 4.0%, and five-year swap rates crossing 4.52% as mortgage markets repriced ahead of any official decision.
What the September 2026 decision means for rate watchers
A Reuters poll conducted 4-8 September 2026 found all 65 economists surveyed expect a hold at 3.75% on 17 September 2026. Unanimity, though, does not mean rates are heading down. It means the MPC is in a watch-and-wait posture.
The same poll had the consensus holding rates through the end of 2026 and at least until mid-2027, giving you a timeline anchor. The International Monetary Fund’s 2024 Article IV assessment adds context: Bank Rate sits more than two percentage points above the estimated neutral rate, and the next phase is to ease, but the Fund warned against “premature easing.”
There is a tail risk on the other side. A Bloomberg Economics model has flagged the possibility of a quarter-point rise to 4.0% in February 2027. It is not consensus, but it reflects the genuine uncertainty embedded in the committee’s current stance.
The productivity debate and why it complicates the disinflation story
Here the story stops being tidy. Whether UK productivity is genuinely rising or merely appears to be depends entirely on how you measure employment, and the answer changes the case for cutting rates.
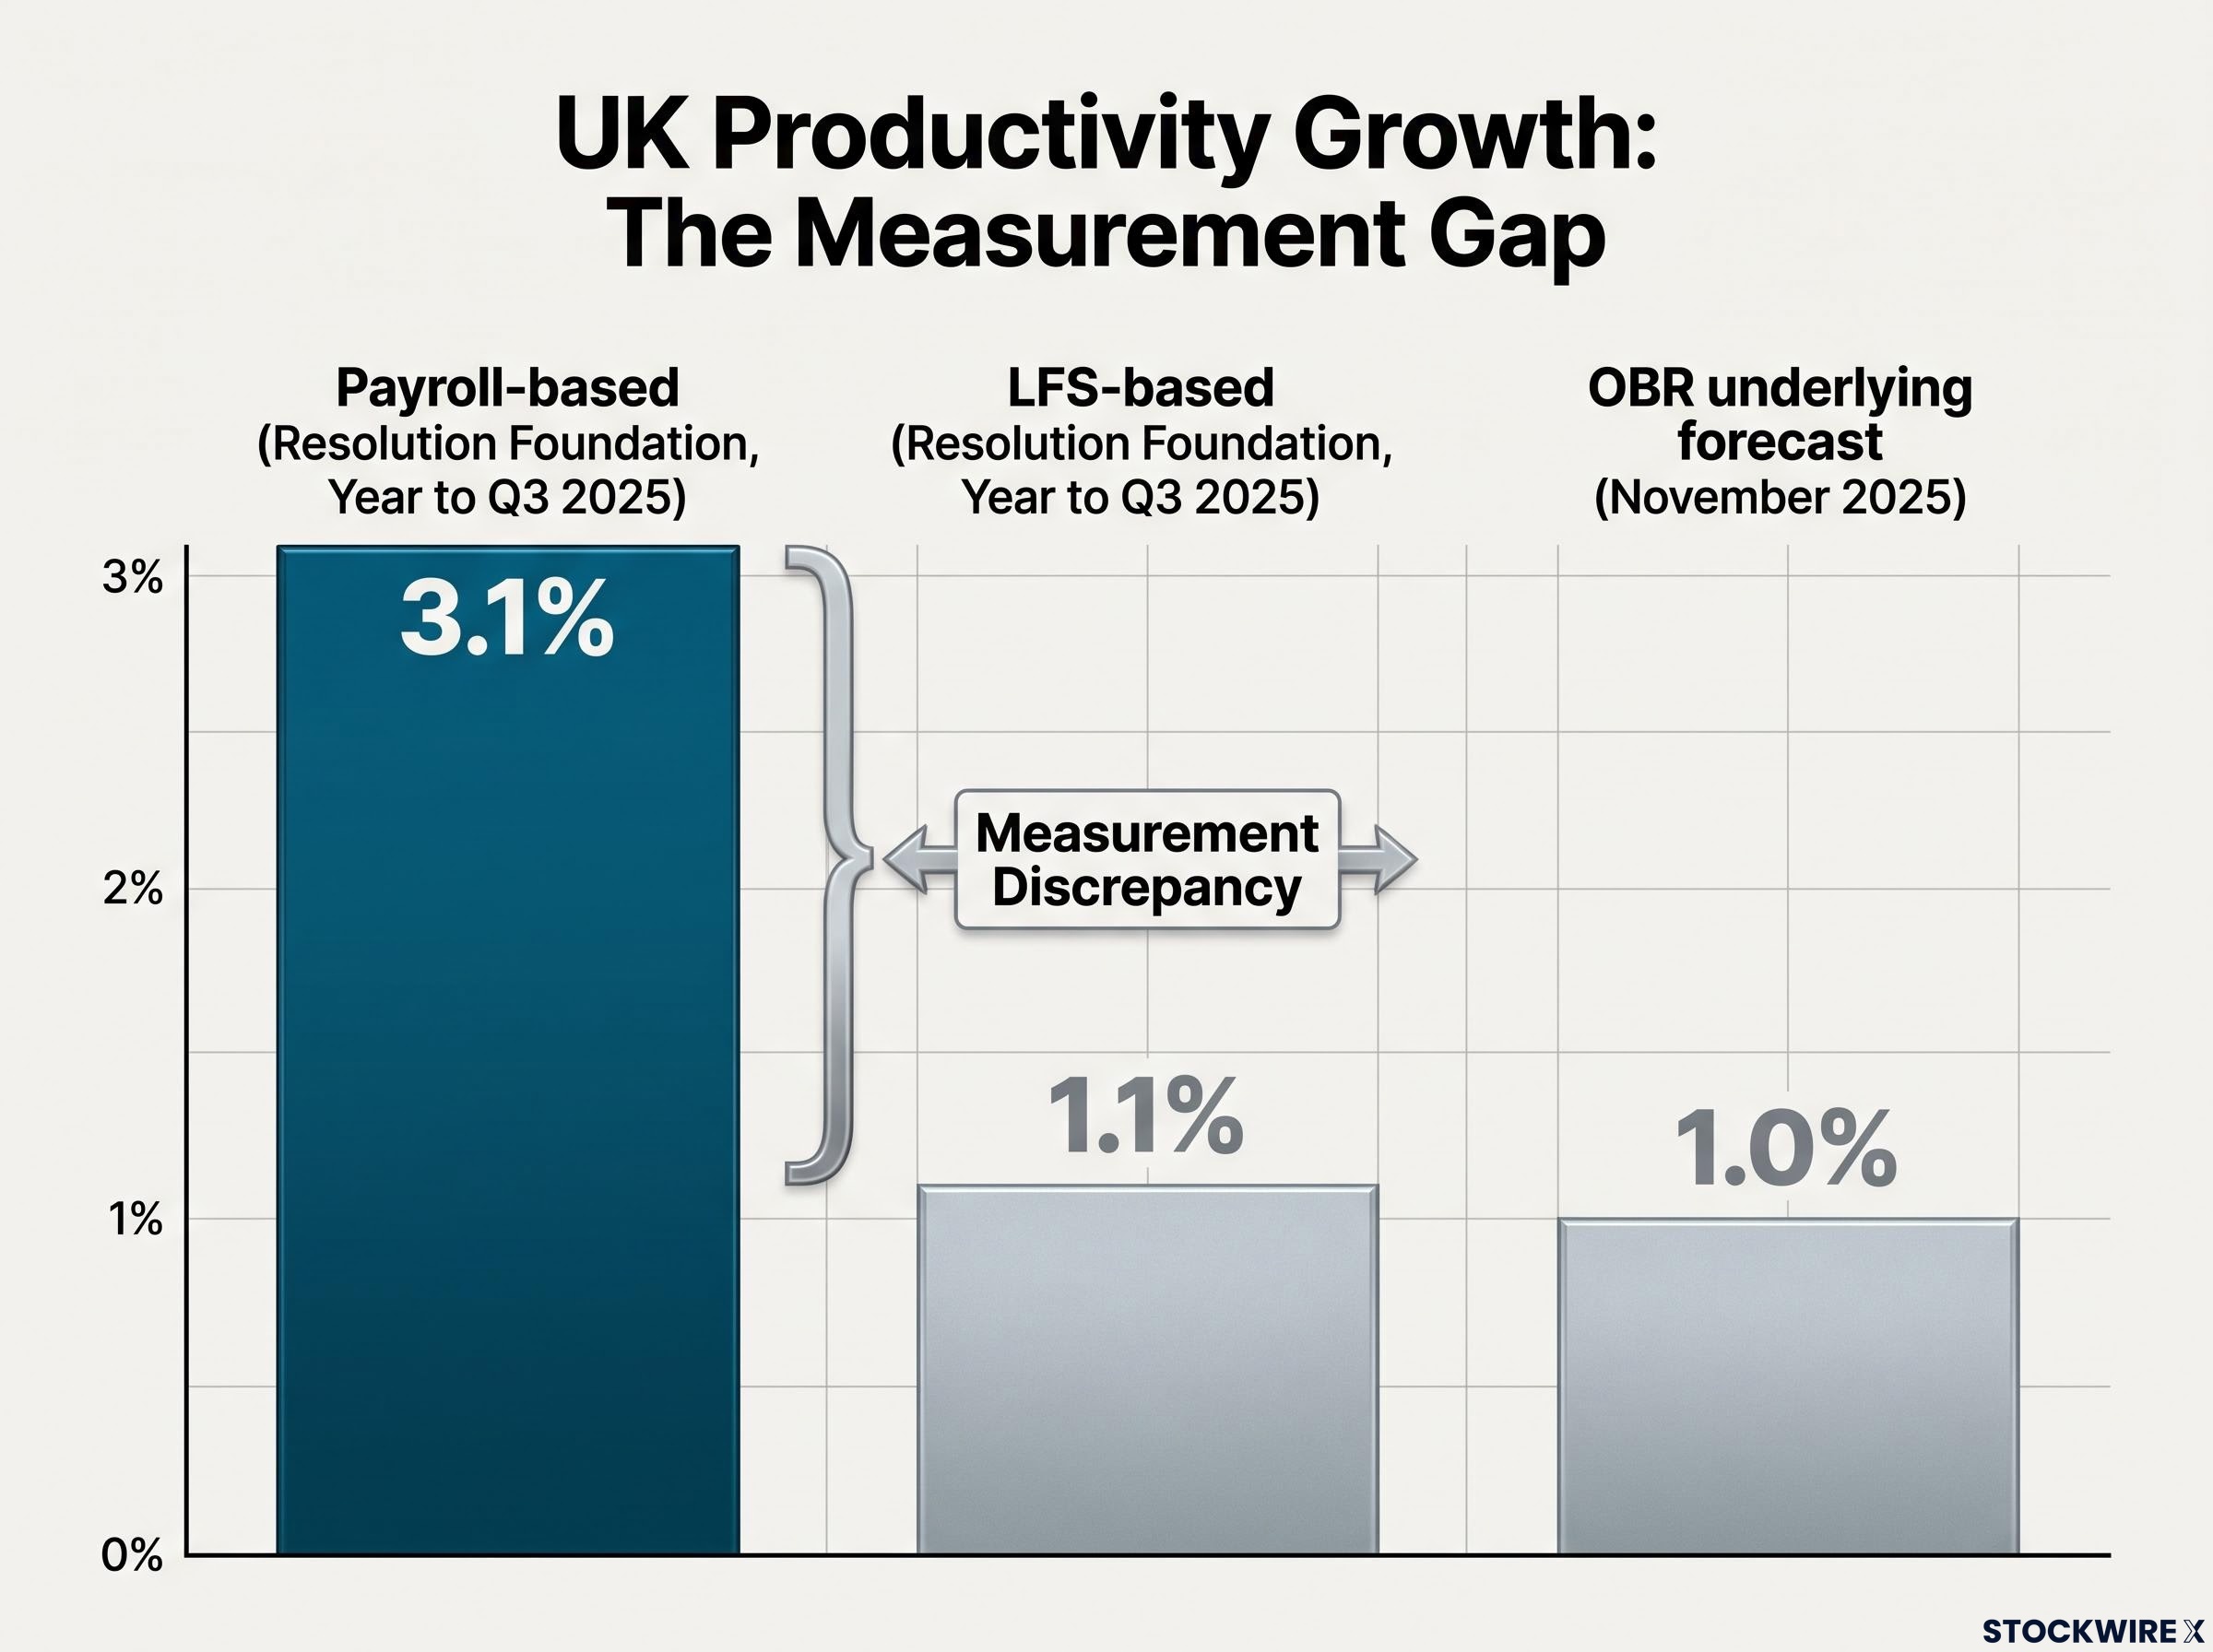
Analysis from the Resolution Foundation lays out the tension. Measure employment using the traditional Labour Force Survey and productivity grew just 1.1% in the year to Q3 2025. Measure it using payroll data, which shows a sharper fall in hours worked, and the same period implies 3.1% productivity growth.
When extra output is produced by fewer hours worked, measured productivity growth is mechanically higher, the Resolution Foundation notes, which means much of the gap between the payroll-based and Labour Force Survey readings reflects a measurement discrepancy rather than a structural productivity boom.
The gap is wide enough to change the entire read.
The Resolution Foundation productivity analysis that underpins this measurement debate found the gap between payroll-based and Labour Force Survey readings to be wide enough that the choice of employment measure changes the headline productivity growth figure by two full percentage points, a discrepancy with direct implications for whether the MPC’s disinflation confidence is well-founded.
| Measure | Estimate | Period | Source | Interpretation |
|---|---|---|---|---|
| Payroll-based productivity | 3.1% | Year to Q3 2025 | Resolution Foundation | Implies real efficiency gains |
| LFS-based productivity | 1.1% | Year to Q3 2025 | Resolution Foundation | Continued near-stagnation |
| OBR underlying forecast | 1.0% | November 2025 | OBR | Undershoot of expectations |
The measurement problem runs deeper still. A separate Resolution Foundation report, “Trend setters,” found that in the four quarters to Q2 2025, GDP rose 1.4% while total hours worked rose 1.9%, which on the official basis implies negative productivity growth of around -0.5%.
The official forecaster is cautious. The Office for Budget Responsibility (OBR) cut its central forecast for underlying productivity growth to just 1.0% in its November 2025 outlook, describing the UK’s performance as having undershot expectations. ONS national accounts commentary added that wage growth continues to outpace productivity growth, which points to weak underlying efficiency.
Raja takes the more constructive side, arguing that GDP outpacing headcount implies rising productivity that supports the disinflation case, while still cautioning there is “no evidence yet that the UK labour market is out of the woods.”
Why this matters for rates comes down to one question. If the productivity gain is real, the economy can grow without generating inflationary wage pressure, which strengthens the case for easing. If it is mainly a measurement artefact of falling payrolls, the disinflation case is weaker and the MPC’s caution is better justified. So if the improvement is largely statistical noise rather than genuine efficiency, you should treat Deutsche Bank’s constructive view of the disinflation path with more caution than a clean 3.1% headline would suggest.
What a rate hold actually signals in a weakening labour market
Holding rates while the labour market softens is not inaction. It is an active choice, and the committee is walking a tightrope.
Cut too quickly and the MPC risks reigniting inflation if services prices and wages prove sticky. Hold too long and it risks compounding a labour market already shedding payrolls, pushing unemployment higher than the disinflation task requires.
The committee has been specific about what it needs to see before it moves. Drawing on its own published language, two conditions dominate:
- Clearer evidence that services inflation persistence is genuinely receding, not just easing on favourable base effects.
- Continued moderation in private-sector wage growth, sustained rather than a single soft print.
Services inflation is the sticking point. It stood at 4.7% in June 2025 per the August 2025 Monetary Policy Report, and the February 2026 report projected measures of underlying services inflation still around 3.5-4%, falling only gradually. That is well above a level consistent with the 2% target.
Services inflation stood at 3.4% in July 2026, well above a level consistent with the 2% target, and the divergence between a falling core CPI and a sticky services component is precisely the split that prevents the MPC from treating private-sector wage cooling as a clean disinflation signal.
Raja’s February 2026 note argued that slack is likely to increase further, supporting the case for cuts while acknowledging that inflation risks remain. The Reuters consensus of no cuts until mid-2027 does not reflect a belief that the economy is fine. It reflects a judgment that the bar for confidence in durable disinflation is high, and current labour softness, while necessary, is not by itself enough to trigger easing.
The practical read for investors is narrow but clear: UK rate cuts are data-dependent in a specific sense. The MPC needs consecutive months of improvement in private-sector wages and services inflation, not one weak payroll number.
Two conditions that matter more than any single data release
The first is private-sector AWE regular pay sustaining a downward trend below 3% across several consecutive periods, not the isolated 2.9% reading already on the board.
The second is services inflation showing durable monthly improvement rather than annual easing driven by base effects.
Both require exactly the kind of confirmation the committee has said it is waiting for, which makes the mid-2027 consensus horizon plausible rather than pessimistic.
Reading the UK rate path from here
The core finding is uncomfortable in its symmetry. Labour market weakness is real and it is doing precisely the work restrictive policy was meant to do, yet the disinflation it should produce has not fully arrived, because wages and services inflation remain above target-consistent levels.
That is why the 17 September 2026 decision is a non-event on its own. Every one of the 65 economists polled expects a hold. The signal that will actually move markets is the voting split. A shift from 6-3 toward 7-2 or 5-4 would change the rate path narrative overnight.
Three indicators deserve your attention in the months ahead:
- The private-sector AWE trend, watching for a sustained move below 3% rather than the current 2.9% reading in isolation.
- Services inflation month by month, distinguishing genuine improvement from base-effect easing.
- The MPC voting split at each meeting, the clearest live gauge of where the committee’s balance is tipping.
The question from here is not whether cuts will come, but how quickly the evidence the MPC requires accumulates. A Bloomberg survey from April 2026 pointed to two quarter-point cuts from early 2027, while a Bloomberg Economics model flags a tail risk of a rise to 4.0% the same year. Track the right two or three signals and you will read that timing earlier than anyone watching headline employment alone.
For investors tracking how growth surprises are feeding into asset pricing, our deep-dive into the July UK data and sterling response examines why a broad-based GDP beat left sterling almost unmoved, revealing that inflation developments dominate UK asset pricing in the current regime.
This article is for informational purposes only and should not be considered financial advice. Investors should conduct their own research and consult with financial professionals before making investment decisions. Past performance does not guarantee future results, and financial projections are subject to market conditions and various risk factors.