Headline inflation of 3.1% and Brent crude near US$110 look like an open-and-shut case for higher rates. Yet the Bank of Canada‘s preferred core measures sit below 2%, and Standard Chartered still expects the policy rate to hold at 2.25% through 2027. That gap is the real story behind the next Bank of Canada rate decision.
The Bank announces its call in eight days, on 28 October 2026, alongside a fresh Monetary Policy Report. The open question is whether markets and policymakers are reading this oil shock the same way Standard Chartered economist Dan Pan reads it: as a temporary fuel spike in an economy with too little demand to sustain inflation.
One caveat belongs up front. The widely circulated claim that markets price roughly 100 basis points of hikes comes from Standard Chartered’s view, as relayed by FXStreet. More recent public reporting shows far thinner near-term pricing. One basis point is one-hundredth of a percentage point, so 100 bps equals a full percentage point.
Here is a practical test for judging whether central bank pricing matches the economy underneath it. You can apply it on 28 October and at every meeting after.
Is a 3.1% inflation print telling the whole story?
The September consumer price index (CPI) number is the one that grabbed attention. Prices rose 3.1% year on year, according to Statistics Canada data reported by Reuters on 19 October, pushing above the Bank’s target range.
Then look one layer down. CPI-median, which tracks the price change sitting in the middle of all items, was 1.9%. CPI-trim, which strips out the most extreme price moves in either direction, was 1.8%. These are the gauges the Bank watches most closely, and both sit under target.
The 1.3 point gap between headline and core was flagged ahead of the release in a September CPI preview, which argued that an energy-led overshoot alongside falling employment limits the Bank’s appetite to respond.
The core gap Headline inflation: 3.1%. Core inflation: 1.8-1.9%. Gasoline and diesel account for the overshoot.
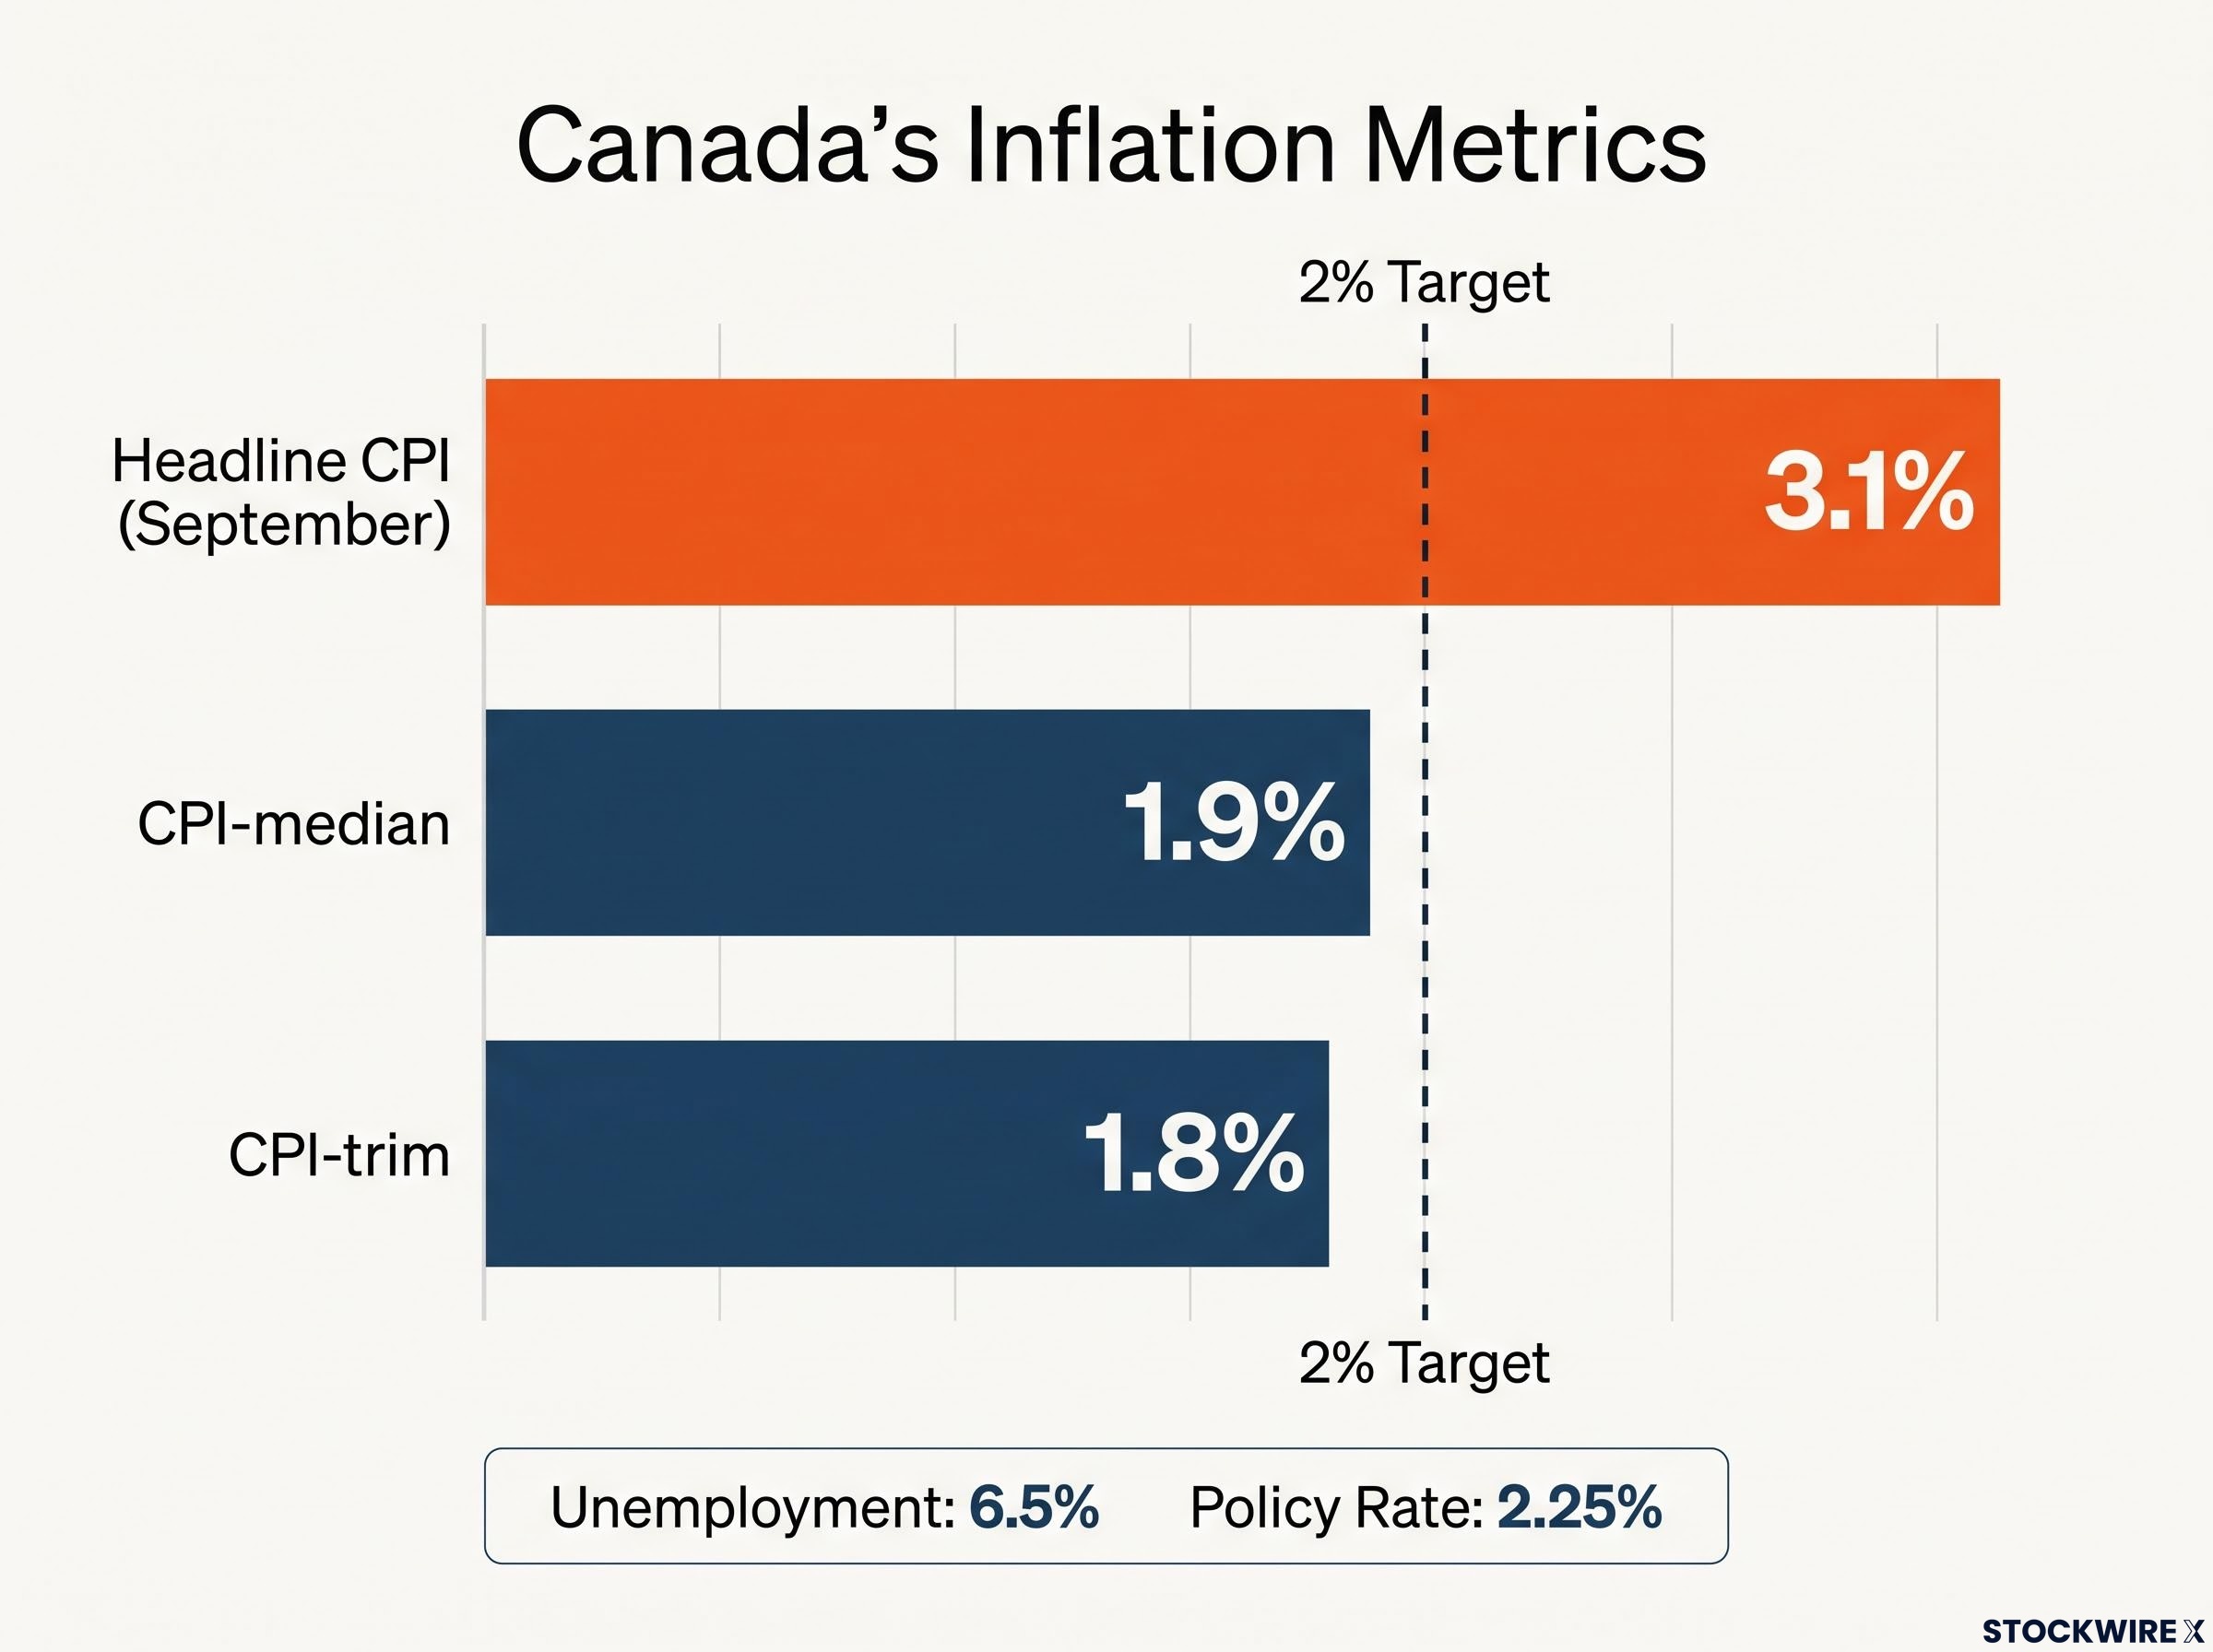
The rest of the economy points the same way. Unemployment rose 0.1 point to 6.5% in September, employment fell in both August and September, and RBC Economics says the jobless rate has plateaued. Real GDP grew 0.8% quarter on quarter in Q2, an authoritative completed reading, while August’s 0.2% monthly figure is only an advance estimate and may be revised.
| Indicator | Latest reading | Date/Source | What it signals |
|---|---|---|---|
| Headline CPI | 3.1% y/y | September; Statistics Canada via Reuters | Energy-driven overshoot |
| CPI-median | 1.9% y/y | September; Statistics Canada via Reuters | Underlying inflation contained |
| CPI-trim | 1.8% y/y | September; Statistics Canada via Reuters | No broad price pressure |
| Unemployment | 6.5% | September; Statistics Canada | Soft labour market |
| Real GDP | +0.8% q/q | Q2 2026; Statistics Canada | Modest growth |
| Policy rate | 2.25% | 2 September; Bank of Canada | Seventh straight hold |
Pan sees little risk of inflation spreading broadly, with trade uncertainty still weighing on growth. What this tells you is that the overshoot is coming from the fuel pump, not from household spending. That distinction is exactly what the Bank’s decision turns on.
When big ASX news breaks, our subscribers know first
Markets, economists and Macklem: where does the 100 bps claim sit?
If core inflation is soft, how much tightening are markets actually expecting? The answer depends heavily on when you checked.
What the pricing trail shows
In mid-September, a Scotiabank policy monitor summarised by National Bank showed October pricing of about 10 bps, roughly a 40% chance of a quarter-point hike. By 13 October, after weak jobs data, TD economist Andrew Hencic put October hike odds at 27% and December odds at 88%.
On 17 October, Reuters reported that markets were not pricing an October or December change at all.
No public report located verifies roughly 100 bps of cumulative tightening. The figure is best read as Standard Chartered’s characterisation of the full cycle, which Pan considers excessive even if the Bank delivers an October insurance hike.
Where economists land
The forecaster field is split. TD expects a hold through 2028, RBC sees gradual hikes from 2027, CIBC forecasts 2.50% in Q1 2027, and National Bank sits close to the hold camp. Standard Chartered has moved from a 2026 cut and 2027 hike to a hold throughout.
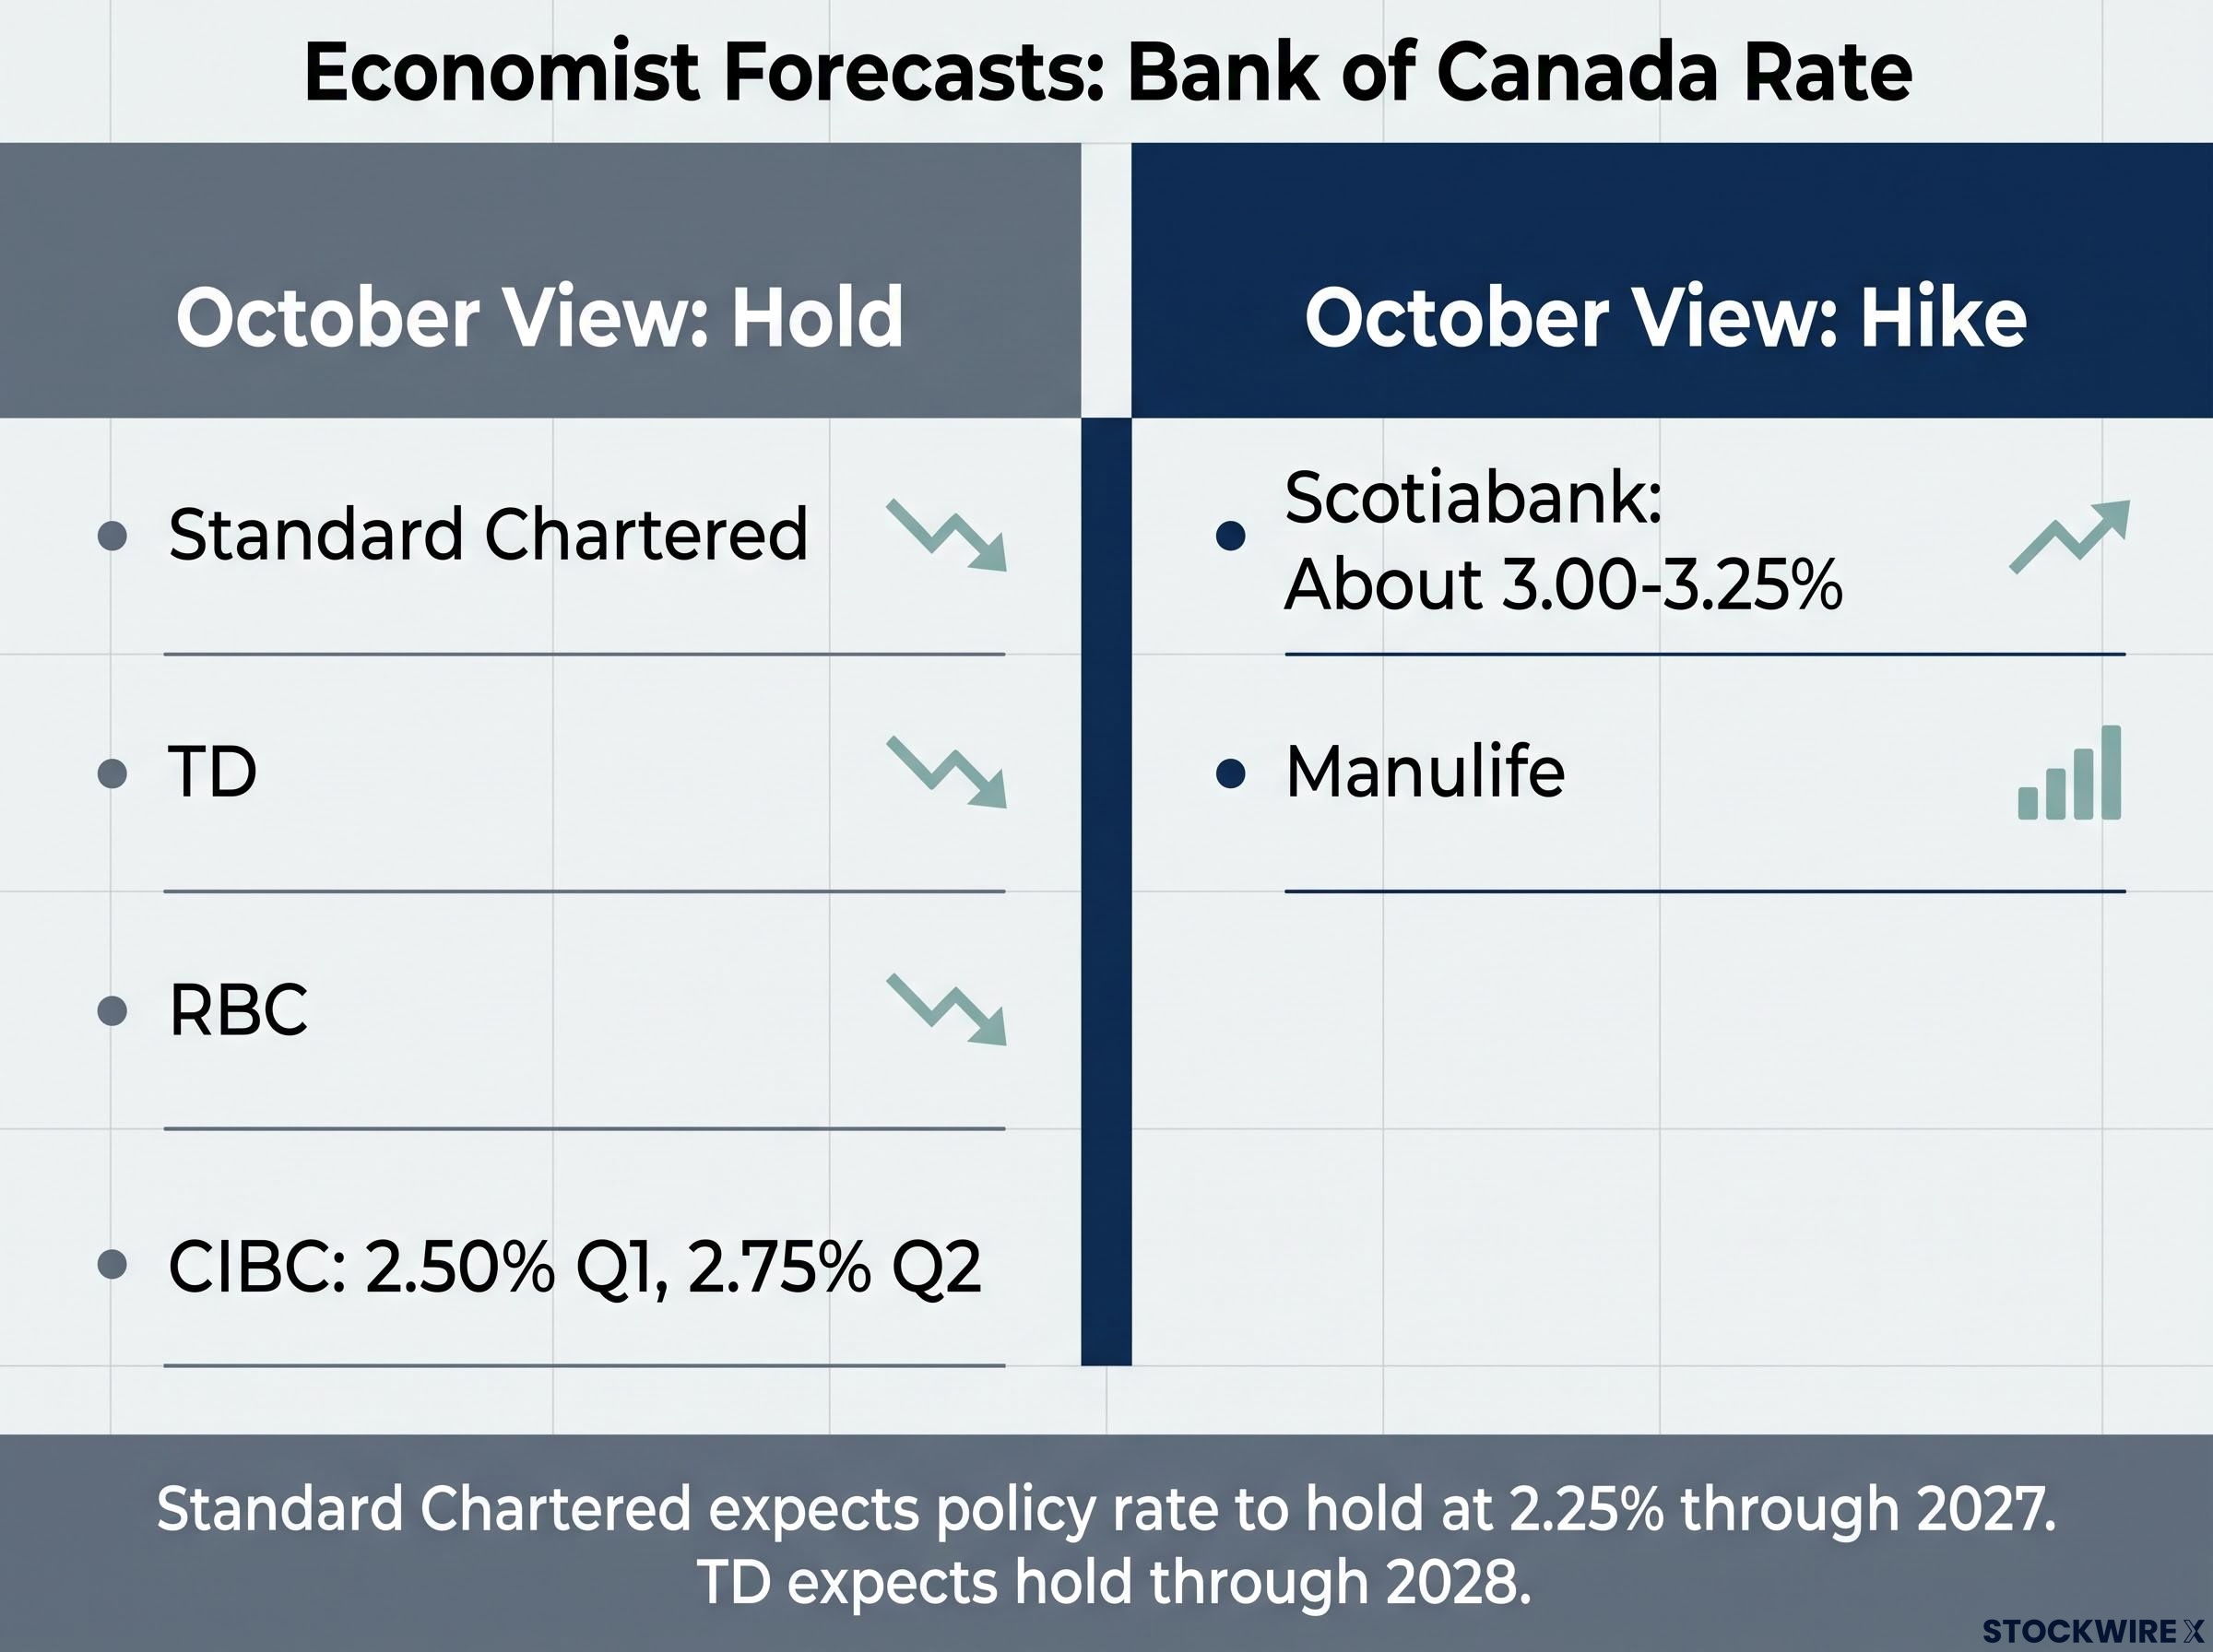
| Forecaster | October view | 2027 view | Core reasoning |
|---|---|---|---|
| Standard Chartered | Hold; insurance hike possible | Hold at 2.25% | Weak demand, contained core |
| TD | Hold | Hold through 2028 | Case for hiking not compelling |
| RBC | Hold | Gradual hikes | Weak growth and jobs |
| CIBC | Hold | 2.50% Q1, 2.75% Q2 | Trade uncertainty |
| Scotiabank | Hike | About 3.00-3.25% | Energy costs entering core |
| Manulife | Hike, then December | Further tightening risk | Back-to-back increases |
Late shifts toward an October hike have also been reported at BMO and Desjardins. The catalyst is Governor Tiff Macklem, who said on 2 September that policymakers were prepared to raise rates, including multiple times, if inflation stayed too high. His language sharpened further on 17 October:
Tiff Macklem, Governor, Bank of Canada (17 October) The key question is whether inflation comes back to target by itself, or whether rates must rise to steer it there.
Because even economists disagree, you should treat any single pricing figure as one reading of an uncertain oil-and-inflation regime, not a forecast to anchor on.
What does it mean to look through an oil shock, and what is an insurance hike?
That split makes more sense once you understand the logic the Bank is weighing.
Why central banks look through supply shocks
A supply shock is a jump in prices caused by disrupted production or delivery rather than stronger demand. The first-round effect is the direct hit: dearer petrol, diesel, transport and heating. Second-round effects happen when those costs spill into wages, rents and services, and that is what makes inflation stick.
Whether a fuel spike turns into persistent inflation depends heavily on money supply growth and credit conditions, since oil moves alone are relative price shocks that fade without broad monetary expansion behind them.
Today’s shock is real. Brent settled near US$109.86 and WTI near US$101.41 on 16 October, driven by attacks around the Strait of Hormuz, damaged regional refineries and strikes on Russian refining capacity.
Canada also gains something. As a major energy exporter, its terms of trade (export prices relative to import prices) rose 3.3% in Q2, lifting national income and offsetting part of the fuel pain.
- What the shock does directly: higher gasoline and diesel prices; costlier transport; dearer heating; a headline CPI spike
- What would make it persistent: wage demands catching up; rents and services repricing; rising inflation expectations; broad price-setting shifts
Scotiabank noted in June that households and firms still used the 2% target as their reference point. The April 2026 Monetary Policy Report found near-term expectations had risen but longer-term ones stayed anchored. The Bank’s own researchers flag the limit:
Bank of Canada Staff Working Paper 2026-39 (16 October) Ignoring a large and persistent supply shock risks raising and extending inflation, and could unanchor expectations.
How an insurance hike works
An insurance hike is a pre-emptive, precautionary rate increase made before broad inflation is clearly entrenched. It insures against expectations drifting, a temporary shock becoming permanent, and the need for a larger, more painful tightening cycle later.
Pan says an October move would reflect caution, not necessity. No other labelled 2026 insurance-hike precedent was found. This tells you that an October hike would be a statement about oil, tariffs and credibility, not about economic strength, so weak jobs data would not rule it out.
Three scenarios for 28 October and early 2027
With the mechanics in place, the decision reduces to three distinct readings of the same data.
| Scenario | What it looks like | Likely BoC response |
|---|---|---|
| Temporary headline shock | Core at 1.8-1.9%, unemployment 6.5%, terms-of-trade gain, mortgage-renewal strain | Hold at 2.25% |
| Persistent supply shock | Oil near US$110, tariffs and counter-tariffs, CAD weakness, credibility risk | Insurance hike with limited follow-through |
| Demand-driven inflation cycle | Core and wages accelerating; not visible in current data | Sustained hiking path |
The signal worth tracking is not October odds alone. It is whether pricing for later meetings stays elevated despite weak jobs and sub-2% core. An October hike with little follow-through is an insurance view; a full percentage point of tightening implies something far more persistent.
Standard Chartered’s central case holds at 2.25% through 2027, with one or two early-2027 hikes only if core inflation accelerates. Pan sees no strong growth driver, since high commodity prices and AI-driven investment may take time to lift activity. RBC and CIBC’s gradual 2027 hiking paths mark the alternative route.
You should watch these rather than oil alone:
- Wage growth, for signs workers are pricing in higher costs
- Services and rent inflation, the classic channels for persistence
- Inflation expectations surveys, especially longer-term readings
- Pricing for meetings beyond December
These forecasts are speculative and subject to change with market developments. Past performance does not guarantee future results.
What the oil shock changes for the Bank, and what it does not
The most likely outcome on 28 October remains a hold at 2.25%, but the meeting is live. Oil near US$110 and Macklem’s sharper warnings have raised the odds of a precautionary move.
What the shock has not changed is the state of demand. Core inflation sits below 2%, unemployment is 6.5%, and jobs are falling. The real disagreement among forecasters is about second-round effects, not about whether the economy is currently soft.
After the decision, keep four variables in view: core CPI, wages and services inflation, oil prices, and Macklem’s language in the Monetary Policy Report. And treat the 100 bps figure as Standard Chartered’s characterisation, not verified market pricing.
Investors exploring how the decision reaches the currency will find our full explainer on loonie drivers, which shows how Canada-US rate differentials outweigh domestic headlines.
This article is for informational purposes only and should not be considered financial advice. Investors should conduct their own research and consult with financial professionals before making investment decisions.