
You have probably seen it: price spikes through a level, snaps back, and someone in a forum calls it a stop hunt. The candle looks like proof. A chart, though, only shows where price traded, never whose orders were triggered or why.
Obvious highs and lows draw attention because many traders plan around them at once. When a break through one of those levels fails, the reversal can be fast and violent. Treat every new high as a breakout, or every long wick as a stop hunt, and you will collect losses you could have avoided.
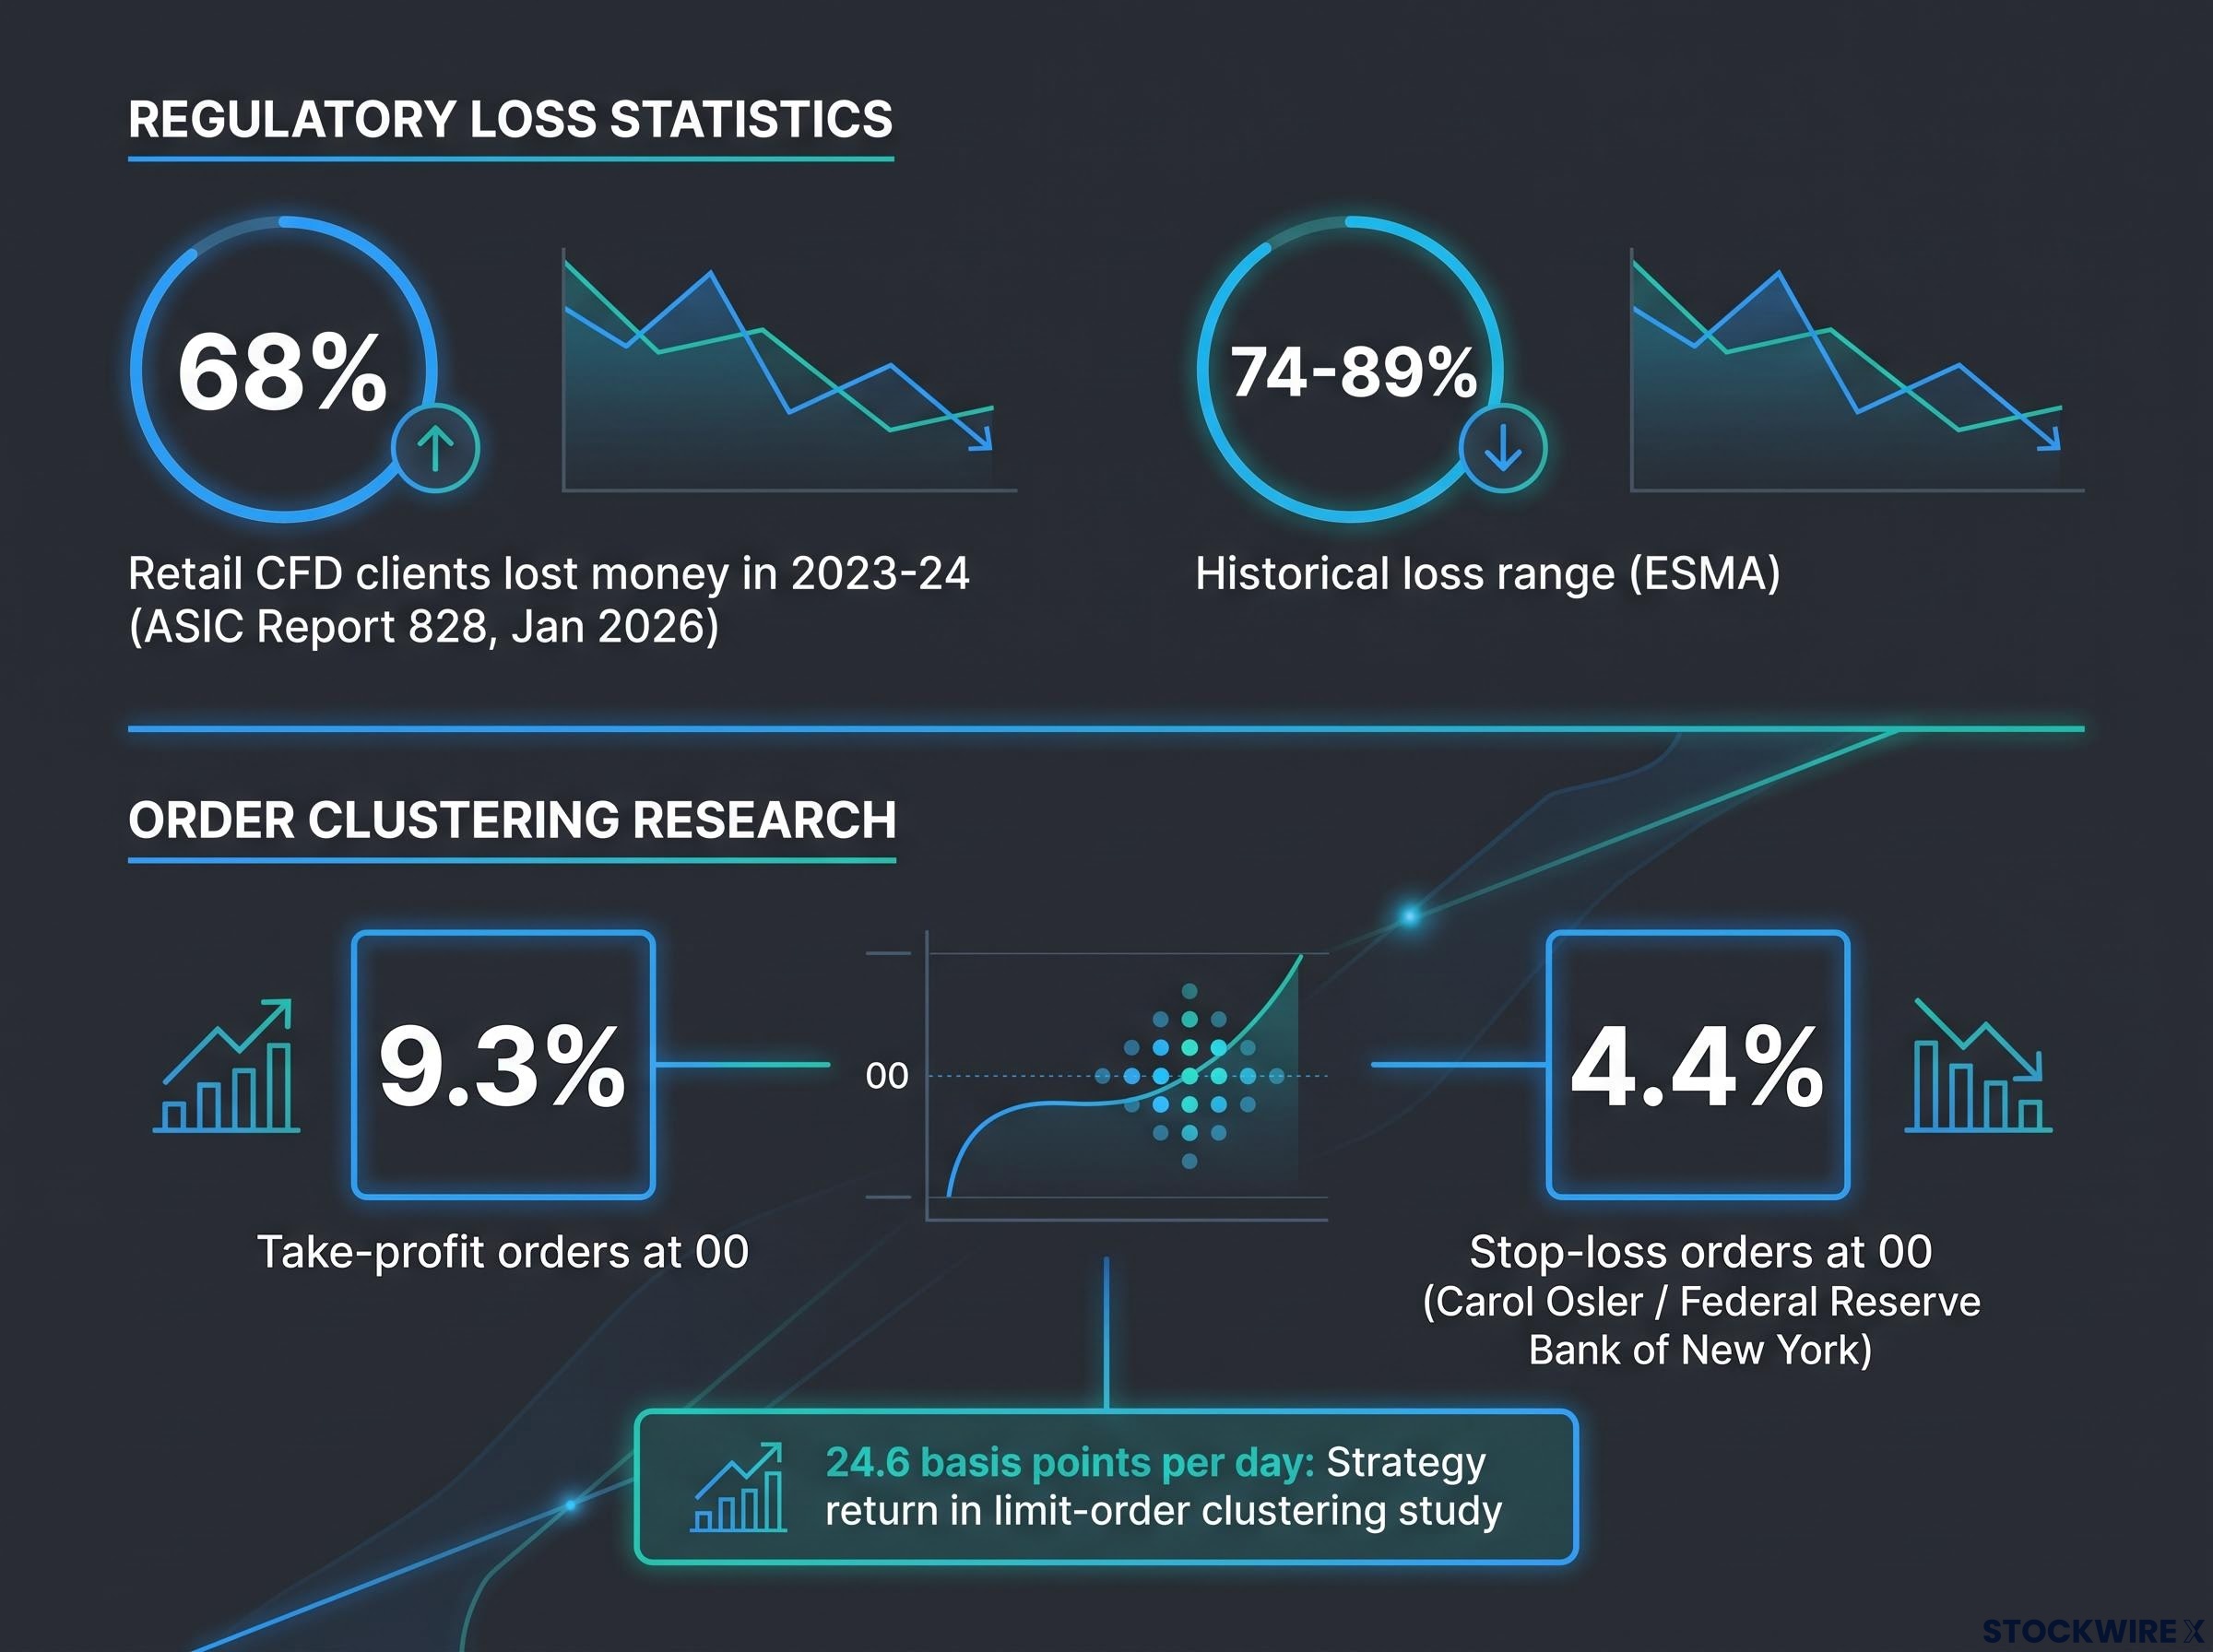
The stakes are real. According to ASIC’s Report 828, published in January 2026, 68% of retail CFD clients lost money in 2023-24. Pattern spotting alone has not protected most traders.
This guide gives you a different footing for failed breakout trading. You get a repeatable four-step evaluation (location, break, reclaim, follow-through) and a 20-example study exercise. Together they replace guesswork with evidence you can actually observe.
Why do obvious highs and lows attract orders?
Pull up a chart where price has been rejected at the same resistance level three times. That level is now visible to everyone watching, and different groups of traders are making plans around it:
- Breakout traders intend to buy once price pushes above it.
- Short holders may have protective buy stops just above it to limit their losses.
- Long holders below nearby support may have sell stops sitting under it.
A push through resistance can set off buying from the first two groups at the same moment. A triggered stop becomes a market order, which is an instruction to trade immediately at the best available price. A cluster of them can briefly accelerate the move in the direction of the break.
This is where the word “liquidity” matters. Liquidity means your ability to trade size without moving price much. It describes available orders, not a deliberate plan to target anyone.
There is some evidence that orders do cluster. Research by Carol Osler at the Federal Reserve Bank of New York found currency stop-loss buy orders gathering just above round numbers and stop-loss sells just below; 9.3% of take-profit orders executed exactly at numbers ending in 00, against 4.4% of stop-loss orders. A separate study on limit-order clustering around round numbers reported a long-short strategy earning 24.6 basis points per day in its tested sample, a study-specific result rather than a general breakout success rate.
Common clustering spots include equal highs and lows, prior-day extremes, session highs and lows, and round numbers. You can treat a visible level as a place where conditional orders plausibly gather, but that is a hypothesis you test, not a fact the chart confirms.
What a chart can and cannot show
You can see a sweep beyond a level, a rejection, and a reclaim back inside. The identity of the participants, the specific orders that fired, and anyone’s motives all stay hidden from you. Even on CME futures, native stop orders are not displayed in the visible order book before they trigger.
Because a candle only records four data points, you cannot tell which participants were behind a wick. Order flow trading tries to close part of that gap by showing how orders were absorbed or swept at a level.
Keep this in mind Charts show where price traded, not whose stops were hit.
When big ASX news breaks, our subscribers know first
Why do failed breakouts reverse so sharply?
Go back to that resistance level. Price pushes through, breakout buyers pile in, and stops above the level fire. For a moment, the move looks genuine.
Then buying fades. Price slips back inside the range, and everyone who bought the break now holds a losing position. Their exits, plus any stops placed below their entries, become fresh selling pressure, and that pressure feeds on itself.
That is where the reversal energy comes from. It is the same crowd that drove the break, now heading for the door together.
Still, moving beyond a level and coming back a little does not prove failure. The evidence sits in three observable questions: has price won the level back, is it holding within the range, and does the former resistance or support survive when price returns to test it?
The rule to remember Location plus break is only an alert; reclaim plus follow-through is the evidence.
You also need to know when this logic breaks down. These setups fail in recognisable ways:
- Repeated sweeps: price pierces the level several times before the real move.
- Trending markets: a countertrend reversal may be just a shallow pullback.
- News-driven moves: fundamentals can overwhelm technical behaviour entirely.
- Low liquidity: thin markets produce large wicks and poor fills without real reversal.
- Pattern hindsight: the setup looks obvious only after the fact.
- No follow-through: a reclaim that goes nowhere signals uncertainty, not confirmation.
You may also see claims that 30-40% of breakouts succeed or 50-70% fail. Those figures come from commercial trading websites, not peer-reviewed research. No authoritative universal rate exists, because definitions, markets and costs all change the answer, so treat any fixed number with suspicion.
How do Wyckoff springs, upthrusts and head and shoulders fit the same logic?
If you have read about Wyckoff analysis, a method that uses price, volume and trading ranges to interpret supply and demand, you have met a lot of vocabulary. Most of it describes one idea: a failed move beyond a range edge. Definitions below draw on StockCharts ChartSchool and Wyckoff Analytics, and they are interpretations, not validated laws of price behaviour.
| Term | What it looks like | Wyckoff reading | Key caveat |
|---|---|---|---|
| Spring | A dip below range support that quickly returns inside | Tests available supply; may precede a rise | Not every dip below support is a spring |
| Upthrust | A push above resistance that closes back inside | Tests remaining demand; may precede a decline | Not every upper wick is an upthrust |
| UTAD (upthrust after distribution) | A late-range break above resistance that fails | Distributional counterpart to a spring | Often clear only in hindsight |
| Break of the ice | A drop through important support in a distribution range | Signals weakness; failed regains can set up continuation | Context and later behaviour matter |
Head and shoulders as a failed breakout sequence
Stretch that same idea across a larger structure and you get a head and shoulders. Here is the sequence:
- Left shoulder: a high forms, then price pulls back.
- Head: price rallies above the left shoulder high, behaving like an upthrust.
- Right shoulder: a weaker rally makes a lower high.
- Neckline break: price falls through the line joining the reaction lows, the confirming weakness.
- Attempted reclaim or failed retest: price tries to regain the neckline.
- Continuation: if the retest fails, the decline resumes.
If the neckline break is reclaimed immediately and followed by a new high, that is itself a failed bearish breakout. Remember too that you cannot know a head is a head while it is still forming.
The research pulls in two directions. Savin, Weller and Zvingelis (2006) found risk-adjusted excess returns of roughly 5-7% per year over three months after identified patterns, while a Cambridge automation study found head and shoulders rules generally unprofitable before and after slippage, with filters improving results in about 69% of test cases. Samples, definitions and implementation differ, so the honest reading for you is that these patterns are conditionally useful at best, and confirmation matters more than recognising the shape.
Large-sample head and shoulders statistics show that only about half of tops reach their measured target, which supports treating the neckline retest as evidence rather than an optional extra.
What is the four-step framework for evaluating a failed breakout?
With the logic in place, you can turn it into a checklist. Each step is a test, and failing any one disqualifies the setup.
| Stage | Bullish failed downside break | Bearish failed upside break |
|---|---|---|
| Location | Established support, prior low, equal lows or range floor | Established resistance, prior high, equal highs or range ceiling |
| Break | Price trades below support, likely triggering sell stops | Price trades above resistance, likely triggering buy stops |
| Reclaim | Price closes back above the broken support | Price closes back below the broken resistance |
| Follow-through | Rally holds above the level and breaks an intervening swing high | Decline holds below the level and breaks an intervening swing low |
To apply it to a live chart this week:
- Mark the level first. Draw the boundary or significant prior high or low before the move happens, not after.
- Confirm a real break. Price must actually trade past the level; getting close does not count.
- Wait for the close. A reclaim means a close back inside the range, not a wick.
- Check the follow-through. Look for a retest that holds, price moving away, and a short-term swing broken.
Then comes the timing choice. Entering early, near the rejection, gives you smaller initial risk and better potential reward, but you are trading an unconfirmed read and remain exposed to repeated sweeps. Waiting for confirmation gives you more evidence at a worse price.
Most new highs and lows will fail at least one of these steps. That is the point: the framework’s biggest job is telling you when to do nothing.
How do you test, journal and size failed breakout trades safely?
A tidy framework is not an edge. You need to see how it behaves on real charts, including the ugly ones. Start with this exercise:
- Find 20 chart examples, deliberately including failures.
- Mark the level, the break, the reclaim and the outcome on each.
- Note which of the four steps passed or failed.
- Treat the result as training for your eye, not proof that anything works.
Before you review outcomes, define your setup in writing: location, level, break distance, reclaim criterion, entry, stop, target, volume or volatility context, and whether follow-through occurred. Then log every qualifying case, not just the attractive winners. Skipping the losers is how selection and hindsight bias creep in.
For anything resembling evidence, educational guidance commonly cites at least 50-100 trades, with 200+ for stability across market conditions. Treat that as common guidance rather than a rule, and cover trending, ranging, quiet, volatile, news-heavy and low-liquidity environments with spread, commission, slippage, gaps and partial fills included.
Win rate alone will mislead you. Track these instead:
- Expectancy: average result per trade after costs
- Payoff ratio: average win against average loss
- Longest losing streak
- Maximum drawdown: the largest peak-to-trough fall in your account
- Profit factor: gross profits divided by gross losses
Finally, separate discovery from validation. Refine your rules on historical data, then forward-test them without hindsight before committing normal capital.
Sizing the trade
Define your risk before entry, and size from what you are willing to lose, not from how certain the setup feels.
Position size formula Position size = (maximum account risk in currency) / (stop distance × value per point)
Say you will risk 100 currency units, your stop is 20 points away, and each point is worth 1 unit per contract. That gives you 5 contracts. Widen the stop to 40 points and you drop to 2.5 contracts; a wider structural stop requires smaller size, otherwise you have simply increased risk.
Placement matters too. A stop sitting exactly beneath equal lows may sit inside the very liquidity cluster you were trying to exploit.
The regulator figures put this in perspective. ASIC found 68% of retail CFD clients lost money in 2023-24, ESMA’s historical range across national analyses is 74-89%, and the UK’s FCA requires each provider to disclose its own figure. Process and risk control, not pattern recognition, decide whether you last.
For readers wanting to run the metrics properly, our full explainer on trading expectancy shows how a 40% win rate can outperform a 70% one using the expectancy formula.
What this approach changes, and what it does not
Obvious levels can hold clustered orders, and a failed break is a testable event. The evidence comes from reclaim and follow-through, not from assumptions about who hunted whose stops.
None of this guarantees a profit, and no universal success rate exists. What changes is that you stop reacting to every poke through a level and start judging setups against observable criteria. Your next step is simple: run the 20-example study and apply the four steps before you risk any capital.
This article is for informational purposes only and should not be considered financial advice. Investors should conduct their own research and consult with financial professionals before making investment decisions. Past performance does not guarantee future results, and research findings cited here are subject to market conditions and various risk factors.