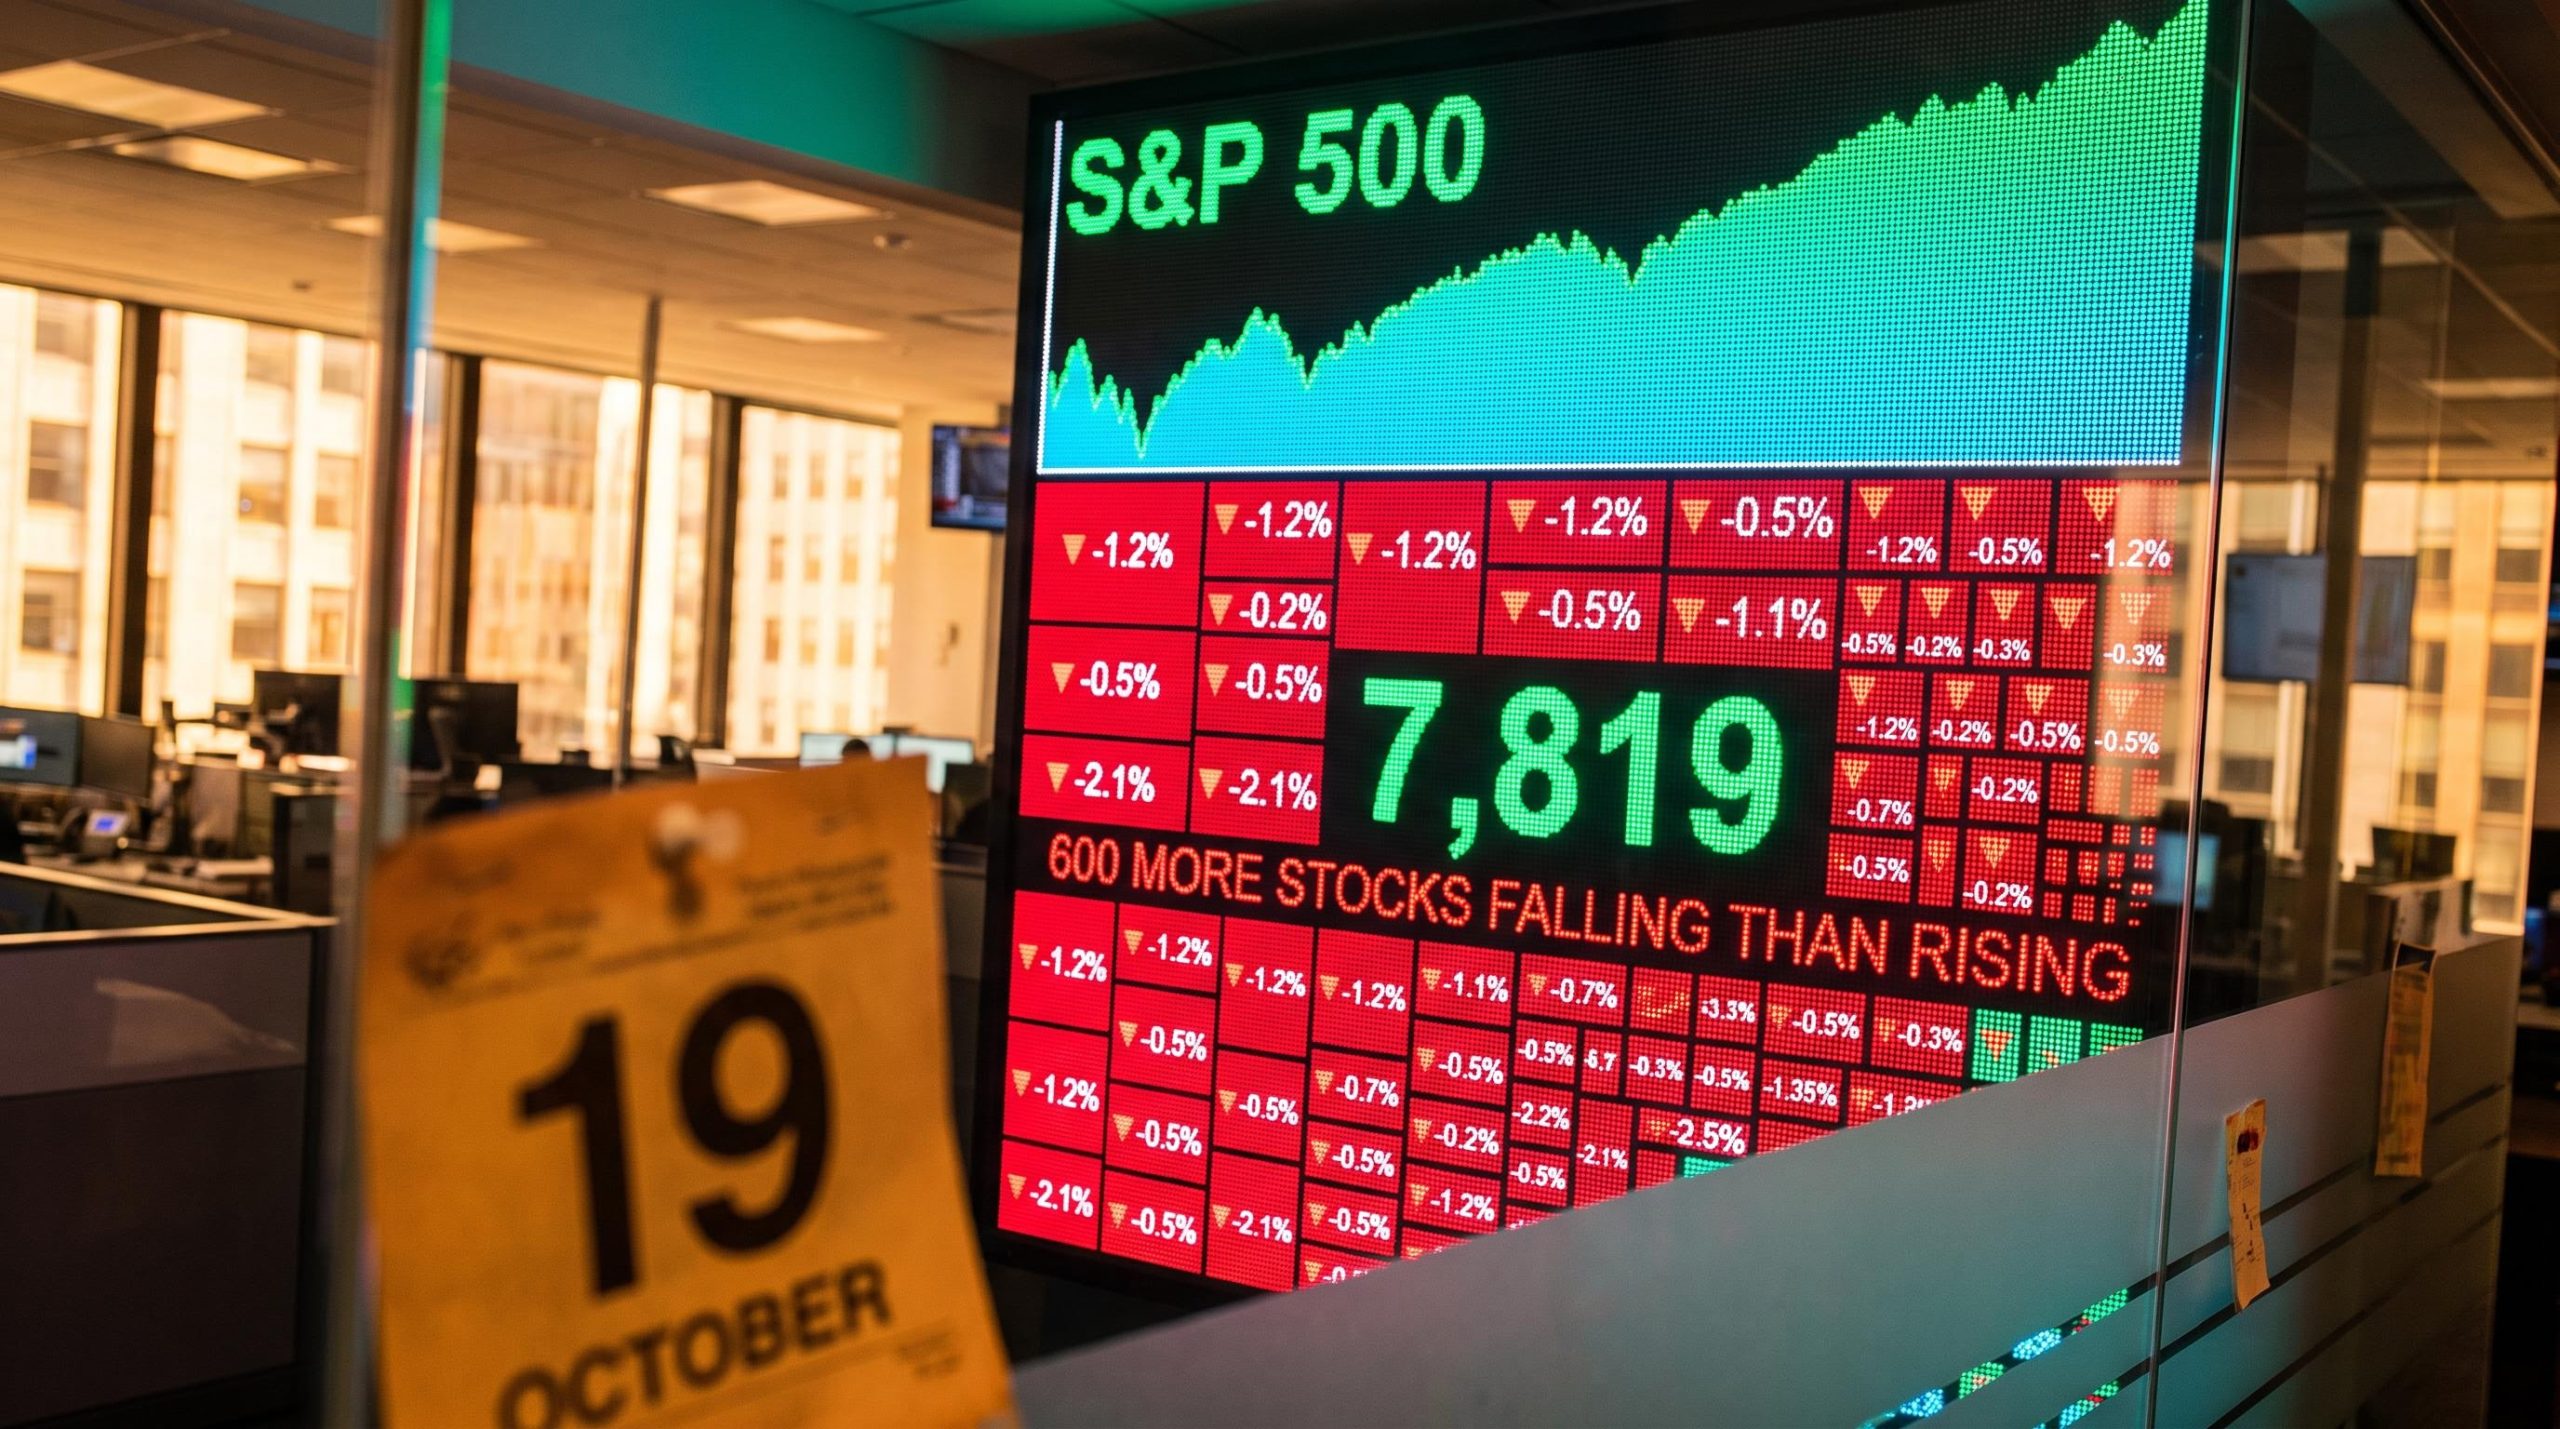
The anniversary of Black Monday passed on 19 October 2026 without a crash, as stocks rose and the Nasdaq gained about 1.4% intraday. Jim Welsh, founder of Macro Tides, still sees the rebound as a bounce that may not last. His market outlook rests on one detail: more stocks fell than rose while the S&P 500 climbed.
Bonds rose alongside stocks. The US 10-year Treasury yield recently hit 5.349%, its highest since 2002, according to Yahoo Finance and WSJ data updated 18 October.
The Federal Reserve meets this month, and October 16 reporting put the odds of at least one hike by December at about 90%.
Here are the indicators Welsh is tracking and the signals that would change his mind.
Why does Jim Welsh think the rally is a bounce, not a recovery?
On the surface, the index looked fine. Underneath, Welsh counted about 600 more S&P stocks falling than rising on a day the index gained 50 points. He says the Magnificent 7 and semiconductors have traded leadership with the broader market in a “tag-team” pattern for more than four months.
He is not alone. Reuters found 62% of S&P 500 stocks below their 50-day moving average on 15 October, while the index sat near a record. A 50-day moving average is a stock’s average closing price over the past 50 trading days. The equal-weight S&P, which gives every company the same weighting, sits almost 5% below its August peak.
Other strategists describe the same market breadth breakdown, with the gap between the index and the median stock now the widest since 2000 even as the S&P 500 sits near its record.
The concentration shows up in earnings too. J.P. Morgan Asset Management says semiconductors make up about 20% of S&P market capitalisation but about 40% of earnings growth. Welsh ties about 76% of this year’s earnings growth to AI.
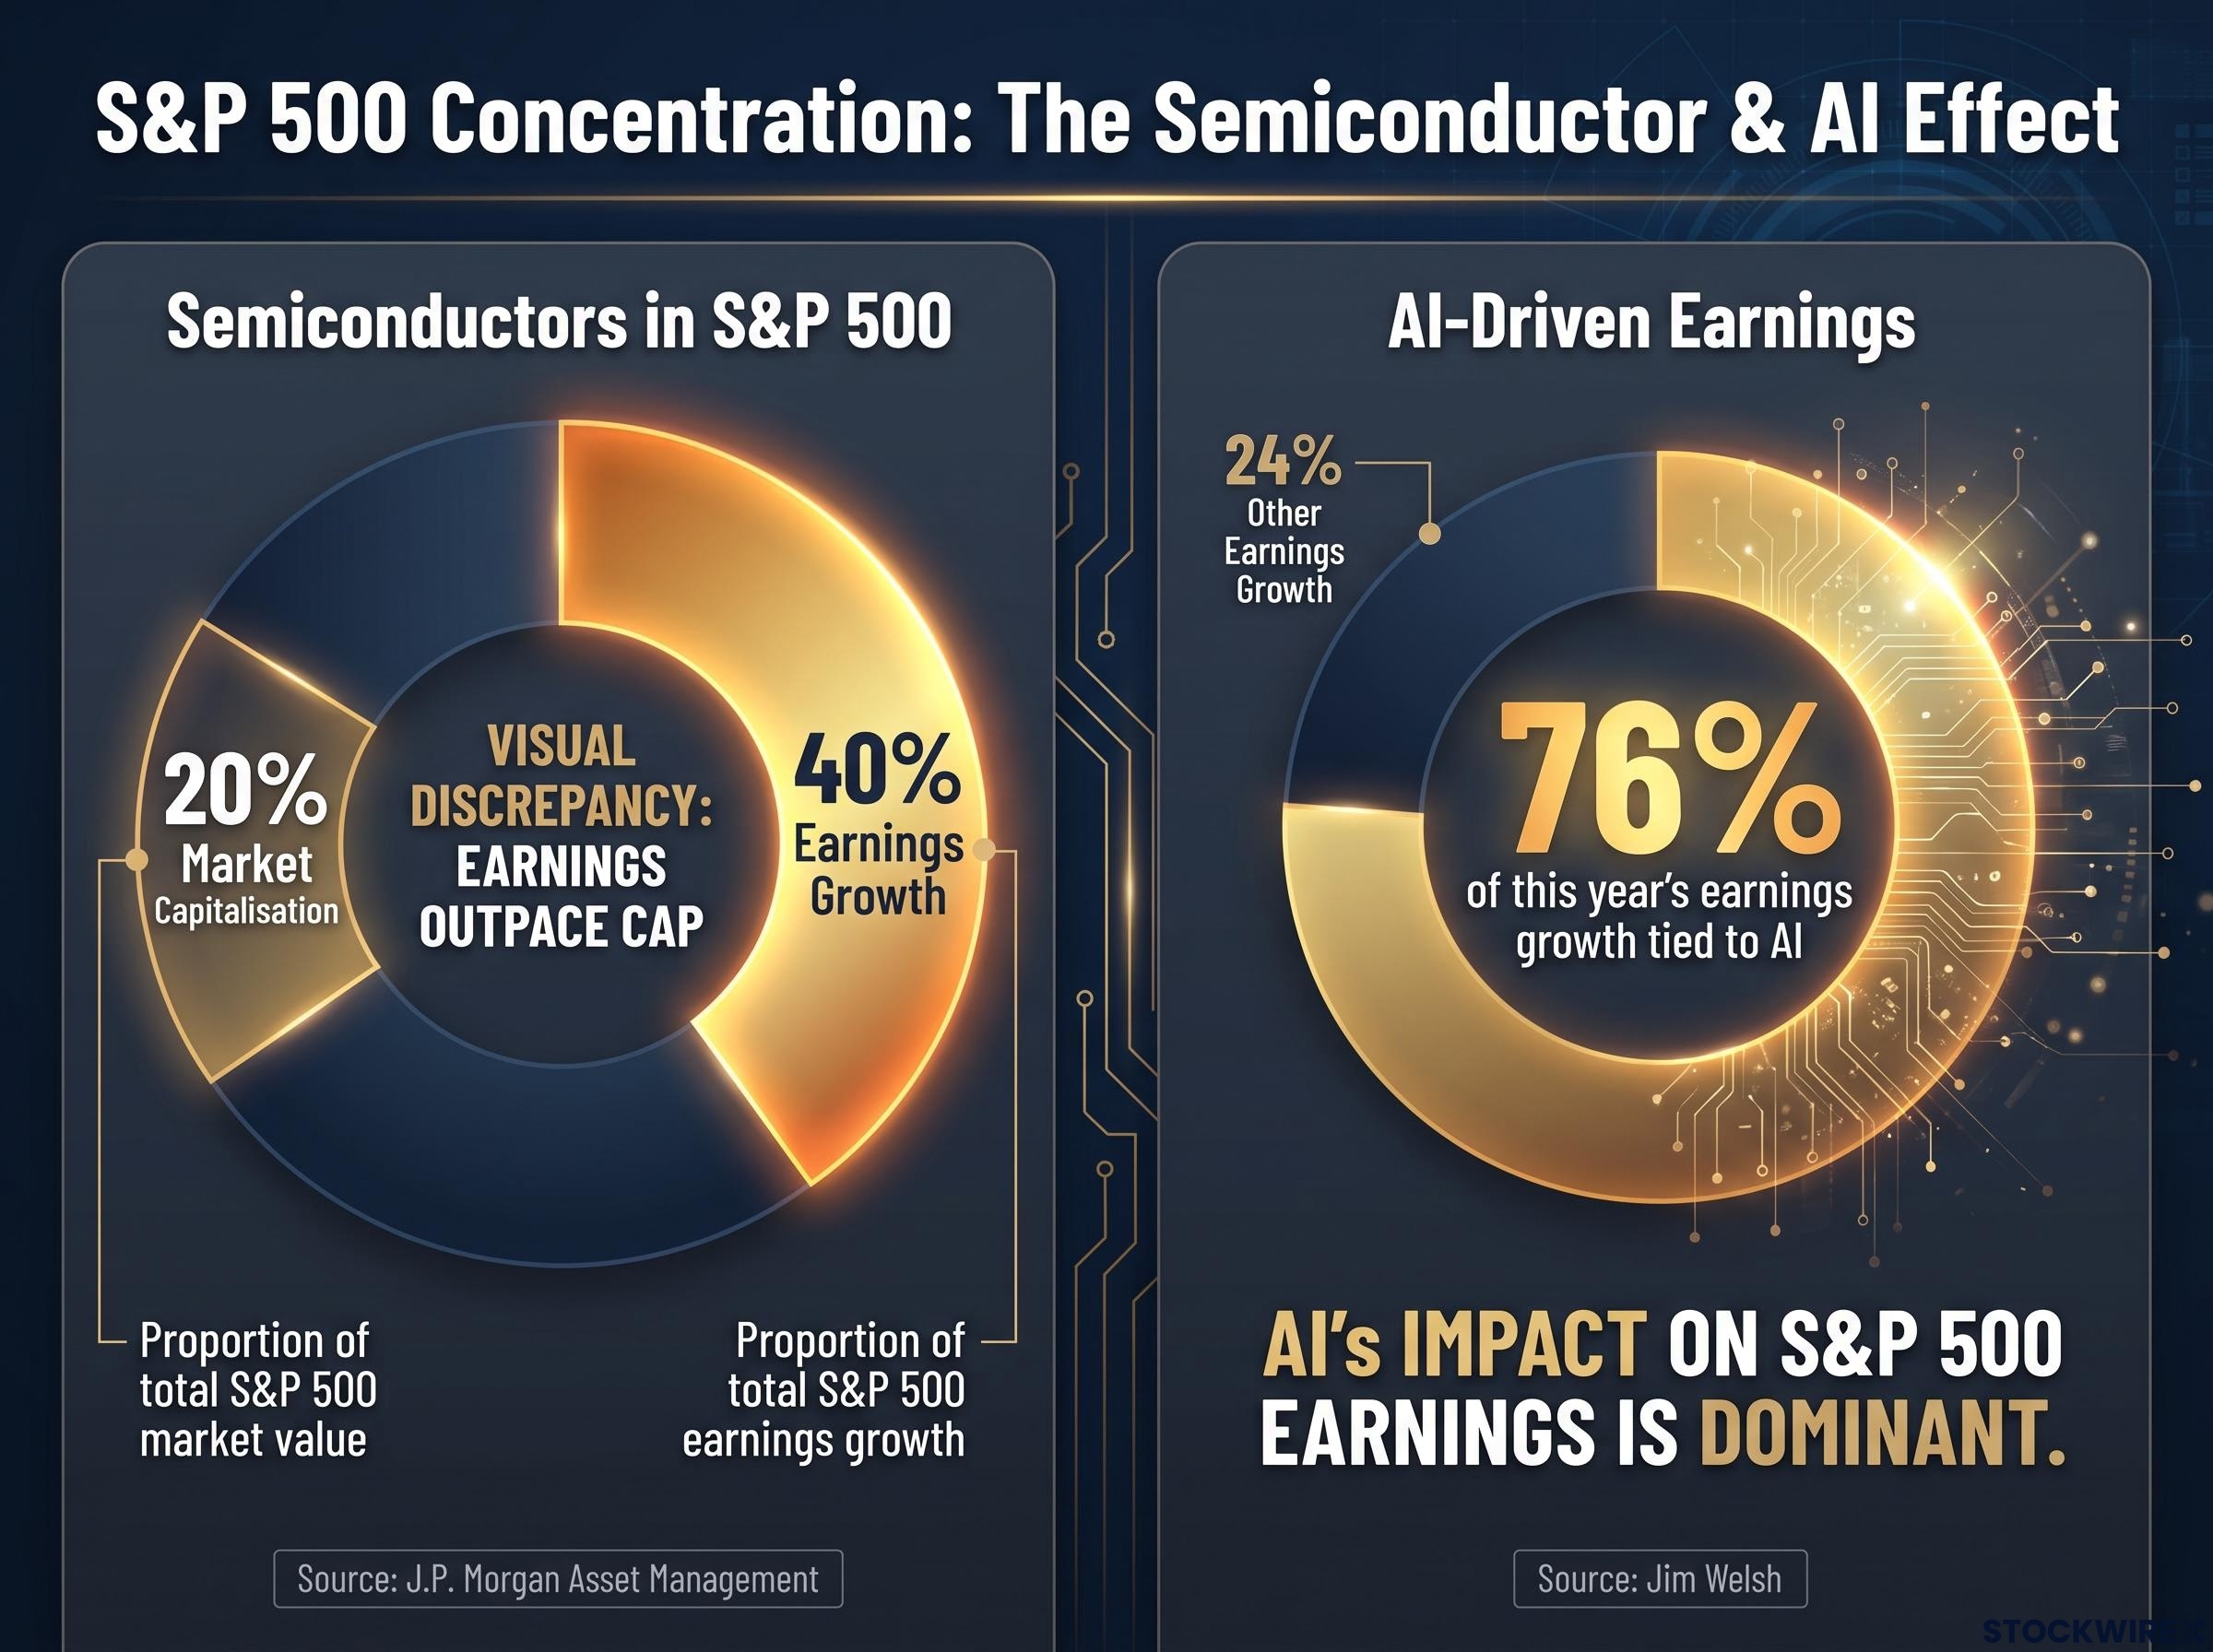
When a handful of stocks carry the index, the headline level overstates how your typical holding is doing. Check whether your portfolio behaves more like the equal-weight index than the S&P.
The bull case still has weight. Charles Schwab data shows the share of stocks above their 50-day average rose from 19.7% to 31% in October.
| Who | View |
|---|---|
| Jim Welsh, Macro Tides | S&P slightly above 7,700, bounce target 7,750-7,800, then risk of decline |
| Goldman Sachs | Breadth narrowest since 2000 |
| LPL Financial | Jeff Buchbinder warns of shock risk; Adam Turnquist sees broadening starting |
| BeiChen Lin, Russell Investments | Non-Mag-7 stocks to catch up on earnings and valuations |
| HSBC | Earnings growth outside Mag 7, tech and energy about 5%, down from 14% |
Reuters separately reported a 7,819 close on 15 October.
The semiconductor technical call
Welsh expects the VanEck Semiconductor ETF (SMH) to eventually break below 503, possibly toward 460. In June he called a drop from 668 toward 515-527, and the low came at 503. He saw the mid-August rally to 639 as a completed ABC rally, which is a three-wave rebound inside a larger downtrend.
The Philadelphia Semiconductor Index fell 3.83% on 16 October to 11,137.29. That marked eight straight losses, its longest losing streak since October 2008. Welsh also says a break below 503 could set up a strong rally later.
Can yields and the Fed turn a narrow market into a falling one?
Welsh argues stocks have been reacting to yields more than to the Fed. He expects one more 10-year high before yields peak. His bullish signal would be the 10-year breaking higher while the 30-year fails to confirm.
He described the 10-year as just above 5% after a drop of more than 30 basis points last week. Reuters-syndicated reporting had it at 5.22% on 13 October. A basis point is one hundredth of a percentage point.
| Market | Latest | Recent high |
|---|---|---|
| US 10-year | 5.22% (13 October) | 5.349%, highest since 2002 |
| Germany 10-year | 3.46% | 3.65%, highest since 2009 |
| UK 30-year | Above 6% | Highest since 1998 |
| France 10-year | 4.84% | About 4.994% |
Welsh attributes the global selloff to absent buyers rather than mass outflows. He reads the Economist’s bond-crash cover as a contrarian sign that the move is mature.
Why yields keep rising
- Large deficits and heavy issuance
- A higher term premium, meaning extra compensation for holding long-dated bonds
- Thin marginal buyers
- Energy-driven inflation
- Fiscal worries in France and Italy
The inflation data has run hot. September CPI rose 0.6% for the month and 3.7% for the year, while PPI rose 6.3% for the year. CME odds of an October hike fell from about 54% to about 28-30% after Fed chair Kevin Warsh spoke on 16 October.
Fed chair Warsh has scrapped forward guidance and withheld his own dot projection, which concentrates repricing risk into speeches and data releases and helps explain why October hike odds swung so sharply.
Welsh expects a hold in October for three reasons:
- Monetary policy works with lags of 12-18 months
- Nine members in June opposed even one hike
- An election falls about five days after the meeting
He then expects a hike in December. A new yield high may hit stocks harder than either decision, so watch the 10-year and 30-year relationship before the meeting.
Is 1987 a fair comparison, and what would turn a bounce into a bear market?
The Dow fell 22% on Black Monday. Welsh doubts a repeat because that crash was driven by portfolio insurance selling, and circuit breakers now exist. He sees 1998 as the better analogy, when the collapse of Long-Term Capital Management triggered an S&P drop of more than 20% in a crowded market.
The threat he describes builds more slowly. Welsh says a secular bear market, meaning a long-running decline, is “right around the corner” but not here yet. He names three possible triggers:
- Higher rates
- An oil shock
- Slowing AI spending
Consensus planned AI capital spending is $800 billion for 2026 and $1.1 trillion for 2027. Welsh expects spending growth of about 25-30% next year, down from 50-60%.
He also says the top 10% of earners account for nearly 50% of consumer spending. That figure is disputed. Moody’s Analytics puts it at 45.5%, while Franklin Templeton cites BLS-based estimates closer to 25%.
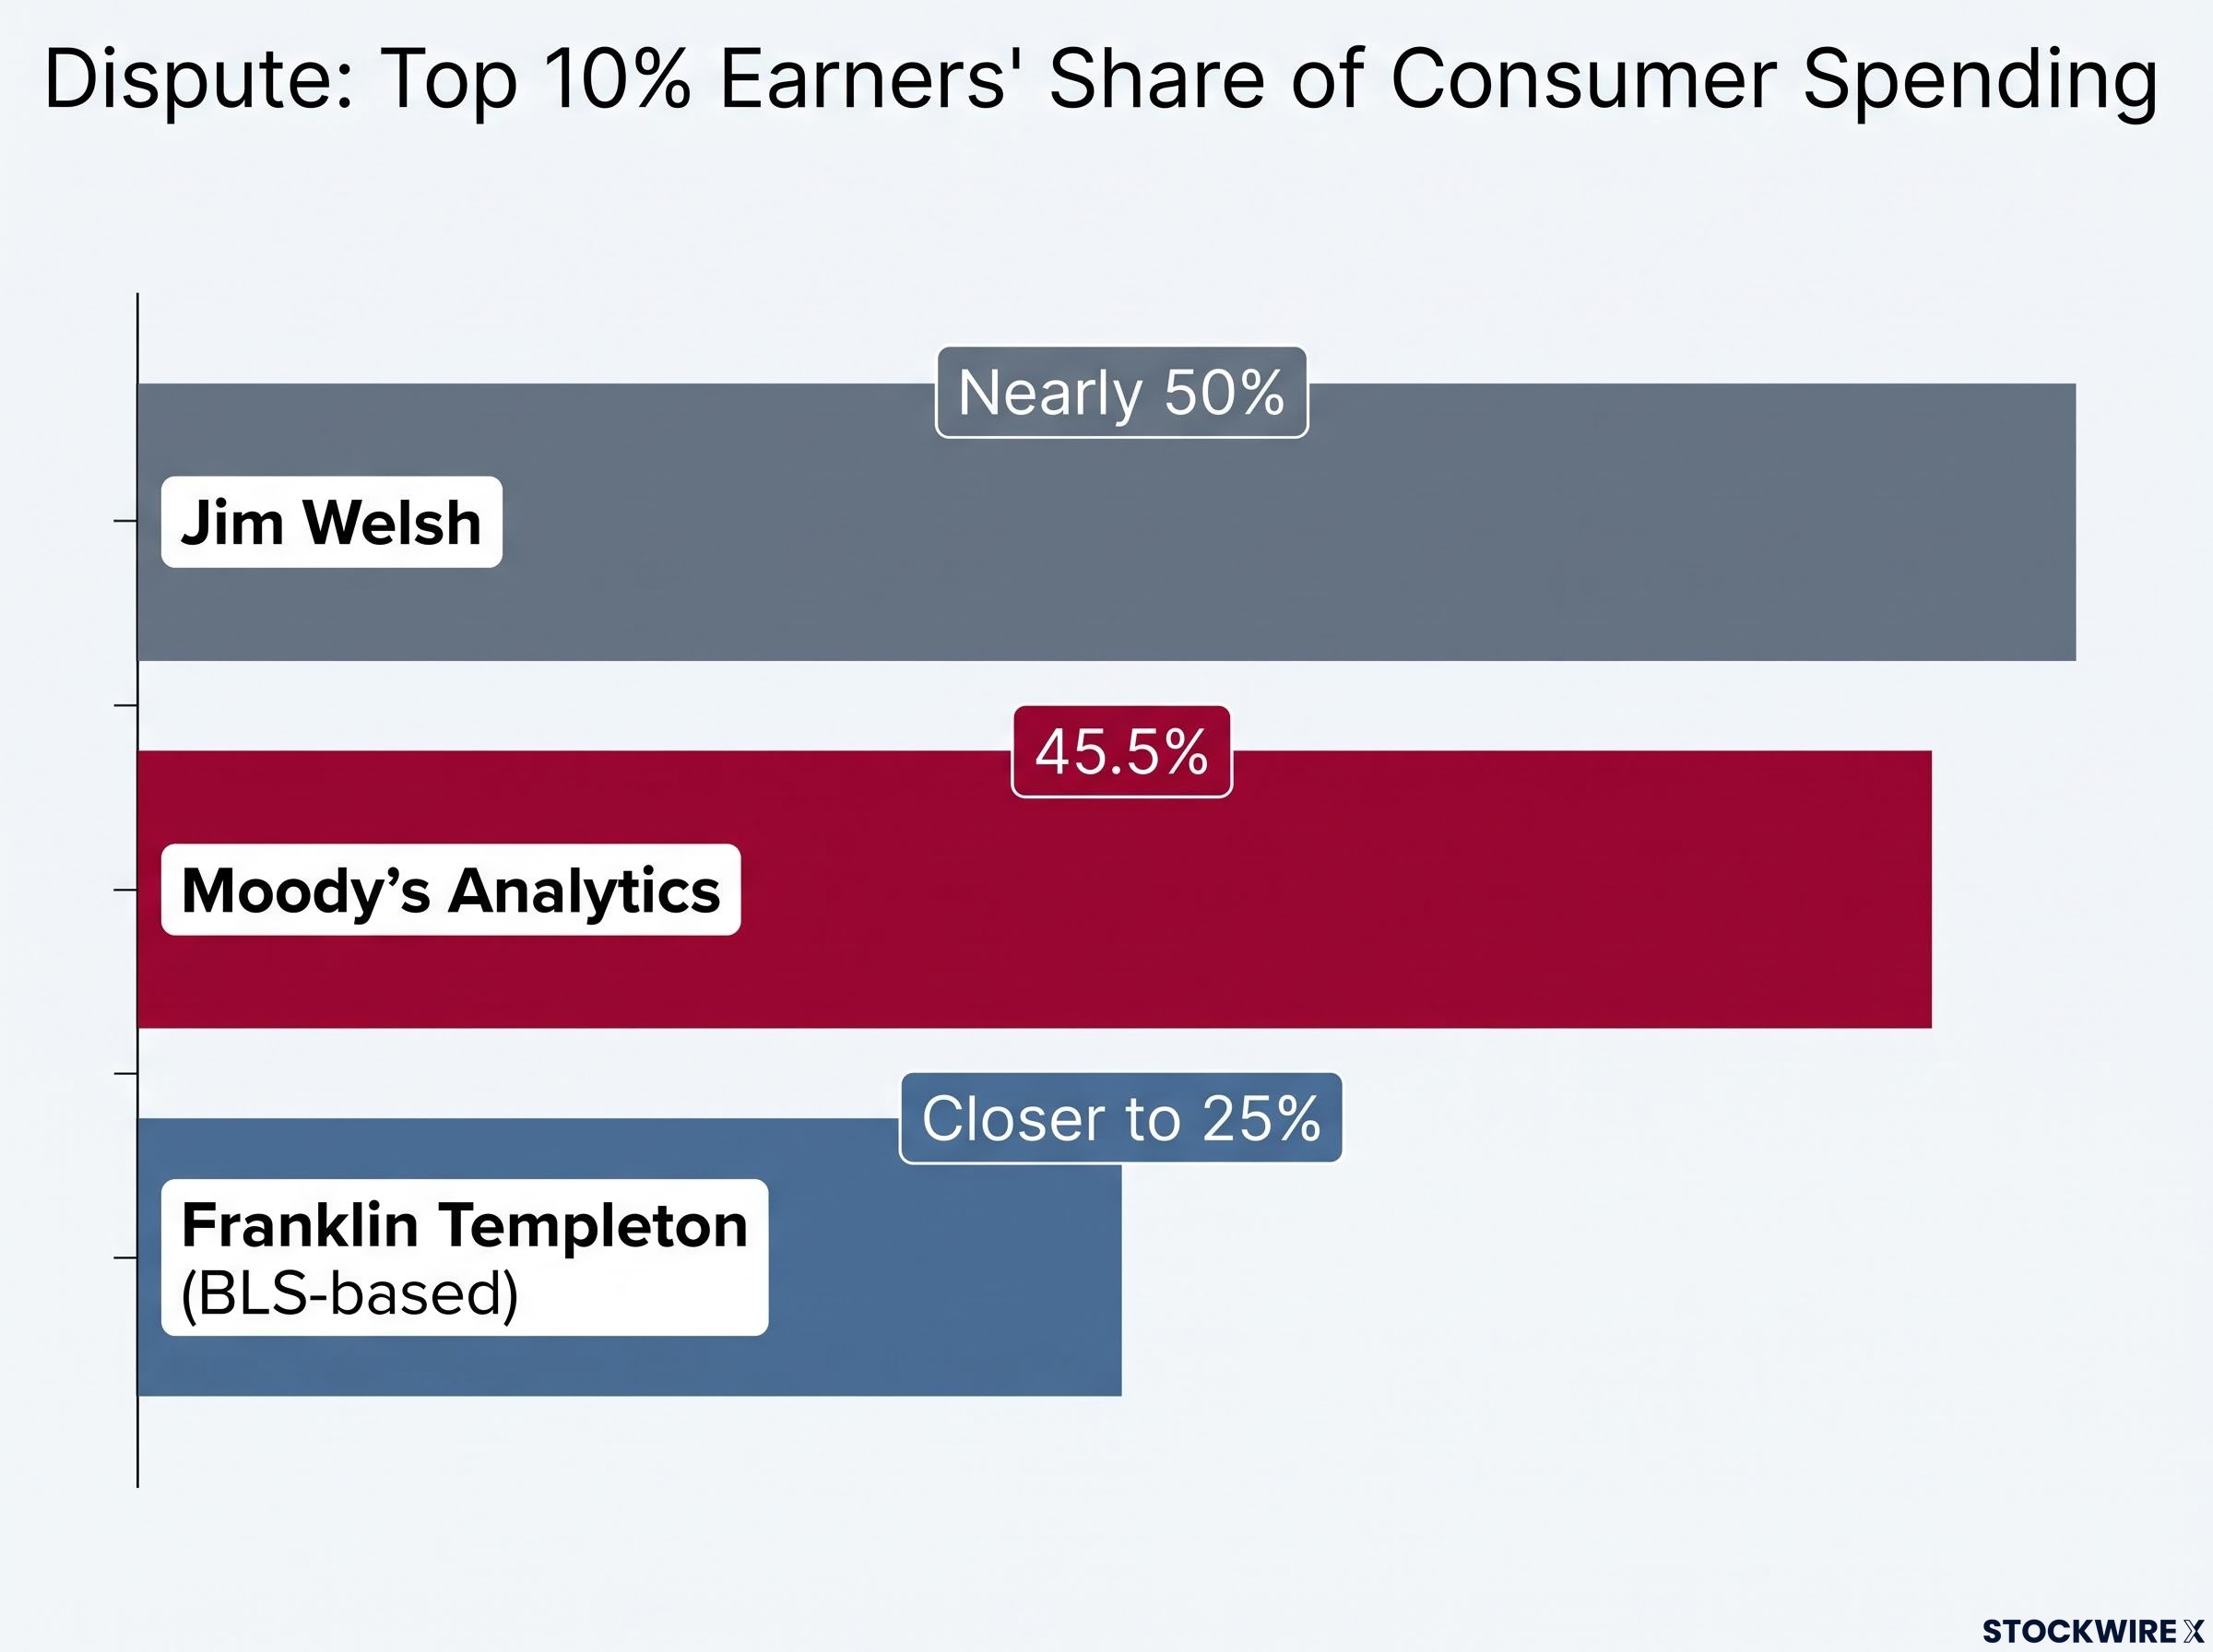
Welsh is warning about a grinding, trigger-dependent decline, not a one-day crash. That makes portfolio concentration and interest rates more relevant to your risk management than crash insurance.
For readers wanting to separate a correction from a lasting decline, our full explainer on bear market versus correction shows how the cause of a drop matters more than its size.
What would change the picture
Russell expects non-Mag-7 earnings to outpace the Mag 7 in Q3. If advancers keep a 2-to-1 lead and more stocks recover their 200-day averages, Welsh’s case weakens. The 30-year failing to confirm a new 10-year high would count as a bullish signal too.
What Welsh’s checklist means before the Fed meets again
Welsh’s framework has two dials, market breadth and the bond market, and two dates, the October and December Fed meetings. The signals to watch:
- The advance-decline line and the equal-weight S&P
- SMH against 503
- The 10-year against its recent high, and whether the 30-year confirms
- The October and December Fed decisions
Welsh is cautious, but he is not predicting a crash. The evidence on whether the rally is broadening remains contested, and this reflects one strategist’s view.
This article is for informational purposes only and should not be considered financial advice. Investors should conduct their own research and consult with financial professionals before making investment decisions. Past performance does not guarantee future results, and forward-looking statements are speculative and subject to change.