
Someone reportedly put about $19.6 million behind a bullish bet on CoreWeave stock. The bonds of that same company are priced as if default is close to a coin flip. The reported block was 23,910 April 2027 $90 calls, bought with the shares near $64 and just above their 52-week low of $59.51.
That trade can be misread in two ways: as proof that smart money sees a bottom, or as noise to dismiss. Neither reading is quite right. The block could not be independently confirmed in available options-flow reporting, so the figures here are as originally reported.
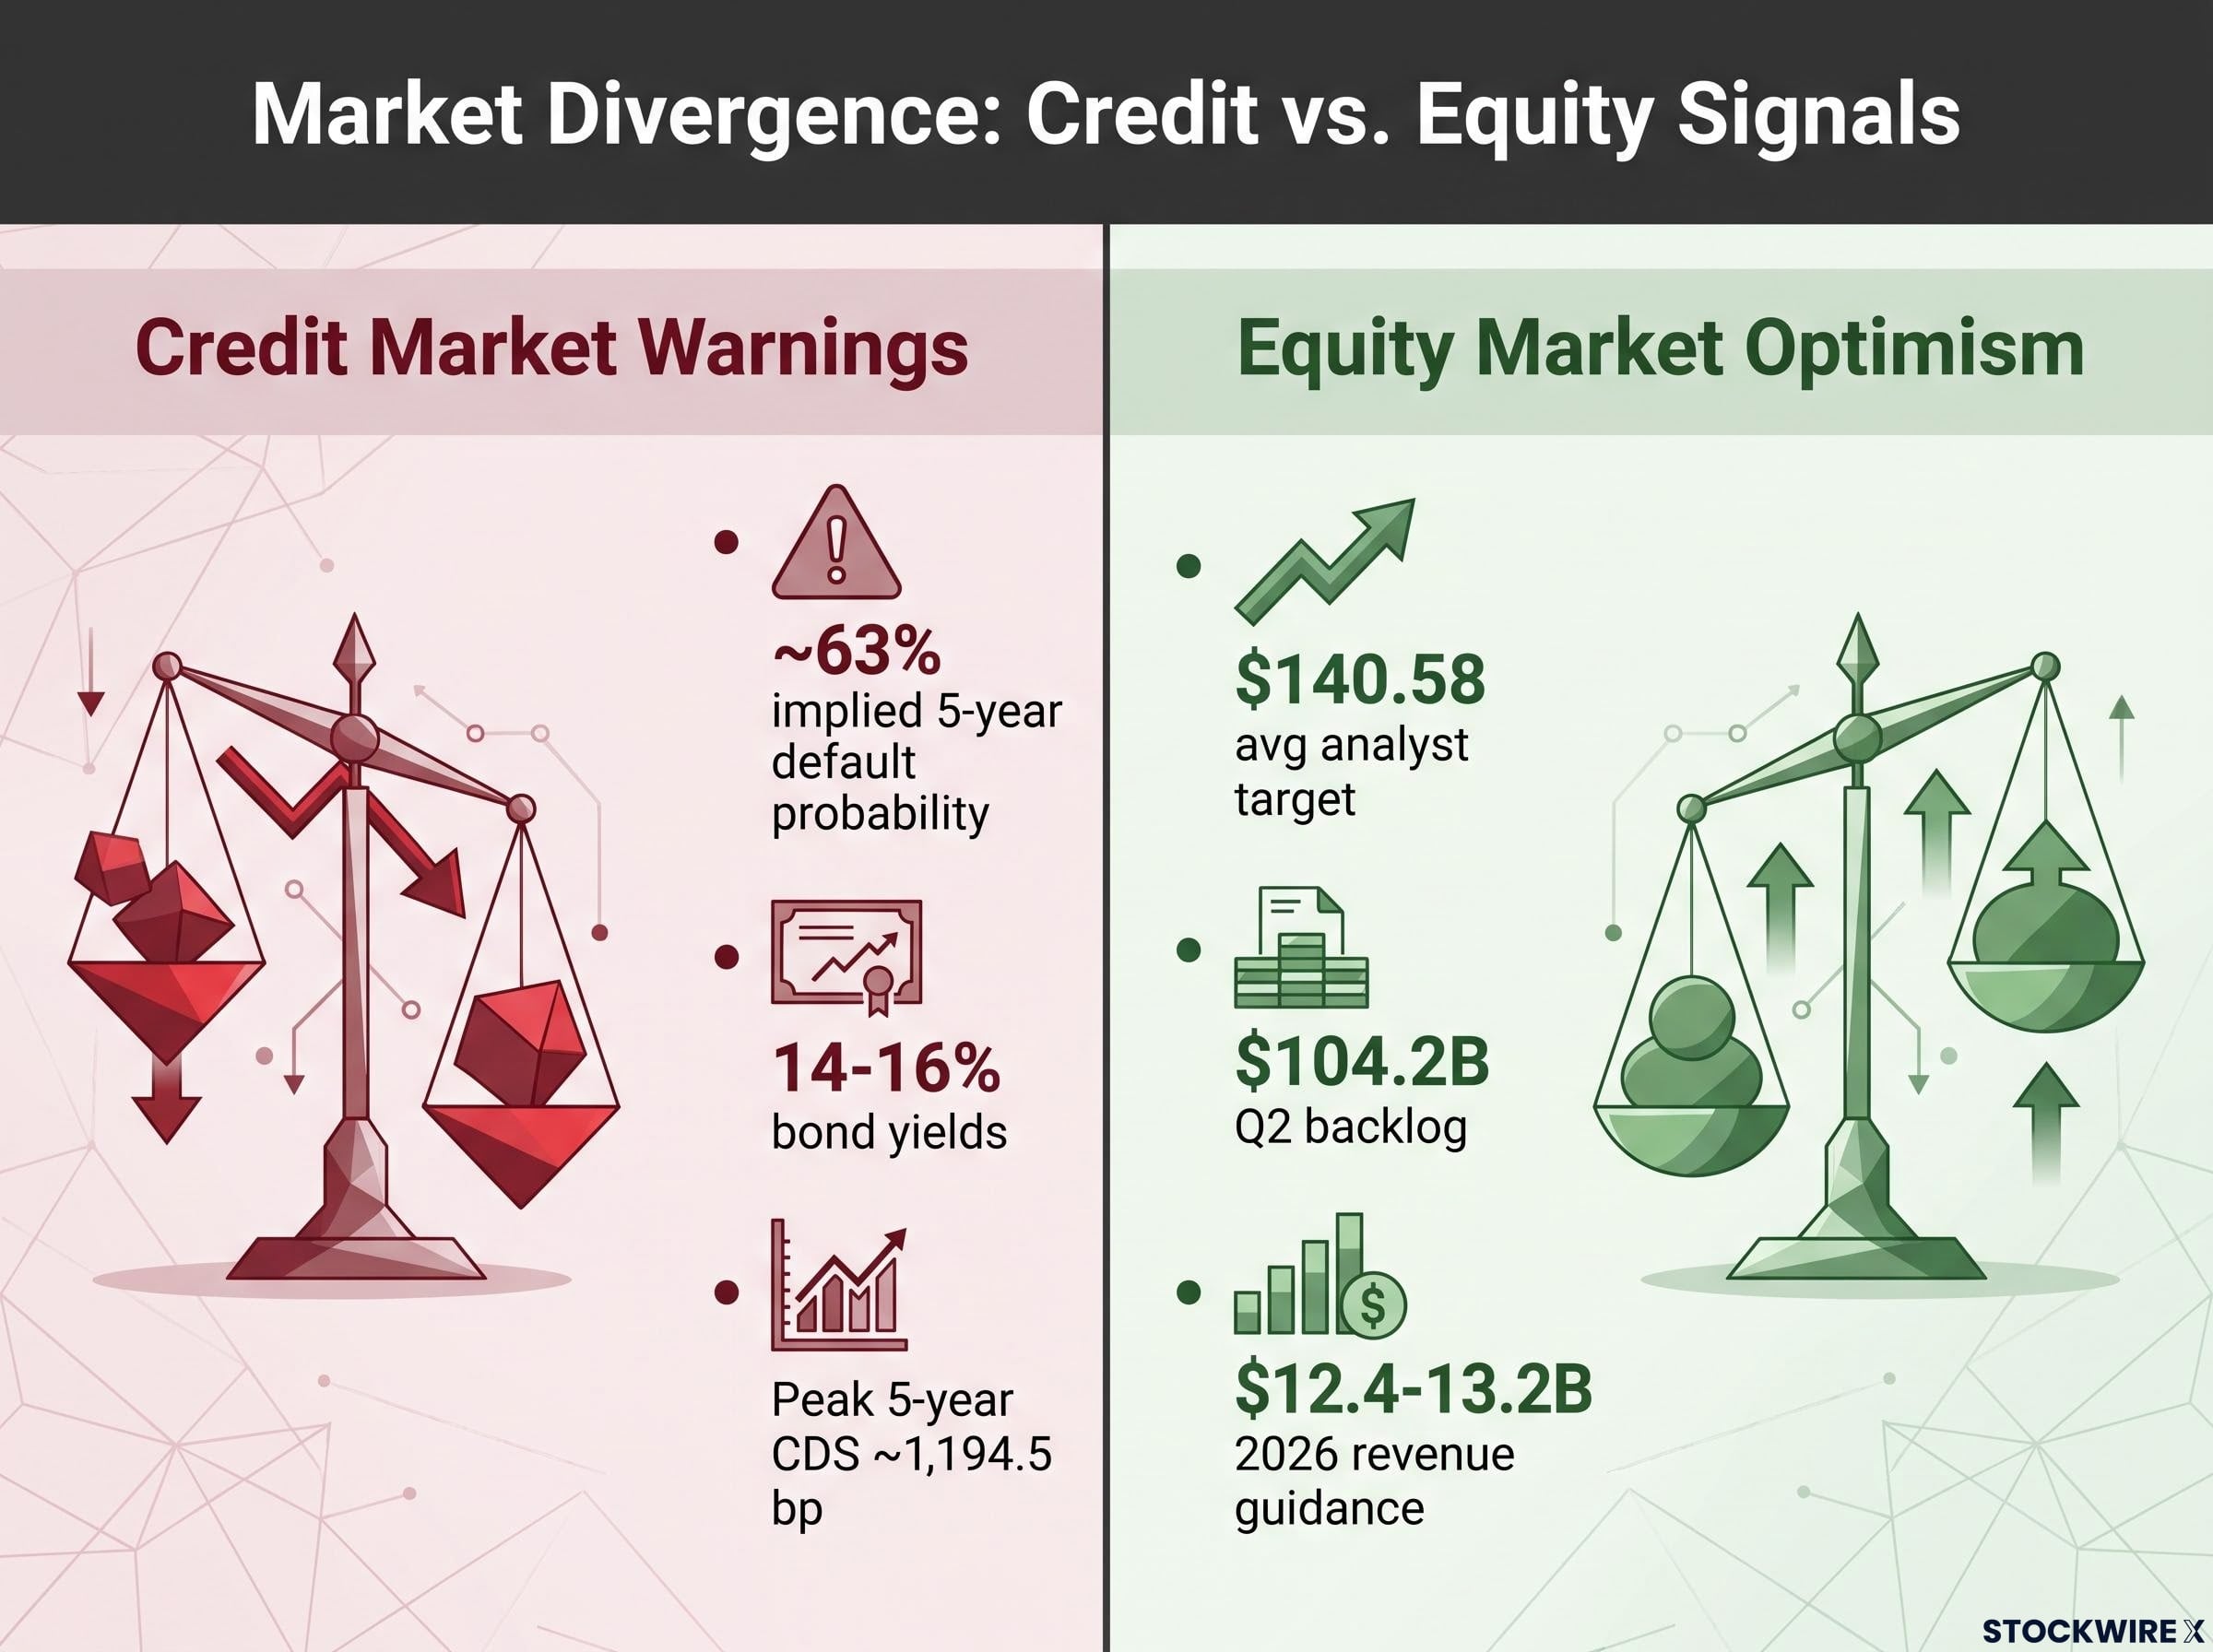
The credit market is sending a darker message. CoreWeave’s bonds trade at yields of roughly 14-16%, and its credit default swaps imply a cumulative five-year default probability of about 63%. Nvidia’s chief executive and the average analyst target of $140.58 sound far more confident.
The signal you choose to trust will shape what you stand to gain or lose. This analysis gives you a way to judge whether the trade reflects informed conviction or an expensive lottery ticket, and what to watch before you think about copying it.
What the 23,910-contract call block does and does not tell you
The size is what grabs attention. A buyer reportedly took 23,910 contracts at the April 2027 $90 strike for about $19.6 million in premium. The strike carried only 1,504 contracts of prior open interest, which points to a fresh position rather than someone closing an old one.
On its face, this is a defined-risk bullish bet. It went in during a late-day bounce on Wednesday 14 October, when the stock closed near $69. By the next morning the shares were back around $64, and the calls were underwater.
Now take away what the trade cannot prove. Without the execution price, the side of the trade, or any paired legs, the block could be a straight directional bet. It could also be one leg of a spread, a hedge against another position, or activity linked to a dealer.
The chain-level data needs care too. As of 9 October, the whole April 2027 expiry showed about 71.93% implied volatility, 24,507 contracts of open interest and a 2.22 put/call open-interest ratio. That 24,507 covers every strike in the expiry, so you cannot compare it with the 1,504 at the $90 strike.
| Metric | Figure | Source status |
|---|---|---|
| Contracts | 23,910 | Reported, not independently confirmed |
| Premium | $19.6M | Reported, not independently confirmed |
| Implied cost per share | ~$8.20 | Calculation from reported figures |
| Expiry breakeven | ~$98.20 | Calculation from reported figures |
| Move needed to strike / breakeven | ~52% / ~53% from ~$64 | Calculation |
Why the breakeven matters more than the strike
Divide $19.6 million by 2,391,000 shares (23,910 contracts of 100 shares each) and you get roughly $8.20 per share. That figure is a calculation, not a verified fill.
Calculated breakeven: about $98.20 at expiry (the $90 strike plus the ~$8.20 implied premium).
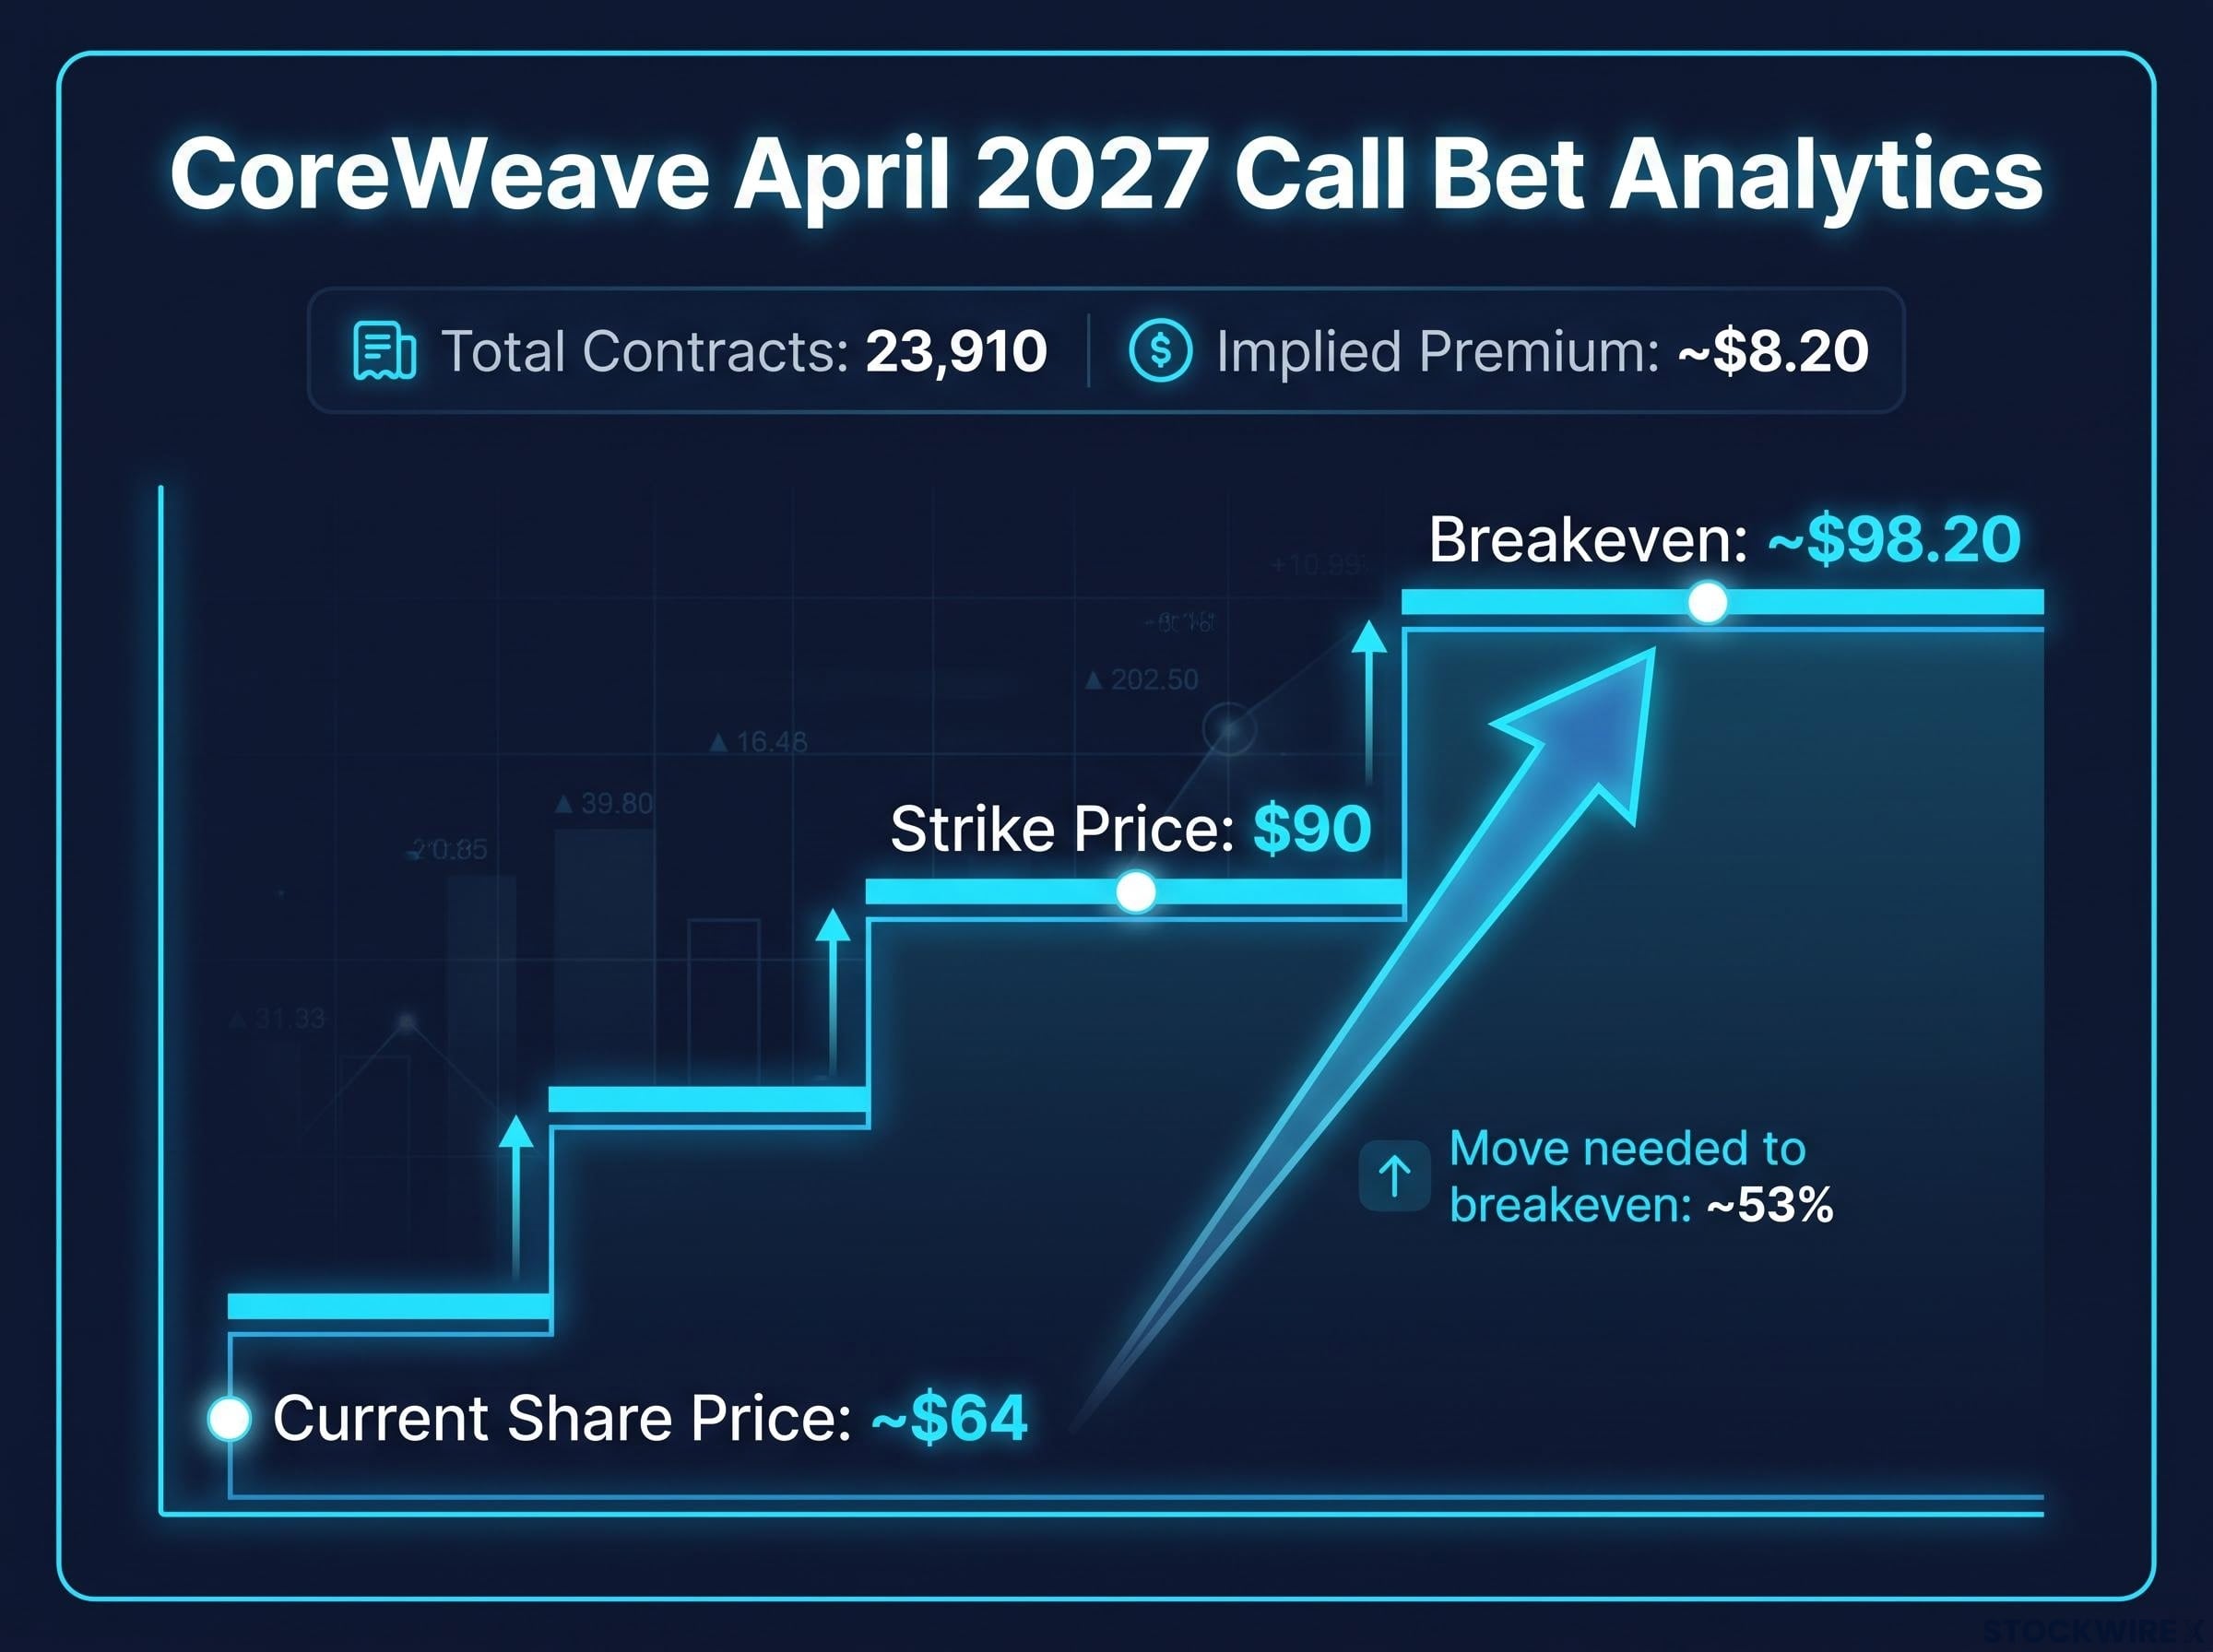
The buyer needs the stock near $98 by April, not $90. With implied volatility this high, the calls were expensive to begin with. The position can still pay off earlier if the shares climb while volatility holds up, without waiting for expiry.
What the block tells you is that someone with capital sees a path to a rebound. It does not tell you they know something you do not, and you should not treat it as a reason to buy.
When big ASX news breaks, our subscribers know first
How long-dated out-of-the-money calls cap risk, and where they do not
A call option gives you the right, but not the obligation, to buy a stock at a set price (the strike) before a set date. It is out-of-the-money when the strike sits above the current share price. In that case the option has no exercise value today and is priced purely on the chance of a future move.
How call options work matters here: one contract controls 100 shares, the premium is the maximum loss, and most buyers still lose money because of time decay and volatility crush rather than direction alone.
Start with the simple idea. The most a call buyer can lose is the premium paid, here about $19.6 million as reported. With roughly six months until April 2027, the window also covers the earnings report due in early-to-mid November.
A shareholder carries a different kind of risk. CoreWeave disclosed on 17 September 2026 an at-the-market programme for up to 35 million Class A shares, worth about $2.92 billion at the time. An at-the-market programme lets a company sell new shares gradually into the market. The same day, it proposed $3 billion of convertible notes due 2033, with up to $500 million more available to the initial purchasers.
Shareholders have to absorb that dilution, along with any refinancing strain or distress. Call buyers avoid all of it.
Now add the complication. Option premiums depend on implied volatility (the market’s estimate of how much a stock will swing), time decay and interest rates. Front-month at-the-money implied volatility was reportedly above 100% on 17 October, though that figure could not be verified. The company can survive and the calls can still expire worthless in three ways:
- Time decay: each week without a rally erodes the option’s value.
- Volatility collapse: if fear fades, premiums shrink even when the share price holds steady.
- Insufficient rise: a recovery to $85 would be a strong move for the stock, but it would still leave the calls worthless at expiry.
The key principle: the loss is capped, but losing the whole premium is a common outcome.
The asymmetry runs both ways. A genuine turnaround could deliver large percentage gains, while dilution, refinancing stress or a fall in volatility could send the calls to zero. For you as a retail investor, buying calls here swaps solvency risk for time-and-volatility risk. Make that trade-off deliberately, and do not treat it as a free safety net.
What the bond market and credit default swaps are pricing
The credit readings are harsh when you lay them out together.
The 2031 bond, issued at about a 9.75% yield, came close to 16% at the peak of the week of 12-16 October and sat around 14.5% on 16 October. The 9.625% notes due 2032 ended the period near 14%. Five-year credit default swaps (CDS), which work like insurance against default, pushed above 1,000 basis points and peaked near 1,194.5.
| Signal | Reading | Date or period | Why it matters |
|---|---|---|---|
| 2031 bond yield | ~16% peak, ~14.5% | Week of 12-16 Oct; 16 Oct | Lenders demand far more than at issue (~9.75%) |
| 2032 notes yield | ~14% | At close | The stress extends across the maturity curve |
| Five-year CDS | Peak ~1,194.5 bp | Week of 12-16 Oct | Default protection is priced at distressed levels |
| Implied five-year default probability | ~63-64% | October 2026 vs ~30% a year earlier | The perceived risk has roughly doubled |
| Net interest vs adjusted operating income | $640M vs $128M | Q2 2026 | Operations do not yet cover borrowing costs |
The balance sheet explains these readings. Q2 2026 revenue reached $2.575 billion, up 112%, with adjusted EBITDA of about $1.51 billion. However, the GAAP net loss was $626 million, and capex ran to about $6.42 billion.
CNBC reported about $35.6 billion of debt at 30 June 2026. Adding $16.3 billion of operating-lease obligations brings the total to about $51.9 billion. The widely cited $51.6 billion appears to combine debt and leases rather than describe borrowing alone. Trailing free cash flow was reportedly about negative $13.7 billion, and the latest quarter came in near negative $5.74 billion.
Outside views add to the pressure:
- Gil Luria, D.A. Davidson: the firm’s analysis estimated CoreWeave borrows at about 9% while earning roughly 1% on its investments. Davidson analysts also warned that the equity could be worth zero in a sharp AI slowdown.
- S&P Global: rates CoreWeave B+, which is below investment grade.
- Gartner: estimated that more than 80% of neoclouds (specialist GPU-rental providers) will not remain independent by 2030.
The uncomfortable point is that demand is not the issue. Credit investors focus on mandatory payments such as interest, maturities, collateral and access to refinancing. Their question is whether cash arrives in time to meet them.
A roughly 63% implied default probability means lenders are demanding payment for real risk. Any equity bet is therefore an implicit wager that creditors are too pessimistic.
CoreWeave’s bond stress has shown up in the debt market well before the share price reflected it, with the 2032 notes trading far below par and rate moves raising the cost of refinancing across AI infrastructure.
The bull case: why Nvidia and equity analysts disagree
The optimistic case deserves its strongest form. Backlog stood at about $104.2 billion at the end of Q2, up 246% year on year, and 2026 revenue guidance was raised to $12.4-13.2 billion. Analyst targets average $140.58, although the range runs from $39 to $278.
Management says it has secured more than $32 billion of debt and equity capital and cut its weighted-average cost of debt by almost 300 basis points. It expects about $1.1 billion of annualised interest savings on its Q2 debt load. Moody’s rated a GPU-collateralised, bankruptcy-remote facility backed by an investment-grade customer at A3, and DBRS rated it A (low). That structure protects the facility’s lenders more than unsecured parent-level bondholders, however.
Then came Nvidia.
Jensen Huang, Nvidia CEO, 15 October 2026: He said CoreWeave’s financial strength improves every day, that he is optimistic, and that Nvidia has no need to provide a rescue or backstop.
Nvidia owns about 10% of CoreWeave and supplies the GPUs it buys. That incentive does not make Huang wrong. It does explain why credit investors give his view less weight: he is not the one holding unsecured bonds.
| Issue | Bear case | Bull case |
|---|---|---|
| AI-cycle risk | A slowdown could leave costly capacity idle | Backlog and raised guidance show demand is holding |
| GPU depreciation | New chips may make older kit obsolete before the debt matures | Long contracts may keep older systems productive |
| Customer concentration | Microsoft was about two-thirds of last year’s revenue | Customer-backed financing earns investment-grade ratings |
| Refinancing | Distressed bond prices could make refinancing very costly | Management reports a falling average borrowing cost |
| Profitability | $640M interest vs $128M adjusted operating income | ~$1.51B adjusted EBITDA, with operating leverage expected |
No current figure for Microsoft’s revenue share was found, so the concentration risk may have shifted since last year. The overall result is a draw rather than a win for either side. The bull case is credible on demand, so the real question for you is whether growth turns into cash before refinancing deadlines arrive.
What could make or break the trade before April 2027
The scale of the task is worth restating. At about $64, the stock needs a gain of roughly 52% just to reach the strike. It has fallen more than 20% in a week, about 45% in six months and about 55% in a year. The 52-week range runs from $59.51 to $150.40, and the all-time closing high was $183.58 on 20 June 2025 (the $187 figure often quoted is likely an intraday high).
These are the signals to watch, ordered by expected timing:
- Earnings in early-to-mid November. One source says 11 November and market-data services list 9 November, and the company has not confirmed either date.
- Daily moves in bond yields and CDS, especially whether the 2031 bond holds below 15%.
- Sales under the at-the-market programme or any further convertible issuance.
- Customer contract news, particularly involving Microsoft.
- Interest cover in later quarters, measured against the $640 million versus $128 million gap.
Signs the thesis is working
Backlog converting into reported revenue would be the first sign. Lower borrowing costs would follow, along with tightening bond spreads and CDS levels well below 1,000 basis points.
Signs it is breaking
New dilution, bond yields stuck in the mid-teens, widening CDS, or changes to customer contracts would all point the other way.
These triggers let you judge whether the thesis is improving or deteriorating without relying on the share price alone. Past performance does not guarantee future results, and the forward-looking figures here are subject to market conditions and company performance.
Weighing the call bet against the credit warning
The reported block is a limited-risk bet on a catalyst. It is not evidence that the credit concerns are misplaced, because CoreWeave’s demand story and its financing story can both be true at the same time.
Treat the options flow as one input among several. Ask yourself how much capital you would commit if you accept that the premium could go to zero. Decide in advance which signal would change your mind: a November report showing interest cover improving, or bond yields that refuse to fall.
Then compare the instruments against your own tolerance for risk. Calls cap your loss but expire. Shares carry dilution and solvency risk. Staying out costs you only the upside.
For readers wanting to limit time decay on a position like this, our dedicated guide to hedging with calendar spreads explains how selling near-term premium can fund longer-dated protection.
This article is for informational purposes only and should not be considered financial advice. Investors should conduct their own research and consult with financial professionals before making investment decisions.