Most traders who add VWAP to a daily chart see a flat, jagged line that seems to track nothing, and they delete it. The tool itself is fine. The missing step is the anchor: on a daily chart, VWAP only becomes useful once you start its calculation from a specific candle you have chosen. That is the core idea behind anchored VWAP swing trading.
The payoff is a reference level grounded in what participants actually paid, not a line drawn by eye or a moving average with an arbitrary length. For a swing trader holding positions for days or weeks, that difference matters. It tells you roughly who is sitting on gains and who is underwater since a moment that changed the stock’s story.
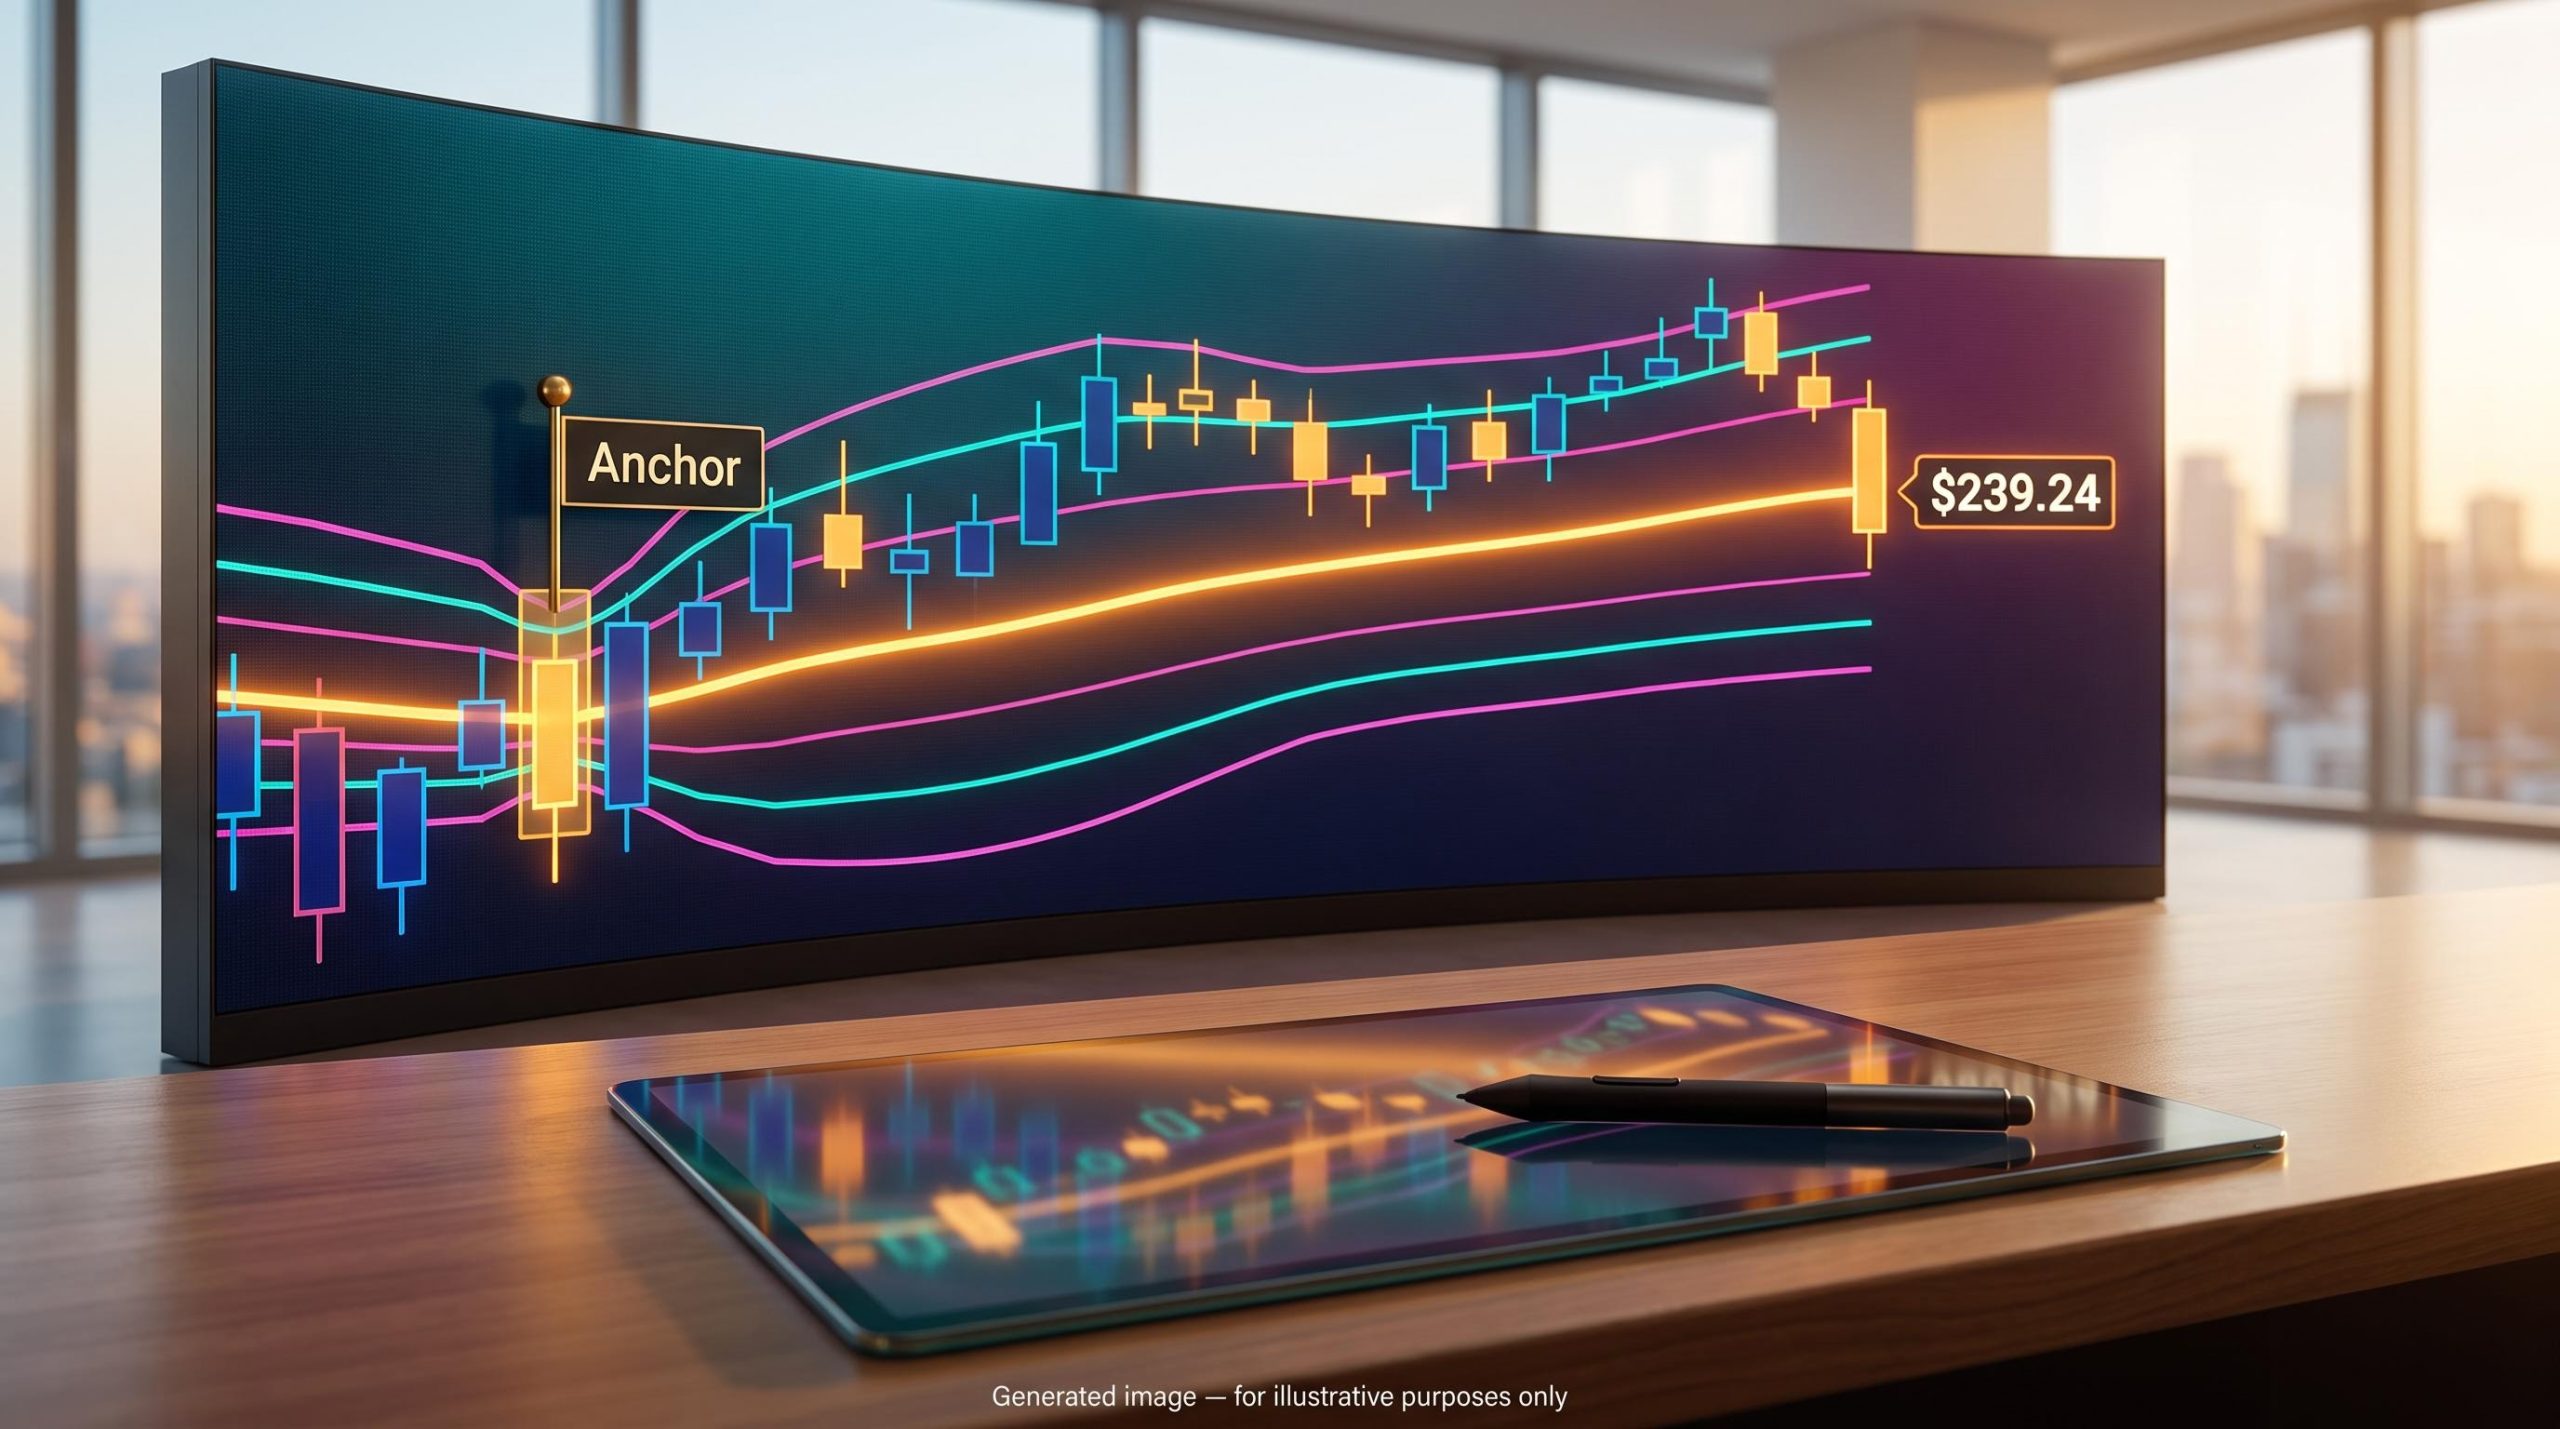
Nvidia runs through this guide as the worked example. Its record close of $239.24 on 6 October 2026 gives you a live chart to practise on.
Here you get a clear method for choosing an anchor, reading the bands, and recognising the point where the tool stops being reliable.
Why standard VWAP fails on a daily chart, and what anchoring fixes
If you have tried standard VWAP on a daily chart and found it useless, your instinct was right. VWAP, or volume weighted average price, is an average price weighted by how much volume traded at each level. The standard version resets at the start of every session, so on a daily chart each candle effectively restarts the calculation and the line carries no usable information.
Anchoring changes the starting point. Instead of resetting each day, the calculation begins at a candle you select and ignores everything before it.
Anchored VWAP: the volume-weighted average price of every trade from a chosen candle to the present, approximating the average cost of participants since that event.
The maths is simpler than it looks. For each candle from the anchor onward, the indicator takes the typical price, which is the high plus the low plus the close, divided by three. It multiplies that by the candle’s volume, adds the results together, then divides by the total volume over the same stretch.
Deviation bands sit above and below the line at 1, 2 and 3 standard deviations. A standard deviation measures how far prices typically spread from the average. Here it is volume-weighted and accumulated from the same anchor, so the bands widen or tighten with the trading that has actually occurred since your chosen candle.
TradingView lets you adjust or disable these bands. Its auto version can also pick the anchor for you using the Highest High, Lowest Low or Highest Volume candle over a lookback period you set. To place the tool manually:
- Open the drawing toolbar on the left panel and find anchored VWAP among the measurement and volume-based tools.
- Click the candle you want to anchor to.
- Open the settings and enable the 1, 2 and 3 standard deviation bands.
Once it is on your chart, read the line as a dividing point. Price above it means the average buyer since your event is in profit; price below means the average buyer is underwater. That is a question that plays out over days and weeks, which is why the tool suits swing trading so well.
Because you hold positions for days or weeks, your swing trading criteria should start with market bias and chart levels, and only then weigh fundamental quality as a possible veto.
When big ASX news breaks, our subscribers know first
How do you choose the right anchor candle?
Everything the line tells you depends on where it starts. The primary rule is straightforward: anchor to a significant candle, such as a prior all-time high or the highest-volume bar on the chart. Your volume indicator helps here, because the tallest volume bar points you straight to the candle where participation peaked.
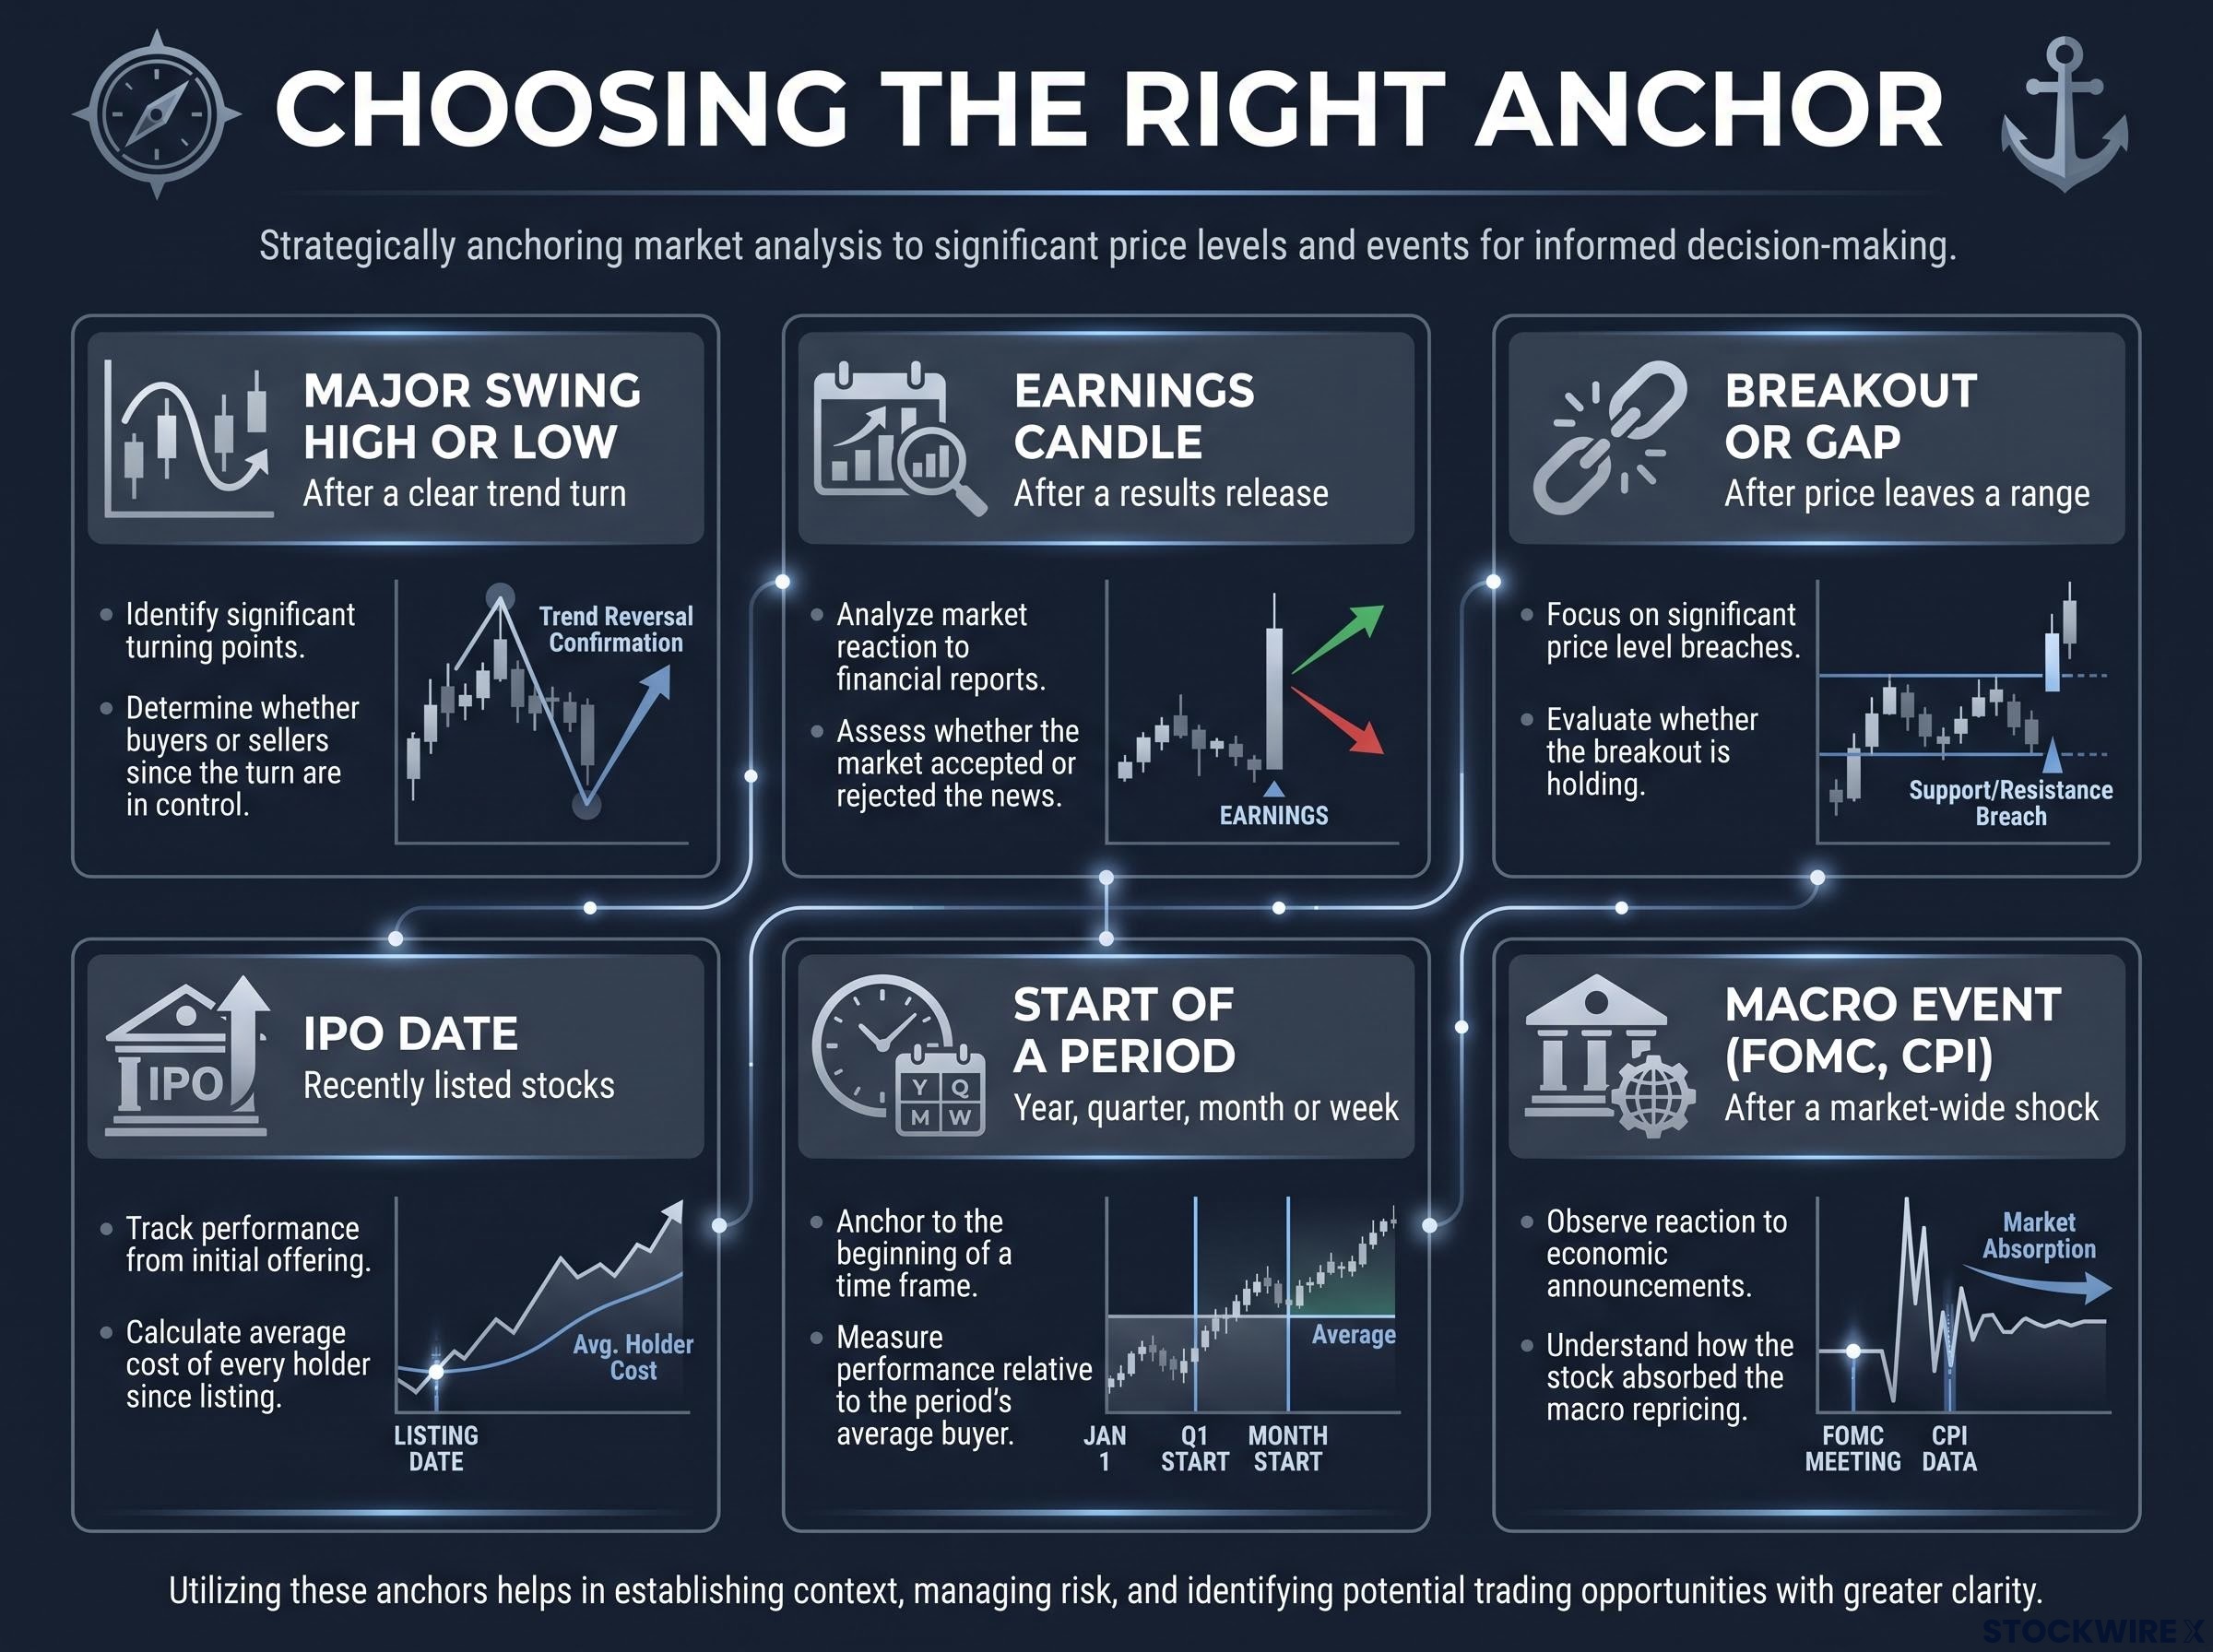
Other anchors test different questions about who controls the stock.
| Anchor type | When to use it | What it tests |
|---|---|---|
| Major swing high or low | After a clear trend turn | Whether buyers or sellers since the turn are in control |
| Earnings candle | After a results release | Whether the market accepted or rejected the news |
| Breakout or gap | After price leaves a range | Whether the breakout is holding |
| IPO date | Recently listed stocks | Average cost of every holder since listing |
| Start of a period | Year, quarter, month or week | Performance relative to the period’s average buyer |
| Macro event (FOMC, CPI) | After a market-wide shock | How the stock absorbed the macro repricing |
Brian Shannon of Alphatrends, one of the best-known practitioners of the method, frames anchors around “who is trapped” and “who is in control” after supply and demand shift. A good anchor marks a moment when that balance genuinely changed.
Use one primary anchor. Add a second only when a genuinely different regime has begun, such as a fresh earnings reaction that broke the prior trend.
Be honest with yourself here. Different anchors produce materially different lines, and if you hunt for the one that supports the trade you already want, the line will simply flatter your bias.
Anchoring Nvidia to its earnings and all-time-high candle
The source presenter, Lawton of Verified Investing, anchored Nvidia to its prior all-time-high candle, which also coincided with an earnings release. That combination matters. A record high on results day marks a moment when a large wave of new buyers committed capital at a known price, so their average cost becomes a meaningful reference.
Remember that each new candle shifts the line. A level you marked weeks ago will have moved, so re-read the chart regularly rather than trading off old drawings.
Reading the central line and the 1, 2 and 3 standard deviation bands
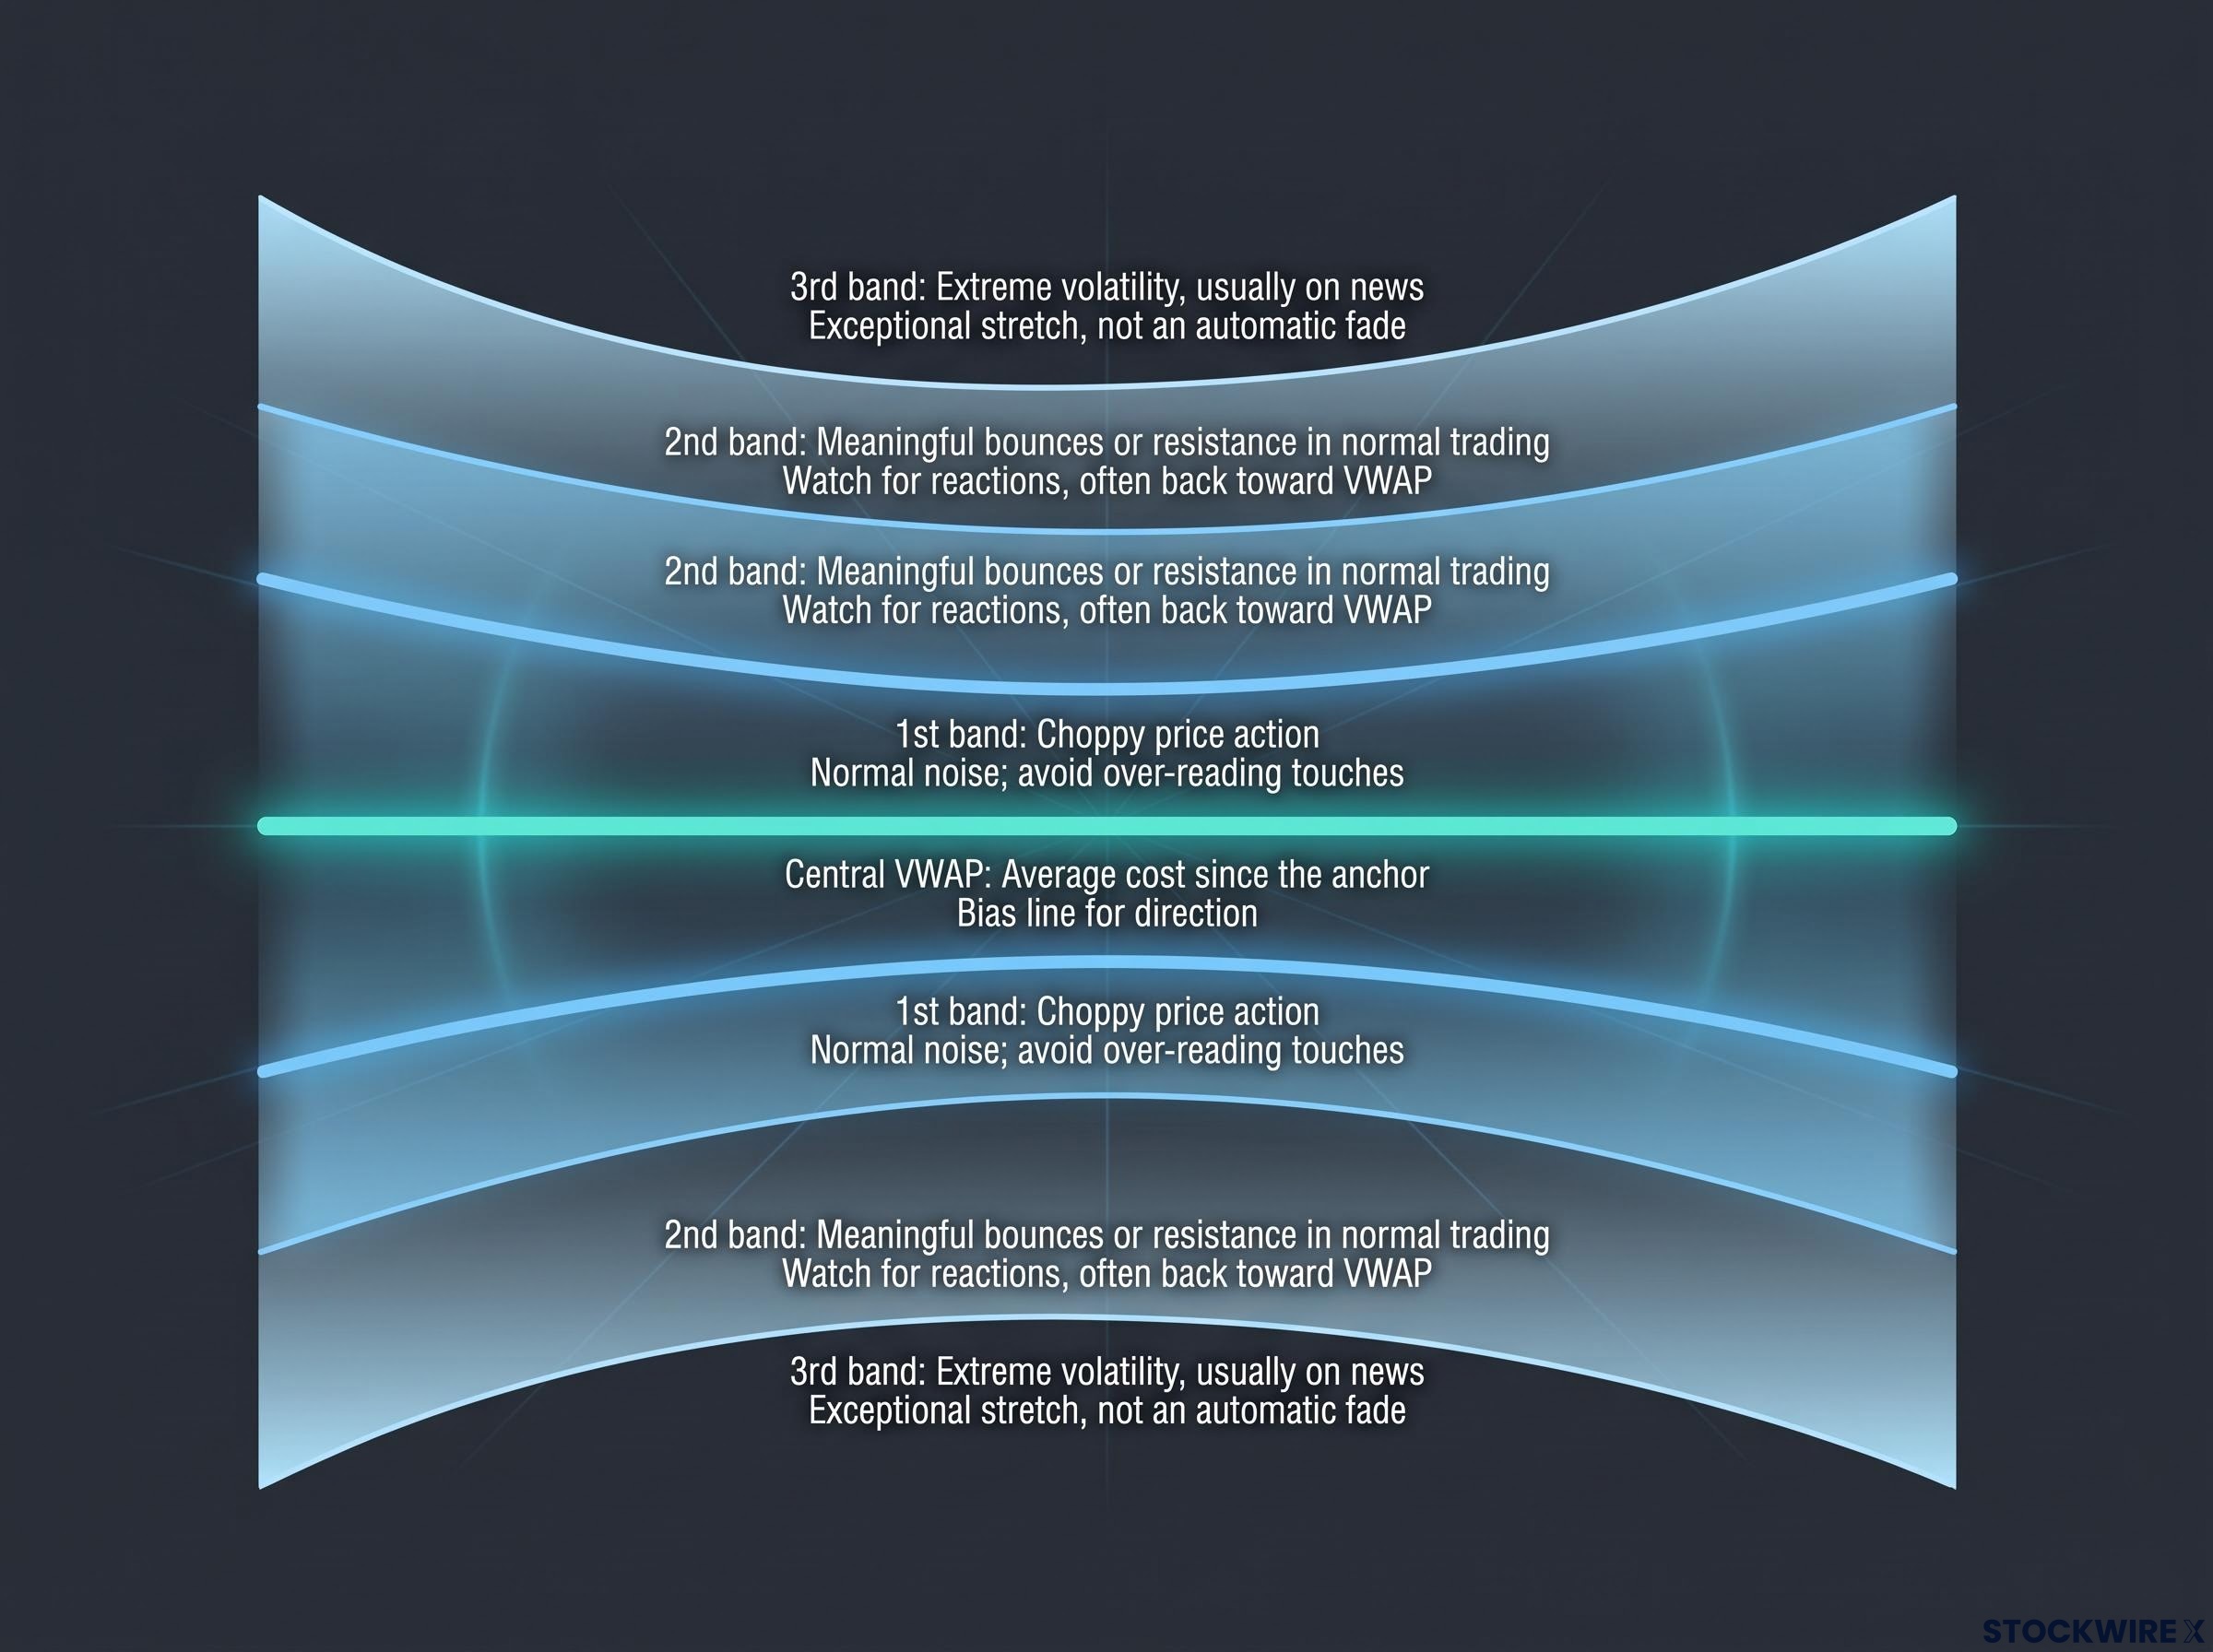
With an anchor in place, read the chart from the centre outward. Each step away from the line represents more stretch, and price tends to behave differently at each rung.
The central VWAP is your bias line. When price holds above it for a sustained period, bullish setups have the wind behind them; when it holds below, a defensive stance makes more sense.
| Level | Typical behaviour | How to treat it |
|---|---|---|
| Central VWAP | Average cost since the anchor | Bias line for direction |
| 1st band | Choppy price action | Normal noise; avoid over-reading touches |
| 2nd band | Meaningful bounces or resistance in normal trading | Watch for reactions, often back toward VWAP |
| 3rd band | Extreme volatility, usually on news | Exceptional stretch, not an automatic fade |
The first band is where price wanders. Touches here rarely mean much on their own.
The second band is where the tool earns its keep. In normal conditions, it tends to produce real reactions, with pullbacks often drifting back toward the central line.
The third band is a different animal. Price usually reaches it only when news hits, and once there, it can keep running.
Nvidia’s chart shows each of these behaviours:
- Price bounced repeatedly off the second band and frequently pulled back toward VWAP.
- After reaching one band, the stock bounced roughly 7%, then pierced another band and moved back toward the line.
- After breaking to the third band, the stock surged around the early 2026 Iran escalation.
The third-band surge: after Nvidia broke through to the third band, the stock rallied about 32%.
That surge is the lesson. The third band tells you price is unusually stretched, not that it must snap back. If you had shorted that touch on the assumption of reversion, the move would have been expensive.
Standard deviation bands measure realised spread since your anchor, which is a different thing from implied volatility, the forward-looking expectation of movement priced into options and a useful cross-check on how stretched a stock really is.
Lawton calls anchored VWAP his most important indicator for swing and day trades. Even so, how you treat each band decides whether the tool helps or hurts you.
Where anchored VWAP breaks down, and what to add to it
There are sound reasons the lines often work. They approximate cost basis, so holders above the line may defend gains while trapped buyers below may sell into rallies. Institutions benchmark execution against VWAP-style measures, and when enough traders watch the same level, orders cluster there.
The counter-view deserves equal weight. Anchored VWAP is a transformation of past price and volume, not a forecast, and its apparent success may partly reflect trend persistence and flattering anchor choices. No independently audited study shows it outperforms simpler methods; the evidence you will find is chart-based and educational.
The main ways it fails:
- Strong trends walk the bands. Price can ride the +1 or +2 sigma band for weeks without reverting.
- 3 sigma is not a guaranteed reversal. The 68/95/99.7% rule assumes conditions that markets often violate, including sudden regime shifts.
- Anchors age. As ownership turns over, old volume stays in the calculation long after those holders have sold.
- Whipsaws and false breaks. Brief crosses that trigger stops and reverse are common in ranges and low volume.
- News overrides levels. Nvidia’s Q2 FY2027 report on 26 August 2026 showed revenue of $96.2 billion, up 106%, with Q3 guidance of $108 billion, yet the shares fell.
That last point should stay with you. No volume-derived line can absorb a shift in expectations overnight.
Before acting on a band touch, run through four checks:
- Confirm the broader trend, and whether price sits above or below VWAP.
- Look for volume confirming the reaction at the band.
- Check for overlap with horizontal levels, RSI or a price pattern.
- Define your thesis, invalidation level and position size before entering.
The presenter’s own caution: even Lawton, who ranks anchored VWAP above every other indicator, says VWAP alone is insufficient for trading.
The line tells you where to look for a reaction. Your trade still needs a thesis, a stop and a size.
The fix for a single tool’s blind spots is stacking independent indicators from different families, such as trend, volume, momentum and structure, so no one signal carries the whole decision.
Using the line as a reference, not a verdict
Three habits carry this method. Anchor to a significant candle you can justify, such as a record high, the highest-volume bar or an earnings release. Read the bands as graded zones, from choppy first band to news-driven third band. Then confirm with trend, volume and structure before committing.
Your next step is practical. Open a daily Nvidia chart, anchor to the latest major high or earnings candle, enable the bands, and watch how price behaves around each level for a few weeks before risking any capital. Observation will teach you more than any single setup.
Investors exploring probability-based thinking beyond bands will find our full explainer on options probability, which shows how the chance of touching a level differs from closing beyond it.
This article is for informational purposes only and should not be considered financial advice. Investors should conduct their own research and consult with financial professionals before making investment decisions. Past performance does not guarantee future results, and outcomes from any technical method vary with market conditions.