
The crowd at this month’s Mortgage Bankers Association (MBA) conference expected roughly three years of softer home prices. Yet the latest S&P Cotality Case-Shiller national index shows prices still up 1.5% year on year. Both readings can be true at once, and the gap between them is where mortgage risk in 2026 actually sits.
The stress is not a uniform national crash. It shows up in real (inflation-adjusted) price declines, rising credit costs and old low-coupon mortgages that quietly weigh on balance sheets. That pressure lands differently on lenders, banks and mortgage real estate investment trusts (REITs).
The timing is sharp. The MBA published its updated forecast on 11 October 2026, and Bank of America reported third-quarter results on Wednesday, 14 October.
Here is a way to read mortgage stress and housing prices through one question: is a given company exposed to volume, to duration or to leverage? The answer tells you which headline is most likely to hurt it first.
Is this a crash or a slow grind? What the price data and forecasters actually say
On the surface, the nominal numbers look reassuring. In June data released on 25 August, Case-Shiller showed the National Index up 1.5%, with the 20-City Composite up 2.1%. Consumer prices rose about 3.5% over the same period, so real home values fell.
The institutional forecasters see slowing rather than falling prices. Fannie Mae‘s Economic and Strategic Research (ESR) Group forecasts nominal price growth of 2.7% in 2026 and just 0.6% in 2027, with originations sliding about 11% in 2027. The MBA expects 2027 originations just under $2.0 trillion (down 5%), with price growth decelerating before gradual improvement in 2028.
Conference voices were darker. Stan Middleman of Freedom Mortgage expects declines of 5-10%, scaled back from his earlier 20-30% thesis, with more weakness in the Carolinas and parts of Florida. Chris Whalen of Whalen Global Advisors said more than half of U.S. homes fell in price over the past year and expects a correction through about 2028.
A structural housing correction is also why rate cuts offer limited relief: mortgage rates track long-term Treasury yields rather than the Fed funds rate, so the real price grind can persist through 2028 even as the headline index ticks up.
| Source | Price view | 2027 originations | Stance |
|---|---|---|---|
| MBA | Growth slows in 2027, improves gradually in 2028 | Just under $2.0T (-5%) | Moderate |
| Fannie Mae ESR | +2.7% (2026), +0.6% (2027) | About -11% | Moderate, softer |
| Stan Middleman | 5-10% decline | Not specified | Bearish |
| Chris Whalen | Correction through about 2028 | Not specified | Most bearish |
The disagreement is about depth and duration, not direction. Credit data supports the cautious camp at the margin. MBA’s delinquency rate stood at 4.37% at the end of Q2 2026, up about 44 basis points year on year but down 7 basis points from Q1, with about 0.67% of loans in foreclosure. Freddie Mac’s forecast and the latest Federal Housing Finance Agency (FHFA) reading were not available for comparison.
Why regions are diverging
The national average hides a split market:
- Firmer: Chicago +6.9%, New York about +4.8%, with Northeast and Midwest markets holding up
- Softer: Seattle -2.0%, Las Vegas -1.9%, Denver -1.2%, with several Western and Sunbelt markets weakening
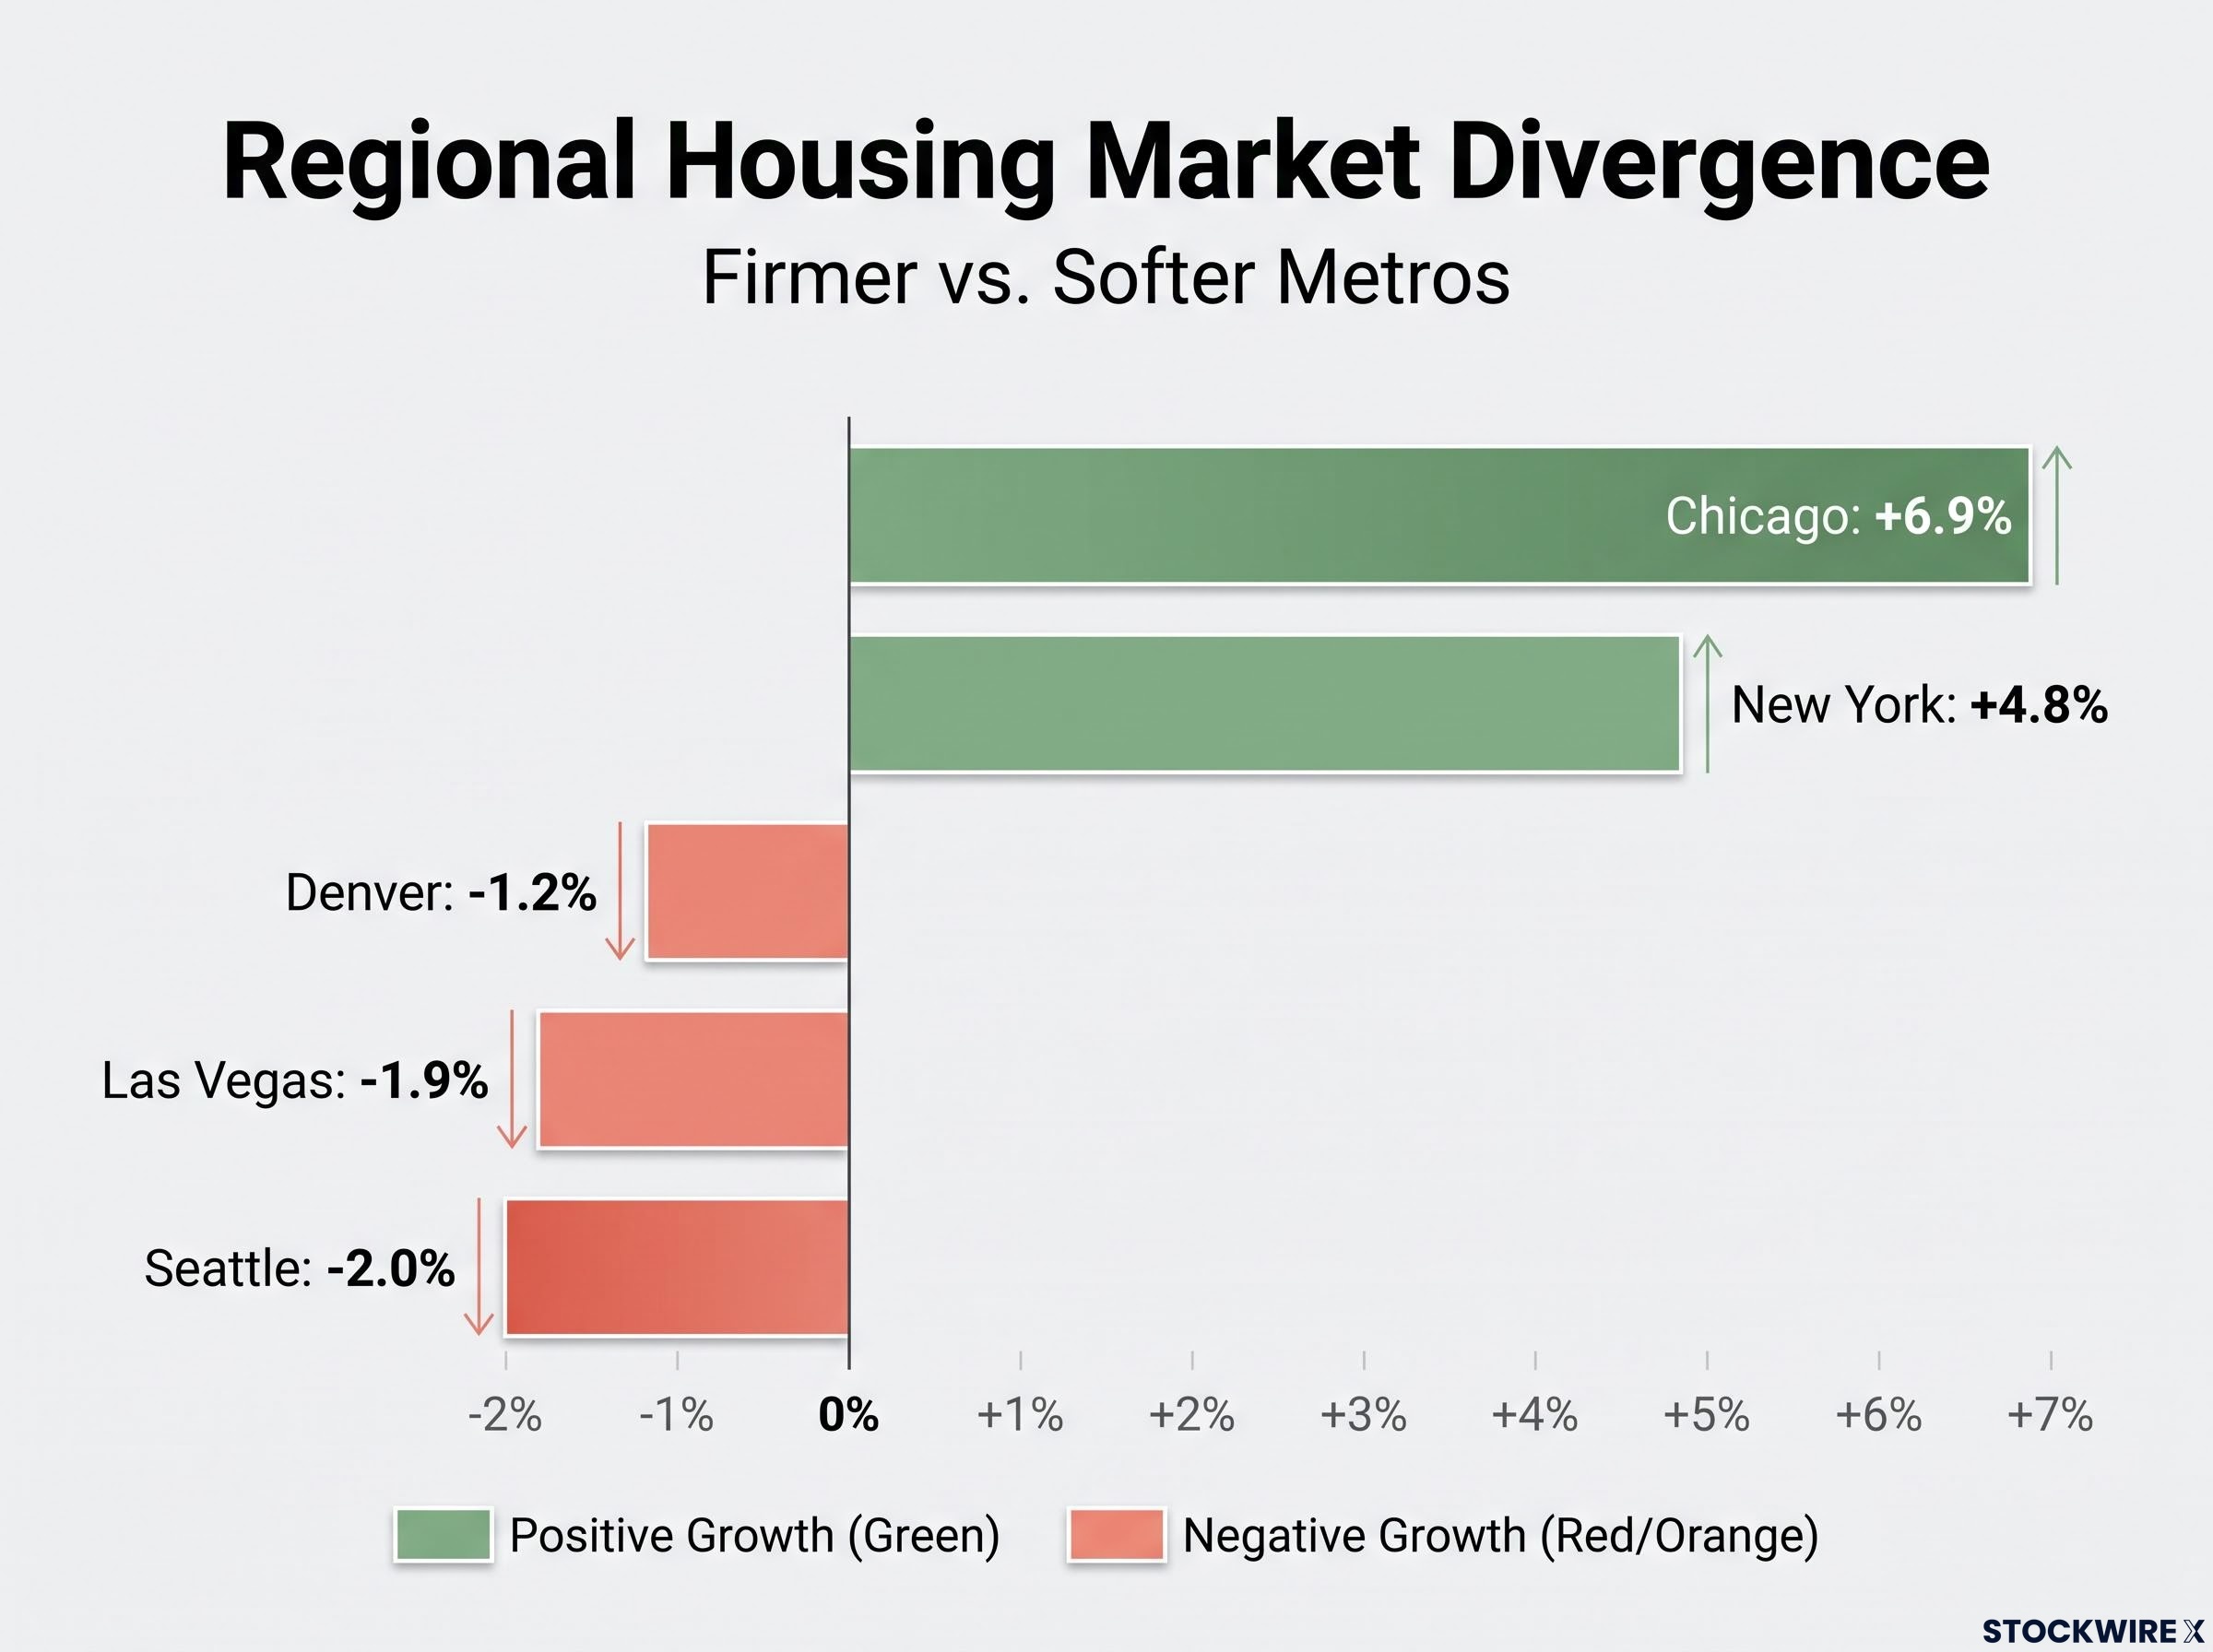
Conference participants described builders cutting prices and shifting unsold inventory into rentals, and they expect credit costs on rental properties to rise. If you own or plan to buy a home, your outcome depends far more on your metro than on any national headline.
Is replacement cost really a floor?
The floor and its limits Whalen’s Florida home cost about $800,000 but carries a $1.5 million replacement value, according to insurer Chubb. Rising labour, materials and land costs make a rapid national collapse less likely. The floor fails, though, where inventory piles up, jobs weaken, insurance becomes a problem or carrying costs become unaffordable.
That is why a 5-10% scenario reads as a credit-cost story rather than a collapse story.
When big ASX news breaks, our subscribers know first
Why low-coupon mortgages squeeze bank margins
The intuition is simple. A bank holding a 3% mortgage funded by money that now costs more is earning a thin or negative spread on that asset, and it cannot easily fix that.
How the mechanism works
- A bank holds fixed-rate mortgages or mortgage-backed securities (MBS) written when rates were low, in the 2.75%-3.35% range cited at the conference.
- Market rates rise, so newer assets yield more and the value of the old ones falls.
- If the securities are classified as available for sale (AFS), the loss flows through accumulated other comprehensive income (AOCI), a balance-sheet account that can reduce regulatory capital.
- If held to maturity (HTM), the loss generally stays out of earnings and capital, but the asset keeps earning a below-market coupon.
- Deposit and wholesale funding costs reprice faster than old asset yields, compressing net interest margin, the gap between what a bank earns on assets and pays on funding.
The HTM point The loss is not in earnings. It is still in the economics.
Whalen argued that Bank of America’s asset yield barely exceeds its funding cost before operating expenses, citing page 8 of its supplement. One conference attendee put liability costs above 3% against roughly 2% mortgages, figures that are informal and unverified. Asset manager GMO noted on 23 July 2026 that bank portfolios skew heavily to lower coupons and said it prefers current-coupon agency MBS.
What banks can and cannot do about it
Banks have several repair tools:
- Letting low-coupon securities mature and reinvesting the cash flows
- Shifting to floating-rate or shorter-duration assets
- Growing loans at current rates and gathering stable, cheaper deposits
- Hedging interest-rate exposure
They cannot convert a performing 3% mortgage into a 7% one without the borrower’s consent. Selling early locks in losses. The real dangers are deposit flight, forced sales and credit deterioration, which turned paper losses into liquidity crises during the 2022-2023 regional-bank stress. HTM accounting reduced the volatility in reported numbers, but it did not remove the liquidity risk.
The SVB stress test failure is a useful reminder that rate losses sitting outside a regulator’s scenario can still become liquidity events, particularly when long-duration securities meet concentrated uninsured deposits.
For anyone holding bank stocks, the headline unrealised-loss figure matters less than whether the bank might ever be forced to sell.
What Bank of America’s Q3 shows: large losses, improving margins
The number that grabs attention first is the loss. As at 30 September, Bank of America carried about $109 billion in unrealised securities losses, up from about $85 billion at 30 June. Most of it sits in HTM securities.
Read further and the same report shows improvement:
- Net interest income: $16.4 billion, up 8% year on year
- Net interest yield: 2.16%, up 15 basis points year on year and 8 basis points sequentially
- Loans: up $34 billion to about $1.25 trillion
- AFS AOCI hit to CET1 (the core measure of bank capital): about $1.8 billion, partly offset by hedging
- Provision for credit losses: $1.27 billion, down 2%
Two numbers, one balance sheet $109 billion in unrealised losses alongside a net interest yield that rose to 2.16%.
These figures coexist rather than cancel out. Fixed-rate assets rolling off and repricing higher, plus loan and deposit growth, are doing the repair work while the duration loss stays parked in HTM. The provision decline also cuts against the conference expectation that credit costs are turning higher.
One bank is limited evidence. Comparable figures for other large banks and the FDIC’s latest Quarterly Banking Profile were not available. The read you can take from this report is that margin pressure looks like a slow-burn drag rather than an acute threat. Rising unemployment, which would lift provisions and test deposits, is the variable that would change that.
Regional bank funding pressure adds a second layer to the story, because unrealised securities losses above $300 billion matter far more when cheap deposits are being pulled toward stablecoins and other higher-yielding alternatives.
UWM versus Annaly: two ways to be exposed to the same mortgage market
Banks absorb mortgage stress through duration. A lender and a mortgage REIT absorb it through entirely different channels.
UWM: volume is not the same as profit
UWM Holdings reported Q2 2026 originations of $39.7 billion, down from $44.9 billion in Q1, on revenue of $888.0 million. Adjusted EBITDA (earnings before interest, tax, depreciation and amortisation, excluding certain items) was $185.9 million. The bottom line still showed a net loss of $451.9 million.
The UWM gap $39.7 billion in volume and a gain-on-sale margin of about 133 basis points still produced a $451.9 million net loss.
Hedging and balance-sheet pressure overwhelmed operating profit. The board suspended the regular dividend, and the company secured a $2.05 billion equity investment from Oaktree Capital Management and SFS Group Capital. It reported about $1.3 billion in liquidity and nonfunding debt-to-equity of 6.13. Whalen said he sees no compelling bull case and would not buy, citing what he described as a $165 million dividend owed to Oaktree and about $1.5 billion needed to exit that investor.
Mortgage industry consolidation is the corridor talk behind UWM’s struggles, with 7.40% rates squeezing volumes and margins while many lenders hope to sell and most mortgage stocks sit near 52-week lows.
Annaly: income with visible leverage
Annaly Capital Management reported Q2 book value of $20.15 per share, an economic return of 5.5% and a $0.75 quarterly dividend. Its 30 June close of $22.36 implied about 1.11x book, with GAAP leverage of 7.4x and economic leverage of 5.6x.
Whalen calls Annaly his largest position and an income holding, notes it is down about 20% from its highs and says he may add below book. That is his opinion, not a low-risk label. Unlike a bank carrying HTM assets at cost, a REIT marks its portfolio to market, and past drawdowns show book value falling quickly when spreads widen or repo funding tightens.
| Institution | Main earnings driver | Biggest exposure | Bear case |
|---|---|---|---|
| UWM | Origination volume, gain-on-sale margins | Volume, hedging, debt financing | Weak 2027 originations, leverage, hedging losses |
| Large banks | Net interest income, deposits | Duration losses, funding costs | Forced sales, rising unemployment lifting provisions |
| Annaly | Agency MBS net spread | Mortgage spreads, repo, leverage | Wider spreads or repo stress cutting book value |
When you assess any mortgage name, ask first whether it makes money on volume, net interest or spread. That tells you which risk will reach it first.
What to watch as the adjustment plays out, and what it does not settle
The evidence points to slowing nominal growth, falling real prices, weaker 2027 originations and rising credit costs. It does not point to a national crash.
Three variables will show whether the grind deepens:
- Rental-property credit costs and later-stage delinquencies, the first place conference participants expect damage
- Bank deposit and funding costs, which decide whether HTM losses stay on paper
- Mortgage spreads and origination volumes, which drive Annaly’s book value and UWM’s revenue
The depth and duration of the adjustment remain unresolved. Missing Freddie Mac, FHFA and FDIC data leave the picture incomplete, so treat every forecast here as one view among several.
This article is for informational purposes only and should not be considered financial advice. Investors should conduct their own research and consult with financial professionals before making investment decisions. Past performance does not guarantee future results, and forecasts are subject to market conditions and various risk factors.