Bank of America’s Michael Hartnett is telling clients to play defence for the next three to four weeks. He is also hoping the Federal Reserve raises rates on 28 October. On the surface those two positions contradict each other.
They only conflict if you assume a rate hike is automatically bad for markets. Hartnett’s argument is that a well-timed Fed hike could do the opposite: pull long-term Treasury yields lower and ease pressure on risk assets.
The backdrop is tense. Real yields, meaning bond yields after subtracting expected inflation, sit near 3%. Inflation has run above the Fed’s 2% target for 66 consecutive months, and September’s consumer price index (CPI) came in at 3.7%. BofA’s Bull & Bear Indicator has just slipped to 7.4 from 8.1.
The original BofA client note is not publicly available, so the figures here come from published coverage of it. Here is the logic behind the call, the points where it could break, and how investor money is actually behaving compared with the advice.
Why would a Fed hike push long-term yields down?
Picture the screen on 28 October: the Fed lifts its overnight rate, and the 10-year Treasury yield falls. BofA expects long-end yields to drop a further 20 basis points after a hike (a basis point is one hundredth of a percentage point).
That sounds backwards. It makes sense once you separate short rates, which the Fed controls directly, from long rates, which investors set based on what they expect over many years. Hartnett’s case runs through four steps:
- Credibility: a hike signals the Fed will accept weaker demand to contain inflation.
- Inflation expectations: if investors expect lower future inflation, the inflation component built into long bonds shrinks.
- Term premium: the term premium is the extra return investors demand for locking money up in long-dated bonds. If the Fed looks in control, that compensation can fall.
- Curve dynamics: short-dated yields rise mechanically, but the long end can fall if the drop in inflation expectations and term premium outweighs the rise in expected short rates.
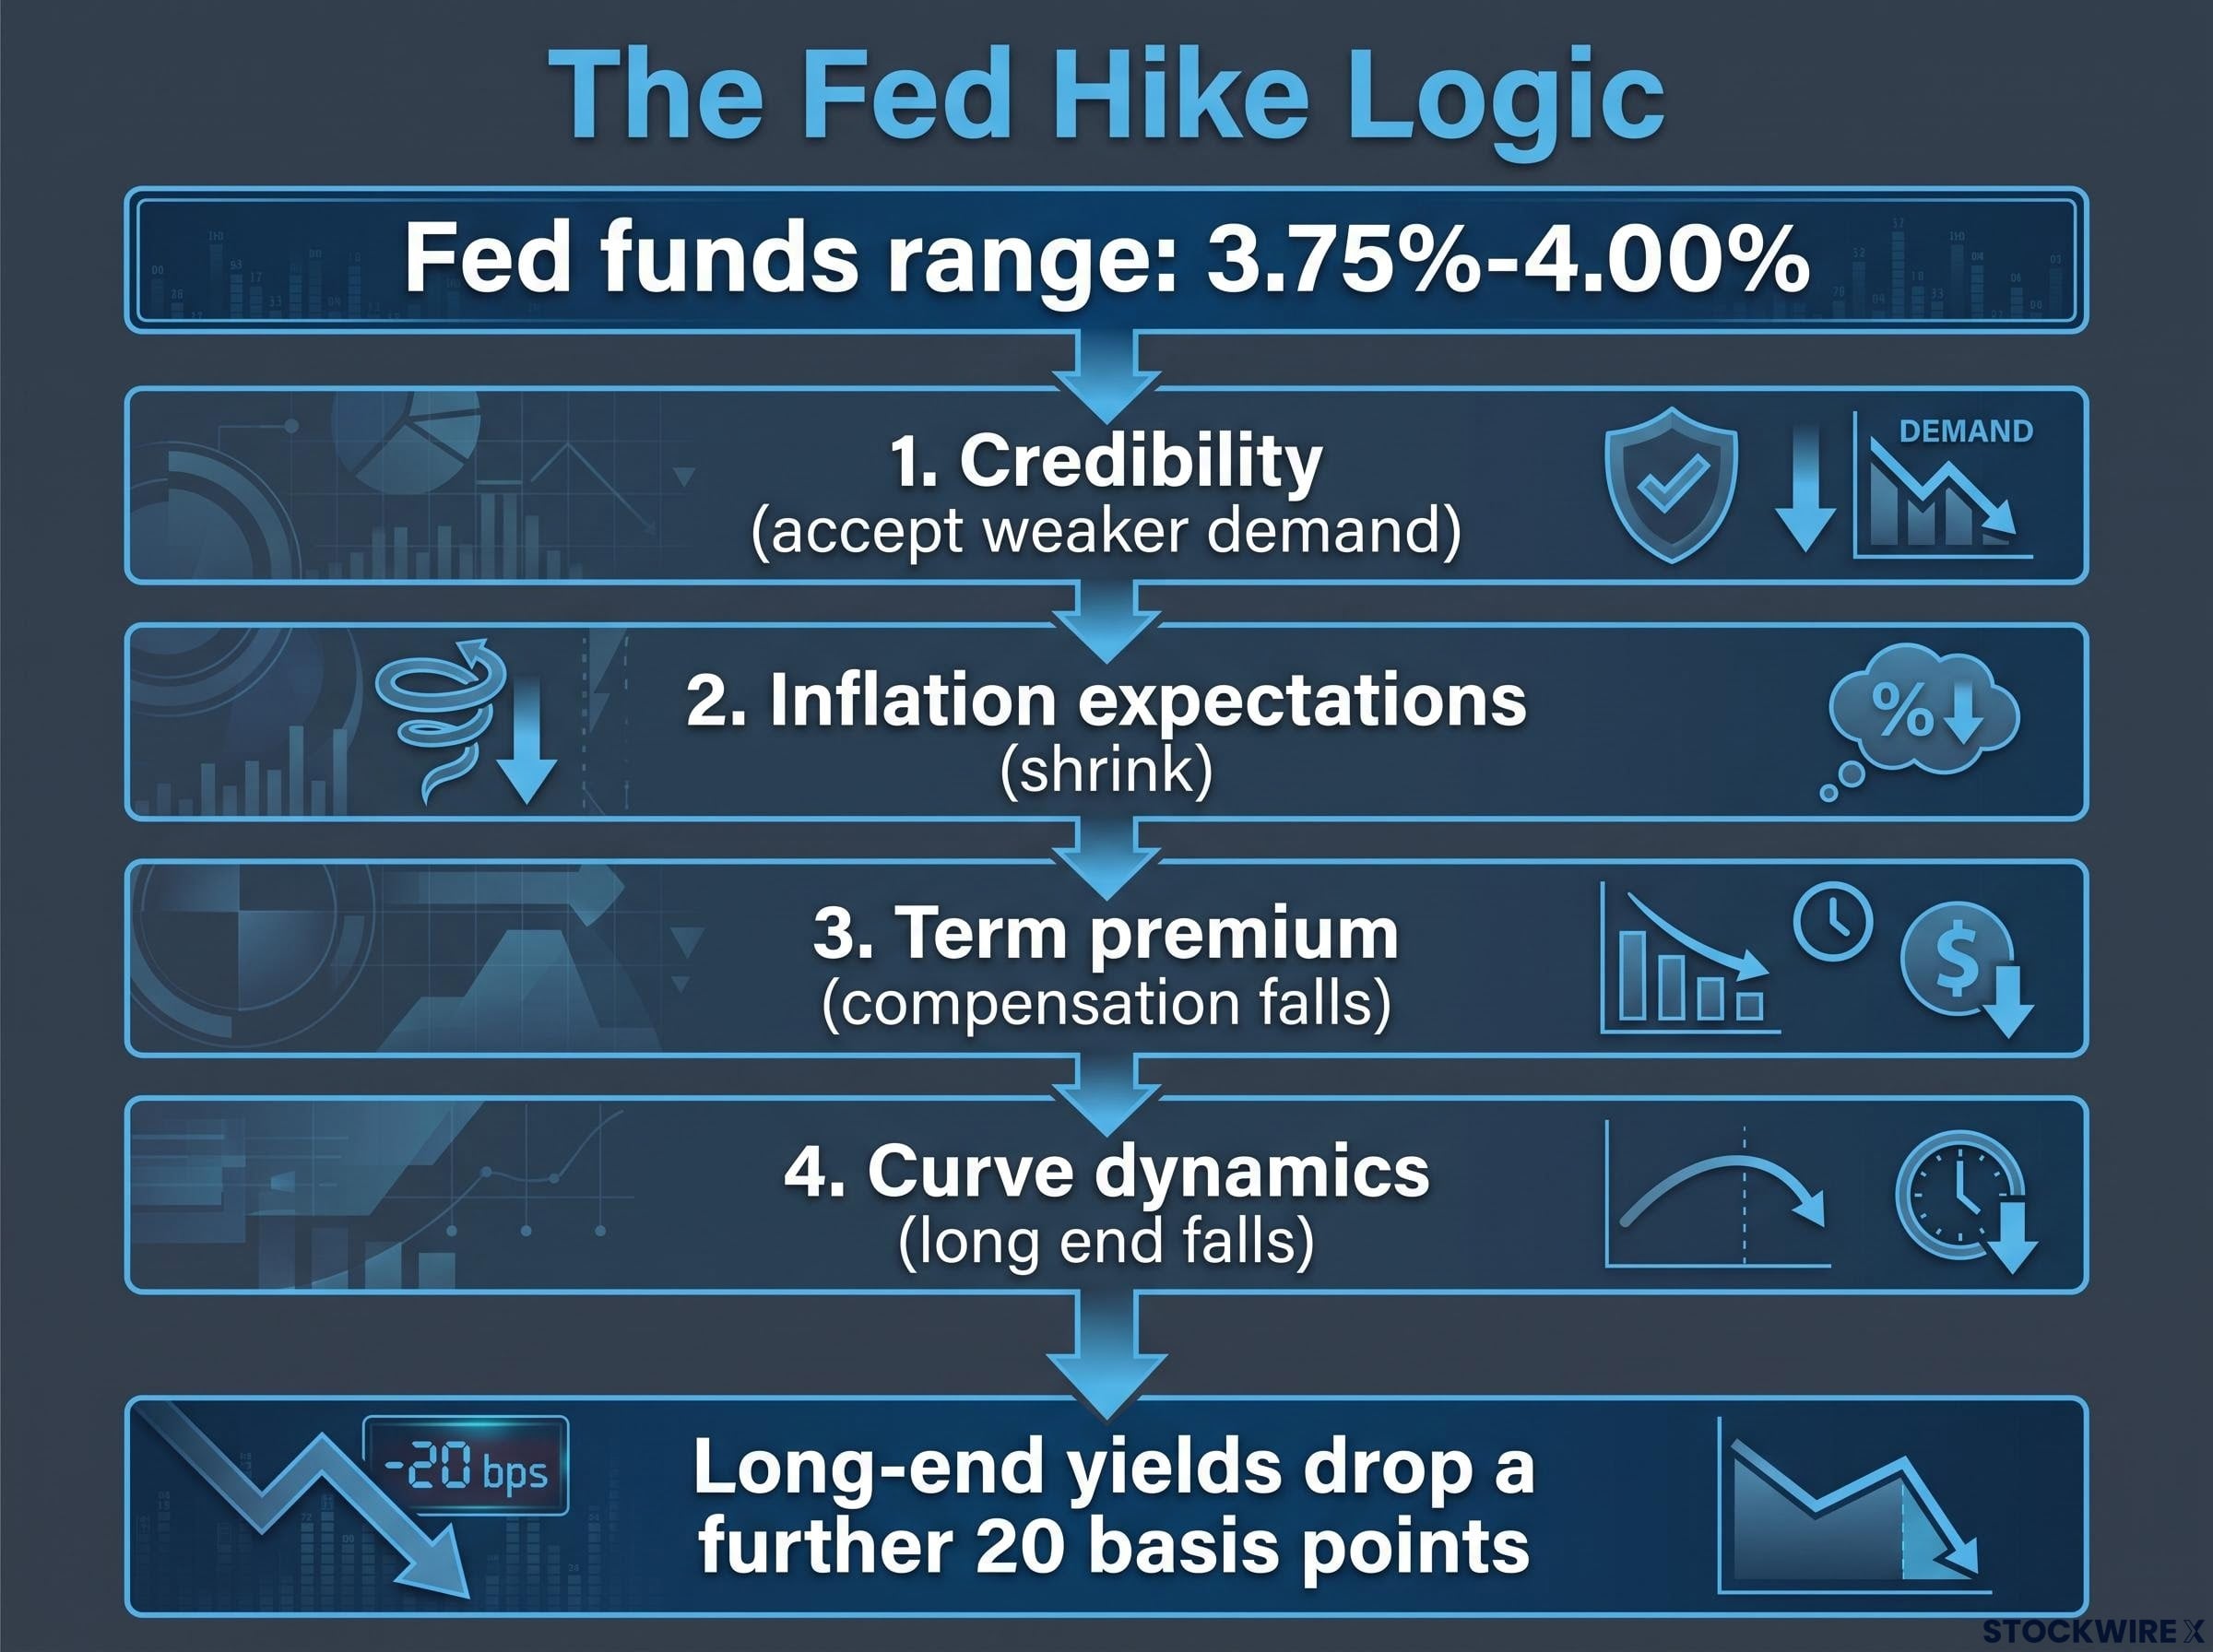
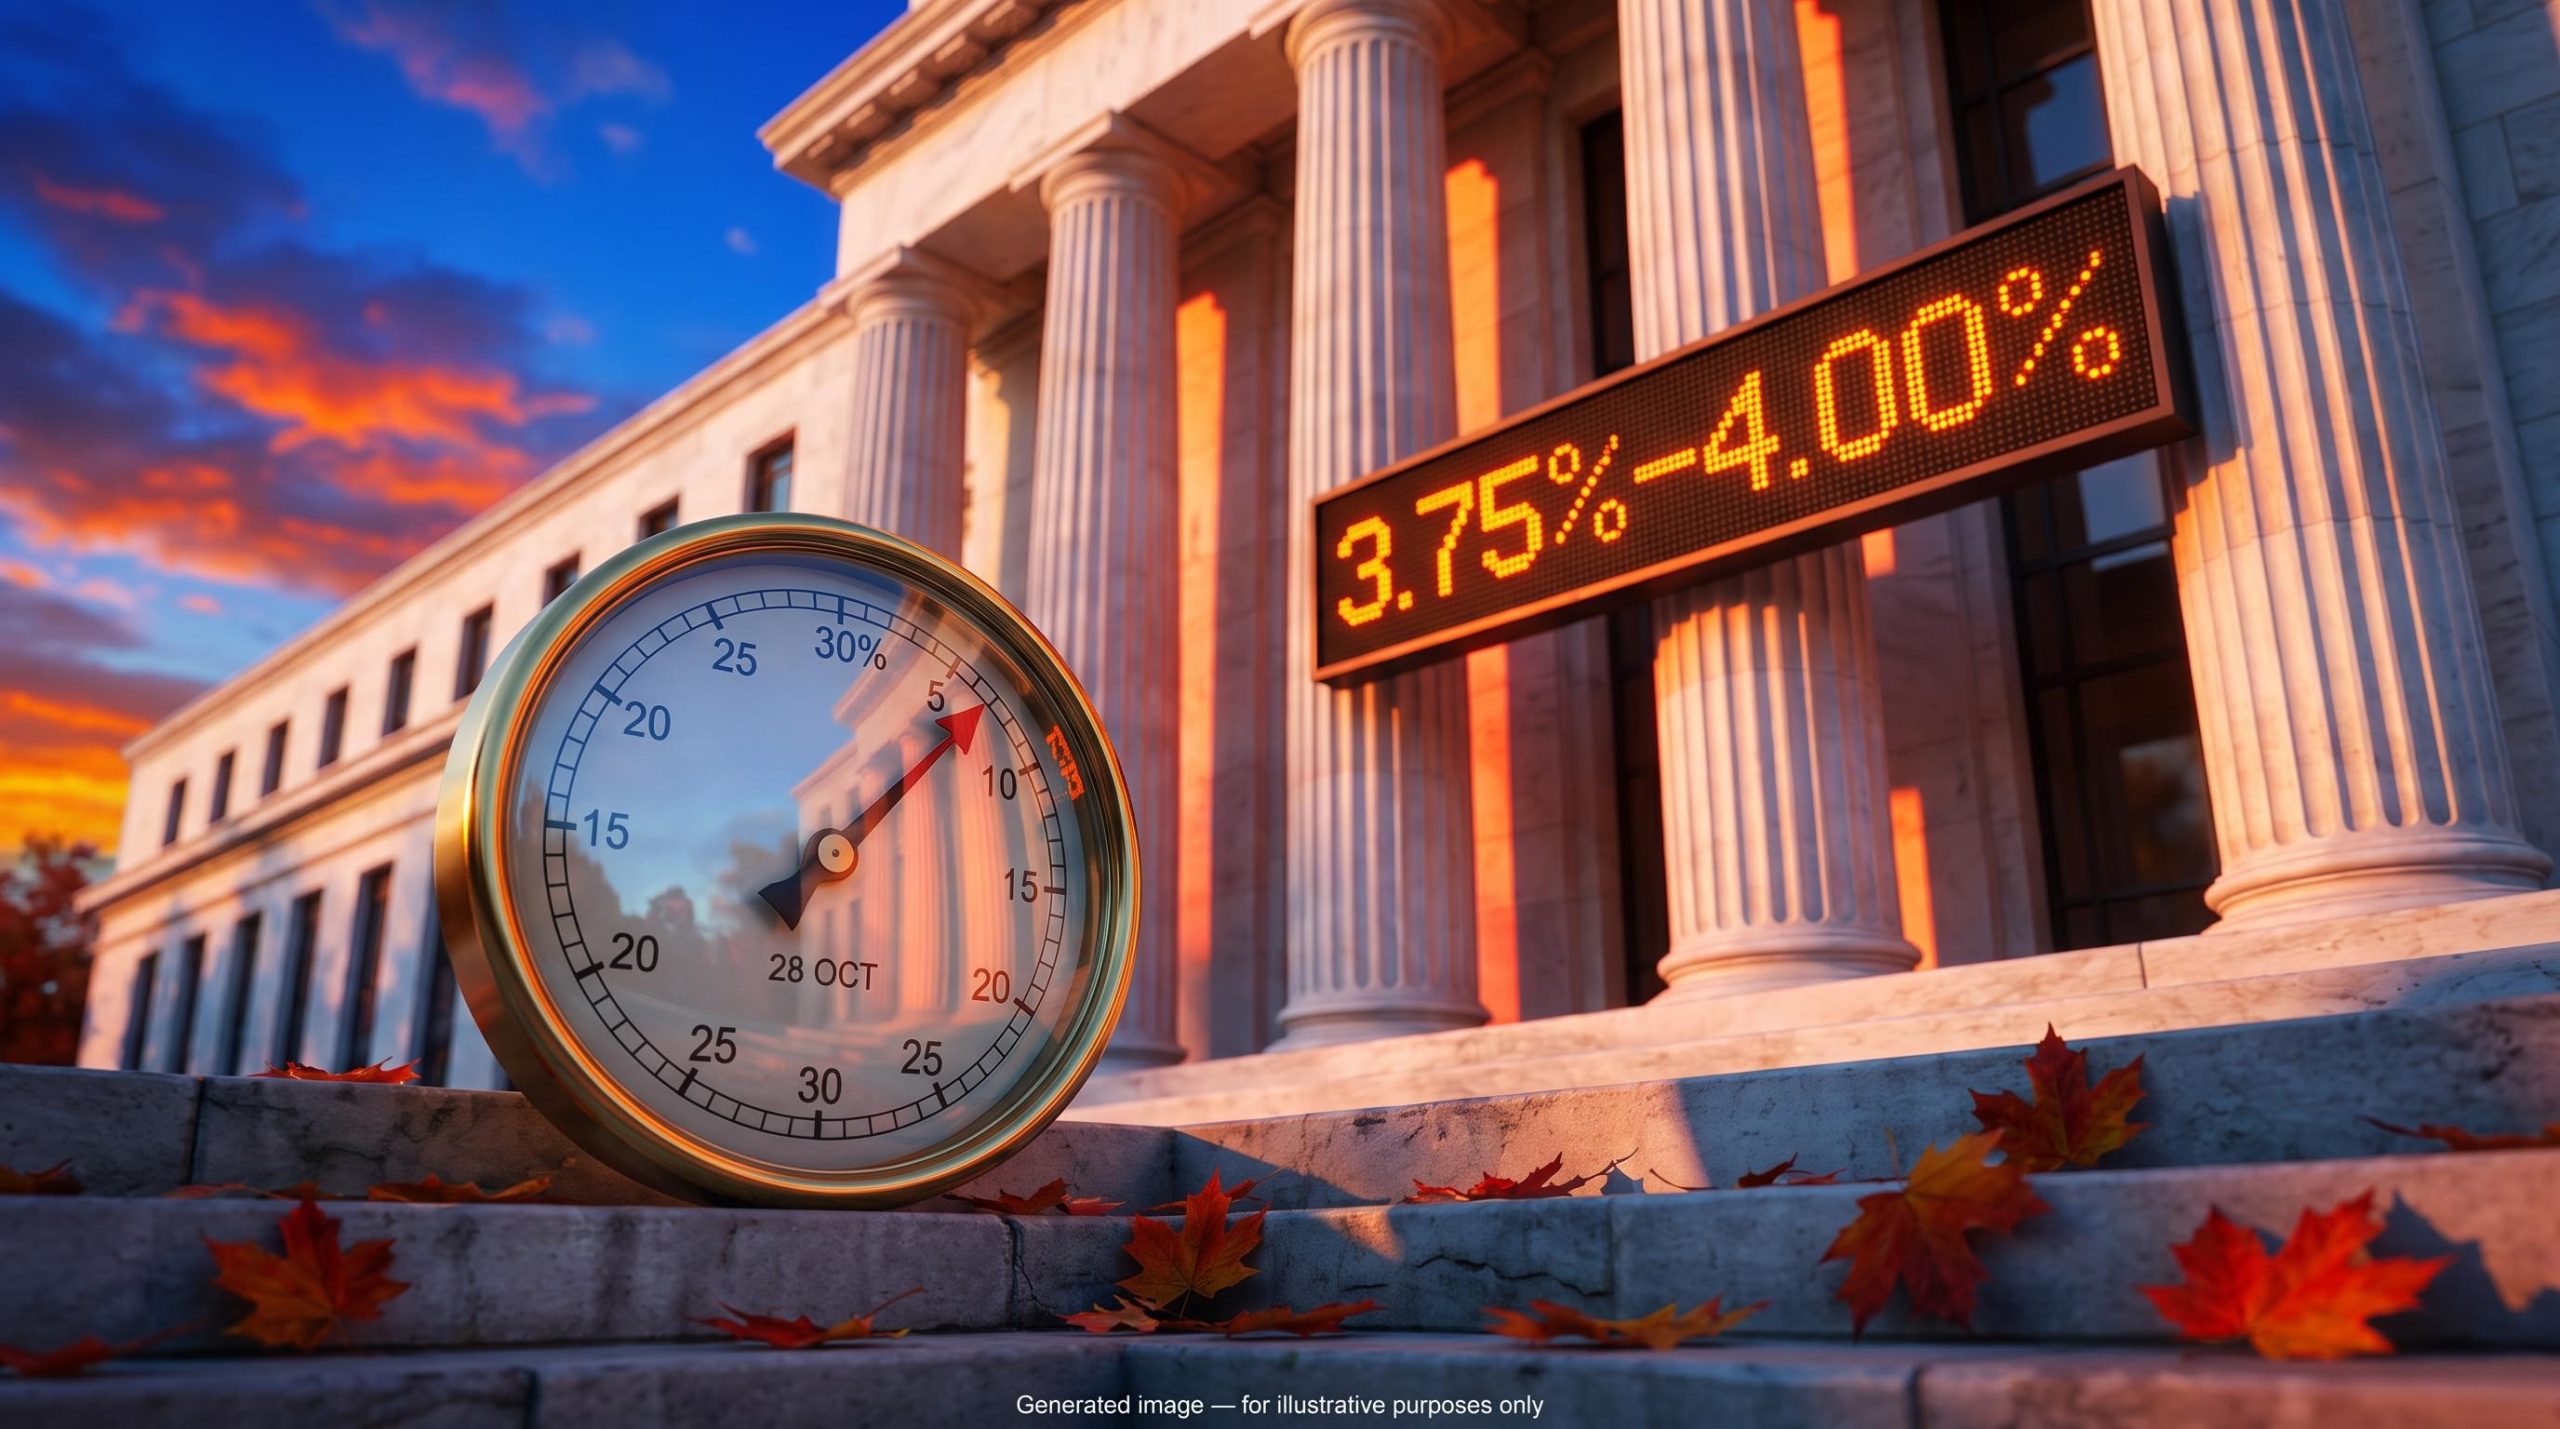
The current numbers explain why the argument has traction. The fed funds range sits at 3.75%-4.00% after the 16 September hike. September CPI beat the 3.6% forecast, while core inflation, which strips out food and energy, rose to 2.6%. DZ Bank estimates the 10-year term premium at about 91 basis points, the highest since 2014.
BofA’s rates team adds the decisive piece: yields have climbed mainly on stronger growth and a higher term premium, not on a repricing of the expected policy path.
The rise in long-end yields is largely a term premium story driven by fiscal risk and heavy Treasury supply, which is why the Fed is not automatically forced to respond with a hike of its own.
The core idea: If the term premium is driving long yields, a credibility shock from the Fed may matter more than the mechanical effect of a higher overnight rate.
The thesis is conditional. A hike has to be read as a limited, credible pre-emptive move, not the opening of an aggressive tightening campaign. If you hold long-duration bonds or rate-sensitive shares, the question that matters is not whether the Fed hikes, but whether markets read the move as credibility or as proof that inflation is entrenched.
What the market is pricing
Futures markets put the odds of an October hike at roughly 37%-47%, depending on the source and timestamp, up from about 22% before the CPI release. In several readings a hold remained the more likely outcome. The market has moved toward Hartnett’s view, but it has not adopted it.
When big ASX news breaks, our subscribers know first
What the Bull & Bear reset and the AI credit strain tell you about the next month
If a hike could help, why stay defensive? The answer builds from two places: a sentiment gauge that exited sell territory quietly, and credit markets that have been flashing stress for months.
The indicator reset
The Bull & Bear Indicator measures how crowded and optimistic investor positioning has become. Its fall to 7.4 ended the contrarian sell signal triggered on 26 May, without the drawdown that usually follows.
| Indicator | Reading | Context |
|---|---|---|
| S&P 500 since 26 May | +3% | Rose despite the sell signal |
| Nasdaq 100 since 26 May | -0.2% | Tech flat over the period |
| High-yield bonds since 26 May | -4.1% | Credit weakened as equities rose |
| Oracle five-year CDS | Near 300 bp | 2032 bonds near 78 cents, yielding above 16% |
| CoreWeave five-year CDS | Above 1,100 bp | Nearly $50 billion of debt |
| Private equity and BDC ETFs | Back at 2026 lows | Stress among AI lenders |
By BofA’s count, the S&P 500 fell about 3% over two months on average across 16 prior sell signals since 2002 (other summaries count 17). The signal is probabilistic, so ending early does not mean the caution was wrong. The more telling detail is that high-yield losses alongside a rising S&P 500 suggest credit was signalling stress before equities, which is why financing conditions deserve as much of your attention as index levels.
Where AI credit is cracking
Credit default swaps (CDS) are contracts that pay out if a borrower defaults; their price rises as default fears grow. Oracle’s CDS climbed toward 300 basis points, while CoreWeave’s sits above 1,100. The stress is building for four reasons:
- Capex ahead of cash flow: data-centre costs exceed many sponsors’ free cash flow, with tenant revenue often years away.
- Concentration: banks have reportedly sought to offload AI loans that breach single-borrower limits.
- Interest costs: hotter inflation raises debt-service bills while returns remain unproven.
- Cash-flow timing: some large contracts pay substantially only in later years.
This is not the telecom bust repeated. Today’s largest hyperscalers carry far stronger cash flow and investment-grade funding access, so the pressure sits with leveraged intermediaries and specialist operators. BofA’s October fund manager survey reflects that distinction: 45% expect an AI bubble in 2027, but only 11% see a hyperscaler credit event, behind a disorderly rise in bond yields (31%) and an AI bubble (23%). Semiconductor prices are the 2027 item to watch, with a rollover pointing to tighter AI credit.
Investors exploring the AI lender risk further can read our deep-dive into CoreWeave’s bond stress, which examines how its 2032 notes signalled trouble before the shares did.
Which trades does BofA favour, and where could they fail?
Against that backdrop, Hartnett’s positioning leans toward assets that benefit if yields have peaked. Each idea has a logic, and each has a specific weak point.
| Idea | BofA rationale | Key risk |
|---|---|---|
| Add small caps | Peak-yield beneficiary | Refinancing needs; wider credit spreads could swamp gains |
| Add REITs | Peak-yield beneficiary | Expensive refinancing and weaker property values |
| Add consumer discretionary | Heavily underweight, contrarian upside | A consumer slowdown would validate the bears |
| Avoid tech | Crowded positioning, AI credit strain | Momentum can persist longer than expected |
| Trim bond and China underweights | Yields may fall; China talks ahead | Supply keeps term premium high; post-midterm disputes |
| Long-term gold, commodities, EM | Structural bull case | High real yields hurt gold; EM exposed to the dollar |
Positioning makes the contrarian case vivid. Fund managers sit a net 34% underweight consumer discretionary, the most since July 2008, and a net 37% overweight tech, the highest since August 2020, with cash at about 3.9%. Crowding cuts both ways: if long yields fall, underweight sectors could rotate sharply, but if supply holds yields up, the crowding can persist. Treat these as conditional bets, not forecasts.
Record semiconductor crowding helps explain the tech overweight, with 80% of managers naming long semiconductors the most crowded trade in the June survey, a position now exposed to inflation as a tail risk.
The China call also carries dates. Xi Jinping and Donald Trump are scheduled to meet at APEC in Shenzhen on 18-19 November and the G20 in Miami on 14-15 December.
Who disagrees with the thesis
The central call has credible critics. Macquarie’s Thierry Wizman said on 13 October that faster inflation alone was unlikely to prompt an October hike.
UBS regards an election-eve hike as “politically untenable,” which makes a hold more likely.
RBC Wealth Management argues that debt, deficits and bond supply could keep term premiums elevated whatever the Fed does. Strategists polled by Reuters see the 10-year at 5.00% by year-end, though that group has wrongly expected lower yields for nine months.
Are investors following the advice? What the latest fund flows show
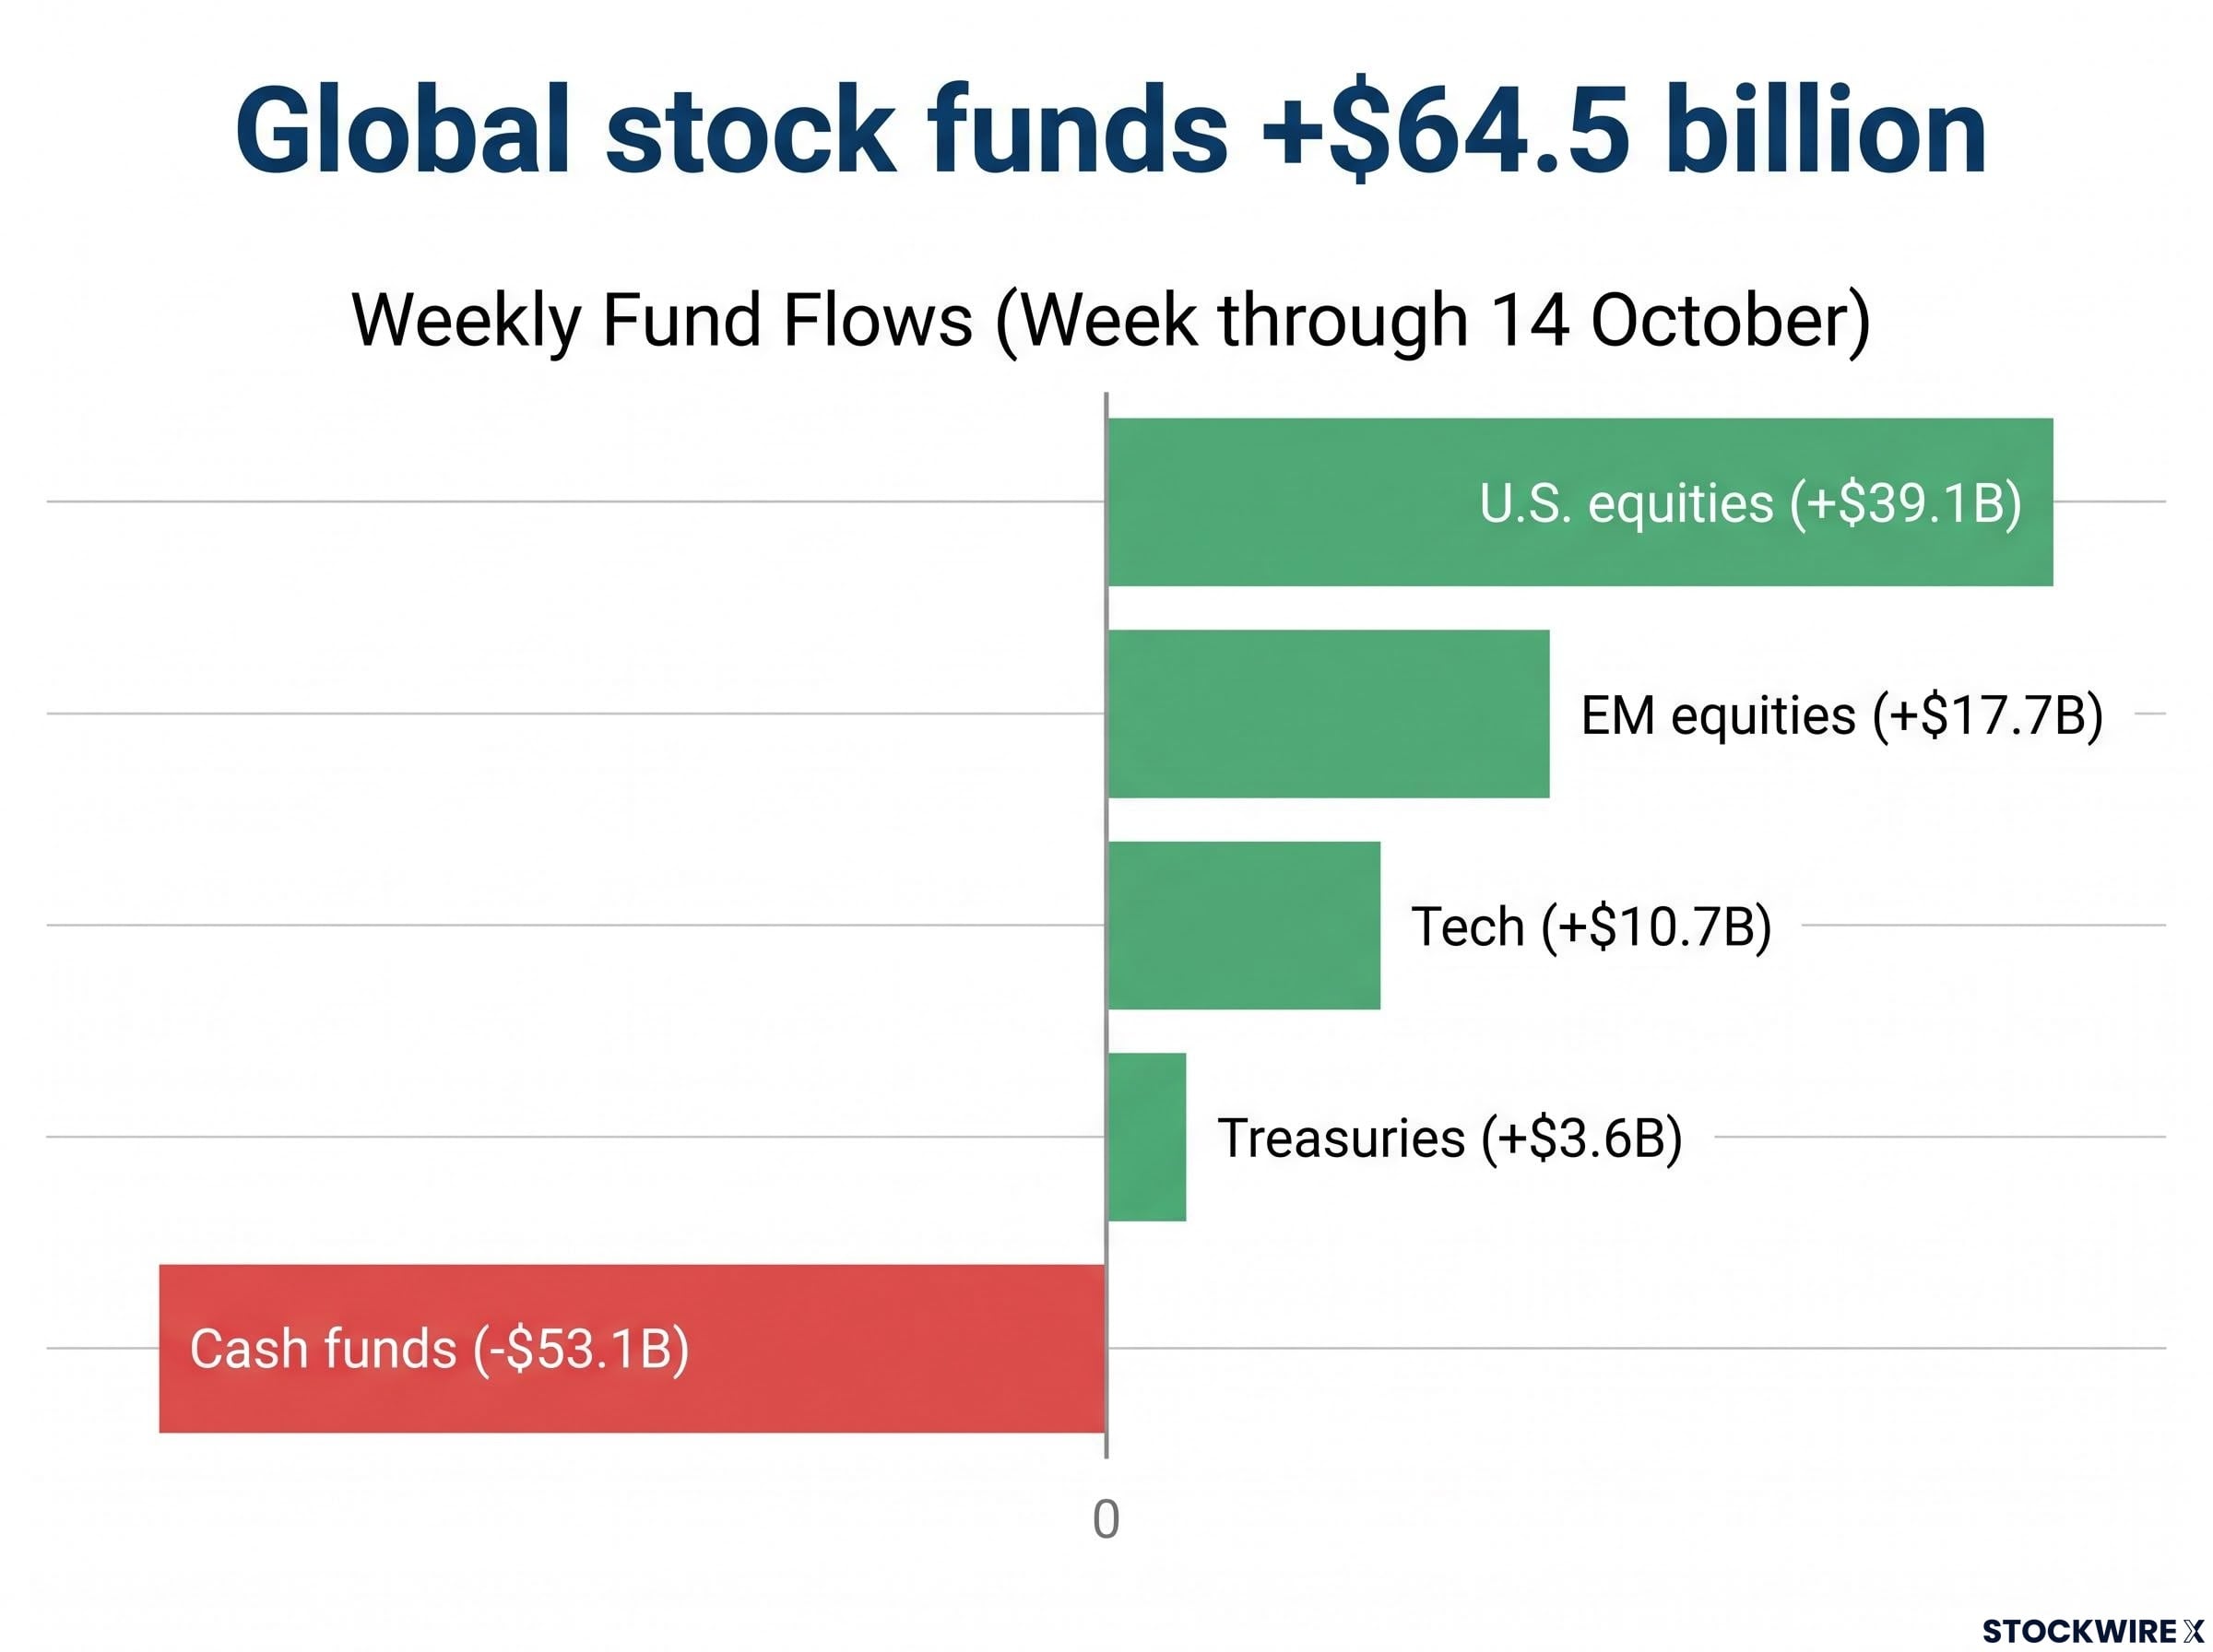
The gap between BofA’s advice and actual money is wide. In the week through 14 October, global stock funds took in about $64.5 billion, pacing toward a record $1.3 trillion for the year.
| Asset | Weekly flow | Note |
|---|---|---|
| U.S. equities | +$39.1B | Annualising to a record |
| EM equities | +$17.7B | Third week of inflows |
| Tech | +$10.7B | Led sector inflows |
| Financials / Consumer | -$1.4B / -$600M | Largest sector outflows |
| Treasuries | +$3.6B | 16th straight weekly inflow |
| High yield | -$900M | Third straight outflow |
| Cash funds | -$53.1B | Money moving into risk |
| Crypto / Gold | -$600M / +$100M | Gold figures conflict across sources |
Strong tech buying alongside BofA’s avoid call tells you money is leaning into the crowded trade, which raises the stakes if the Fed outcome or AI credit news disappoints. Three signals do line up with the caution:
- Treasury inflows on a 16-week run suggest steady demand for safety.
- High-yield outflows echo the credit stress visible since May.
- Cash outflows leave less dry powder to cushion a sell-off.
A separate EPFR-based report cited $1.14 billion of precious-metals outflows, but it remains unverified and likely uses a different fund universe, so the BofA figures are the firmer guide. One week of flows can reflect hedging or passive allocation, so use it to benchmark your own positioning, not to time trades.
What the Oct. 28 decision changes, and what it does not
Hartnett’s call is conditional and defensive in the near term. A hike alone does not deliver lower long yields; the market has to read it as credibility rather than a sign inflation is entrenched.
The Federal Reserve FOMC calendar confirms the 27-28 October meeting as the next decision point, and the accompanying September statement and minutes are the primary record of why the range now sits at 3.75%-4.00%.
Five variables will decide which reading wins:
- The Fed’s 28 October decision and its messaging.
- Long-end yields and the term premium.
- Oracle and CoreWeave credit spreads.
- Semiconductor prices into 2027.
- The post-midterm U.S.-China meetings.
If those break favourably, crowded underweights could rotate fast. If supply or AI credit stress dominate, the defensive stance looks prescient. Either way, your decision should rest on which of those conditions you see unfolding, not on the hike headline itself.
This article is for informational purposes only and should not be considered financial advice. Investors should conduct their own research and consult with financial professionals before making investment decisions. Past performance does not guarantee future results. Financial projections are subject to market conditions and various risk factors, and forward-looking statements are speculative and subject to change.