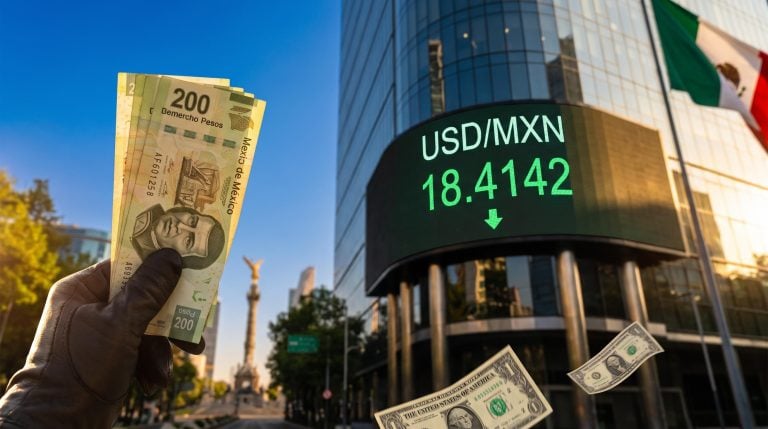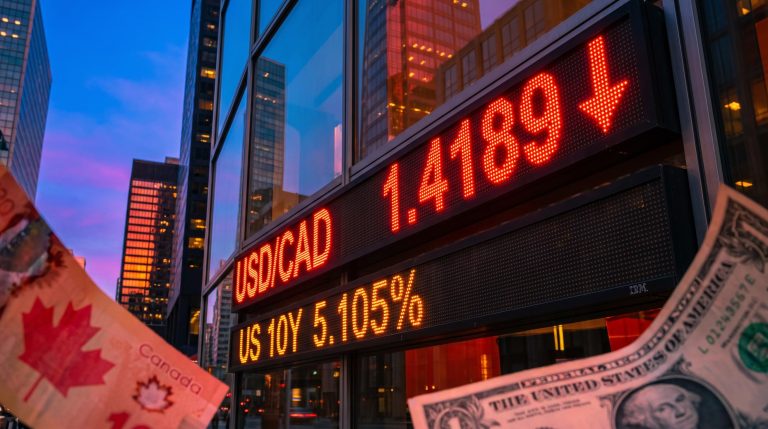
US Treasuries rallied this week against everything the inflation data seemed to demand. September consumer prices came in hot, wholesale inflation hit its fastest annual pace since late 2022, and Brent crude sat above $100. Yet bond buyers stepped in near multiyear yield highs, and Bloomberg reported that the market had recovered most of its post-CPI losses by the close on 14 October.
The move cuts against the dominant trade of 2026. Yields had been climbing since the US-Iran war began in late February, and bond prices had been sliding since around late June.
Earlier this month the 10-year yield touched 5.364%, its highest level in 24 years, according to Reuters.
This piece covers the signals bond buyers are weighting above the inflation prints, and the specific readings that would prove them wrong.
Why are bonds buying a hot inflation print instead of selling it?
The first reaction went the way the rulebook says it should. When the Consumer Price Index (CPI), the government’s main gauge of the prices households pay, landed on Wednesday, the 2-year yield jumped 12.7 basis points. A basis point is one hundredth of a percentage point. The 10-year climbed to 5.29% from 5.19%, according to Investor’s Business Daily.
That is the hawkish reflex: hotter inflation, more Fed hikes, higher yields.
The 10-year touched its highest level in 24 years earlier this month, and 5% Treasury yields have already forced equity multiples, credit spreads and mortgage costs to reprice in sequence.
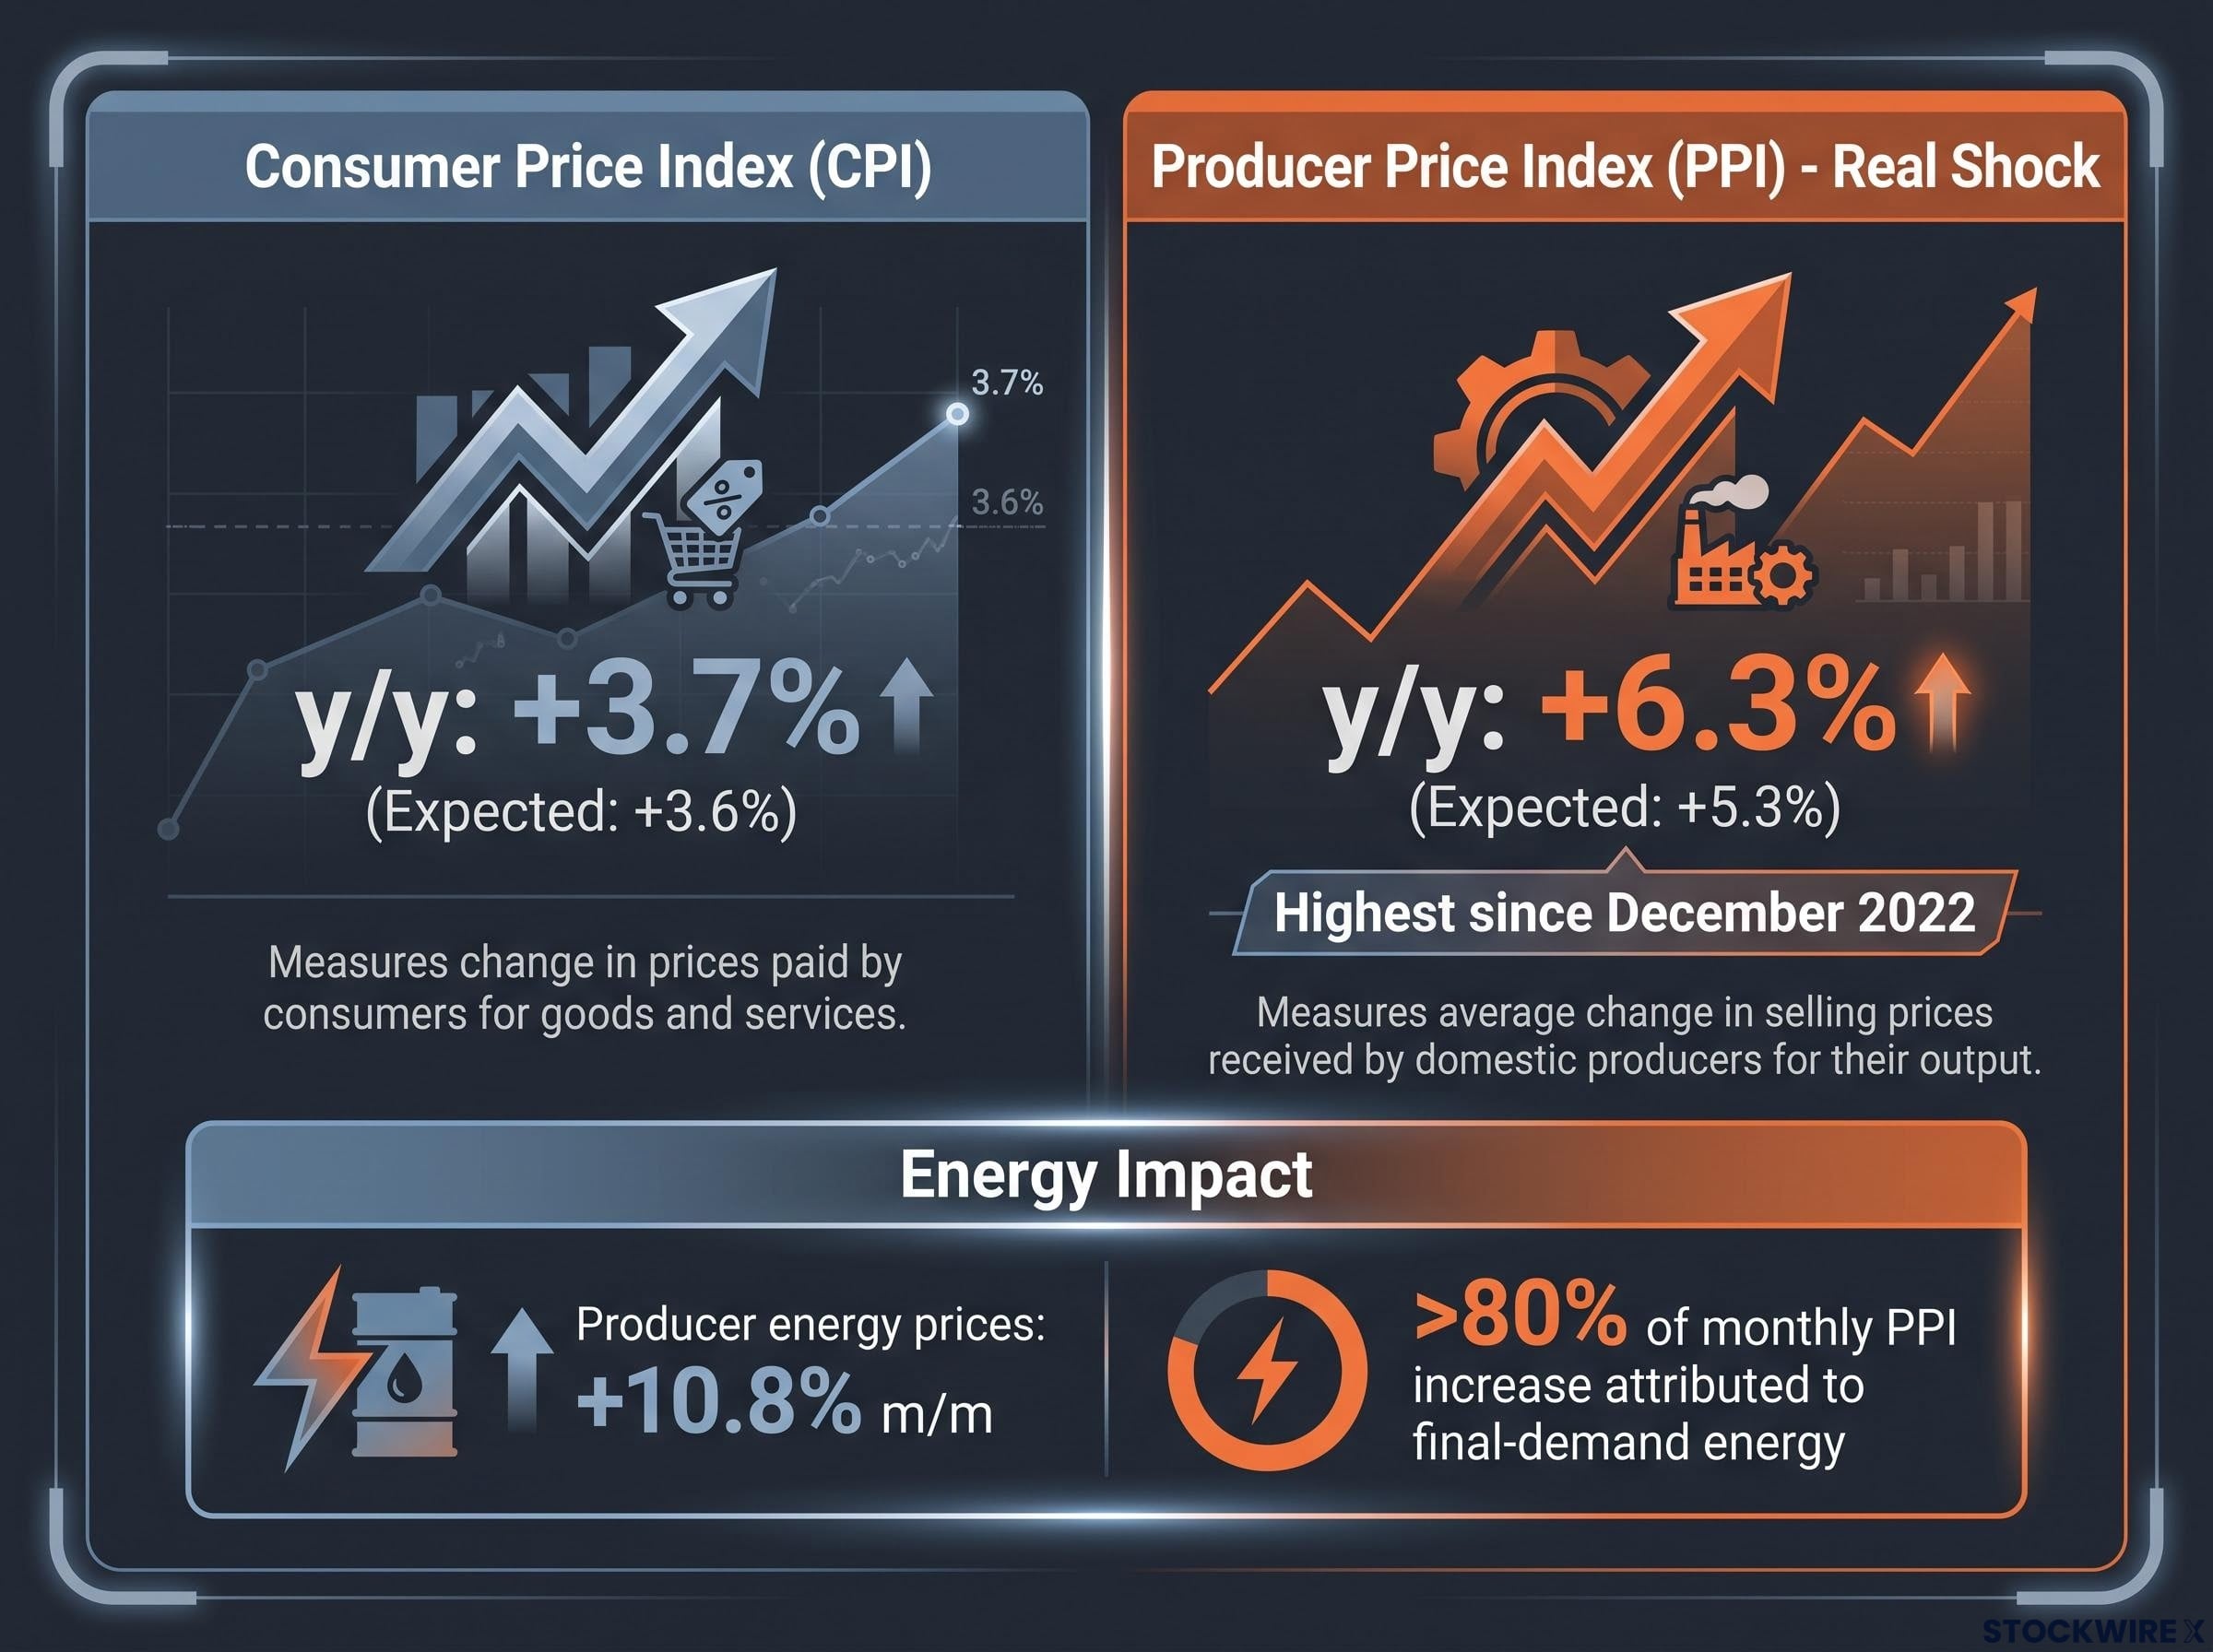
Look closer and the CPI surprise was thin. The Producer Price Index (PPI), which tracks the prices businesses receive for goods and services, was the real shock when it arrived on Thursday.
| Measure | Reported | Expected | Note |
|---|---|---|---|
| CPI m/m | +0.6% | +0.6% | In line |
| CPI y/y | +3.7% | +3.6% | Marginally hot |
| Core CPI m/m | +0.3% | +0.2% | Core y/y 2.6% vs 2.5% |
| PPI y/y | 6.3% | 5.3% | Highest since December 2022; m/m +1.3% (consensus n/a) |
Energy prices at the producer level jumped 10.8% in a single month. Core PPI rose 0.7%, its largest monthly gain since March 2022.
Where the PPI surge came from More than 80% of the monthly PPI increase was attributed to final-demand energy.
That makes the print a cost shock rather than evidence of broad pricing power. Core goods prices barely moved, so the damage is showing up mainly in squeezed business margins.
Then the reversal landed. As stocks sold off, buyers returned and yields fell at both the long end and the front end, pushing the rally against the edge of its late-June downtrend. No authoritative closing yields for Thursday were available at publication.
The front end, meaning short-dated bonds like the 2-year, is the part of the curve most sensitive to Fed expectations. When it rallies alongside long bonds, you should read it as the market questioning how far the Fed will really go, not simply hiding in safe assets.
What are consumers and the economy signalling beneath the headline numbers?
On the surface, September spending looked strong. Retail sales rose 0.8%, well ahead of the 0.3% forecast, after August was revised up to 1.3%, according to Reuters and the US Census Bureau.
Headline versus core Retail sales: +0.8%. Core retail sales (excluding autos, gasoline, building materials and food services): +0.1%, against +0.3% expected.
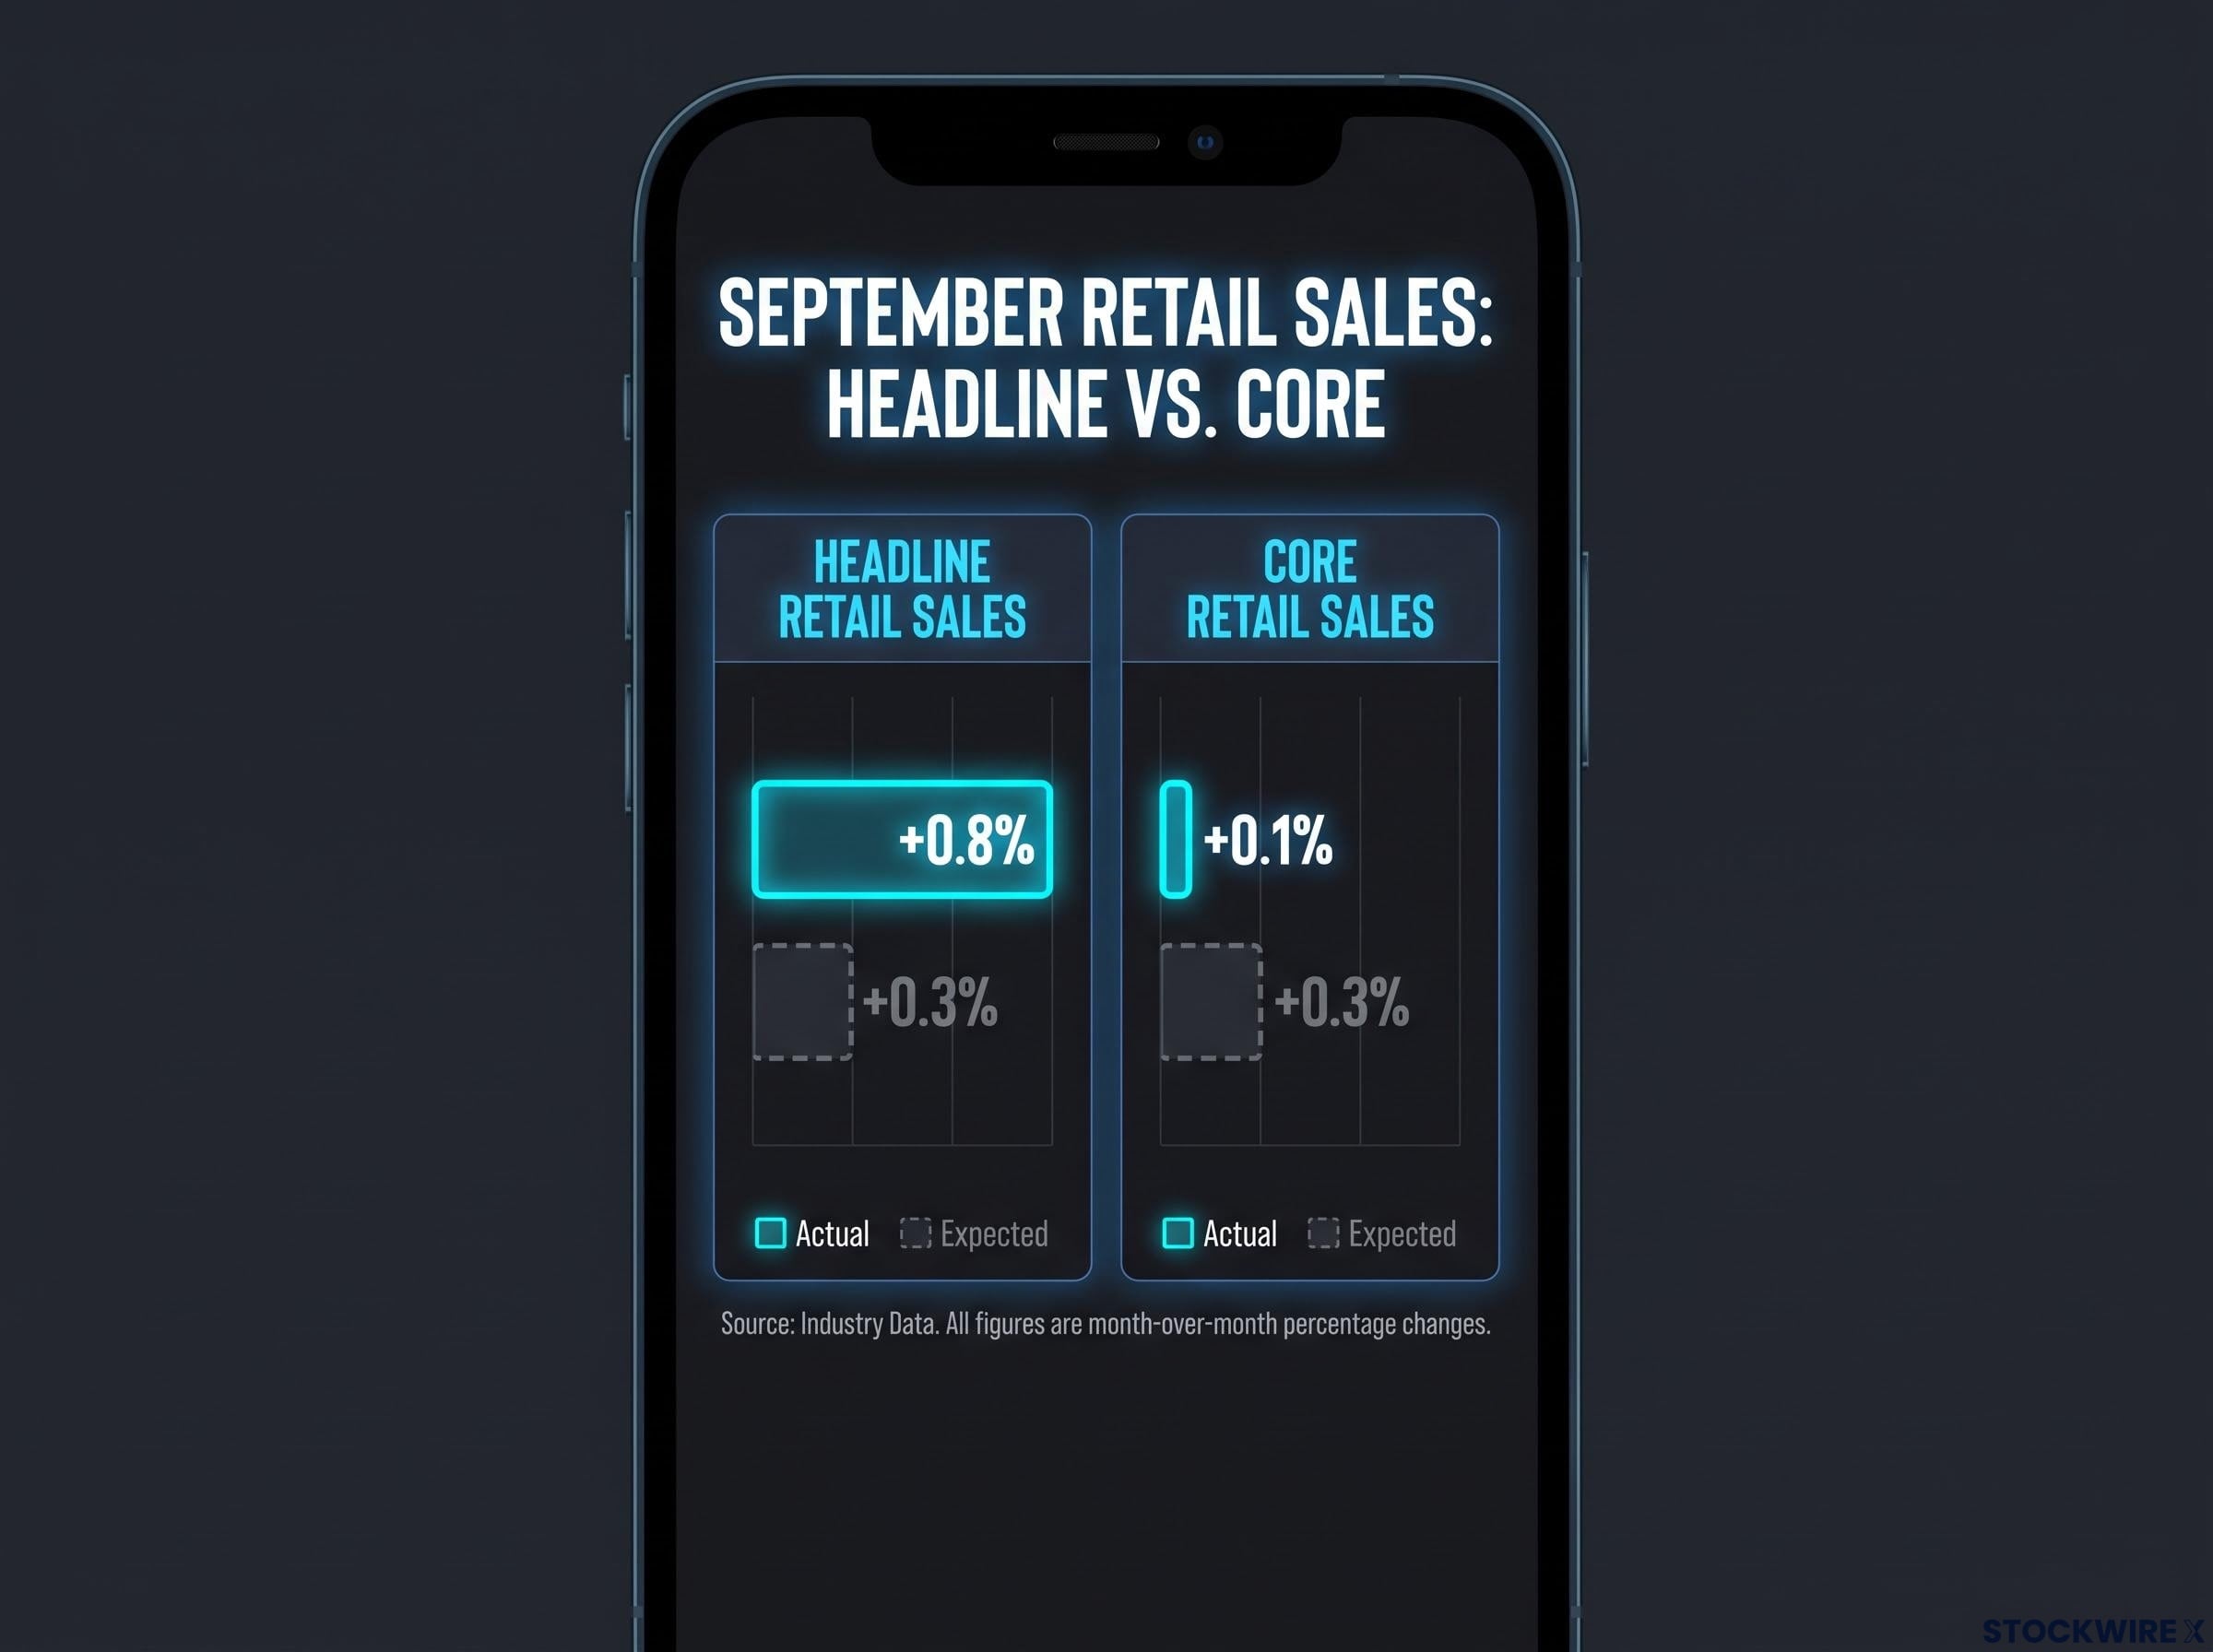
Retail sales are measured in dollars, not volumes, so pricier gasoline inflates the total. Strip it out and growth almost vanishes. Online sales growth slowed from 2% to 0.3%, and general merchandise turned negative.
The surveys tell the same story:
- Core retail: up just 0.1% in September
- Sentiment: University of Michigan preliminary October reading of 46.3 vs 47.6 expected; Conference Board confidence at its weakest since 2014
- Growth tracking: Atlanta Fed GDPNow, a real-time estimate of quarterly growth, at 3.6% for Q3, down from an initial 5-6%
- Breakevens: market-implied inflation expectations have stopped following crude higher
Stress has spread from lower-income to middle-income households. The Fed’s Beige Book described activity as flat in pace and narrow, with manufacturing carried by data centre, defence and energy demand while consumer sectors strain.
Brent traded at $104.87 and WTI at $92.30 on 8 October, per Reuters, with crude nearing its mid-September highs. Higher pump prices are draining spending power from everything else. The inflation you pay today is already shrinking the demand that bond buyers expect to cool prices tomorrow. Official Q3 GDP arrives on 29 October.
Subdued breakevens despite crude above $100 fit a pattern analysts treat among the clearer bond market recession signals: the curve is pricing a consumer crack before inflation can run away.
Where the AI selloff fits
The bond surge found its spark on 8 October, when the Financial Times reported that OpenAI‘s annualised revenue was nearing $50 billion, against roughly $70 billion previously circulated. The Nasdaq fell 1.25% and the S&P 500 0.5%, with Oracle down about 5%, CoreWeave about 8% and Nvidia about 3%, according to CNN.
Bloomberg later framed the gap partly as a comparison issue, reporting that OpenAI expected to reach $70 billion by year-end. The episode added safe-haven demand and a growth scare on top of the consumer story, but it was not the sole cause.
What does the repricing of Fed hikes and other markets say about what comes next?
Fed pricing remains hawkish, though how hawkish depends on when you checked. The CME FedWatch tool converts futures prices into implied odds of rate moves.
| Source | Date | Odds of 28 October hike |
|---|---|---|
| CNBC | 14 October | 53.7% (from 22.1%) |
| Yahoo Finance | 15 October | 41.5% |
| Separate FedWatch report | 14-15 October | 23.8% (unverified) |
The spread reflects intraday repricing as traders reassessed the data. Beyond October, markets price better than 95% odds of at least one more hike by year-end and roughly 40% odds of a 50 basis point move by December.
Officials have not softened, yet with the Fed having scrapped forward guidance, inflation prints rather than central bank signals now drive hike expectations, which helps explain why FedWatch odds swung so widely within a single day.
Officials have not softened. Reuters reported Governor Christopher Waller saying more hikes would likely be needed, and San Francisco Fed President Mary Daly saying further increases were more likely than not, though neither report has been independently confirmed. Bonds are betting the Fed eventually looks through the oil shock.
Stocks, gold, the dollar and Bitcoin
- Stocks: sold off on the data; the Nasdaq clawed back to roughly flat on Thursday
- Gold: reversed its post-CPI decline as the dollar fell
- Silver: bounced from a key level
- Bitcoin: holding steady
Risk assets are weak while gold and Bitcoin hold. That pattern does not fit a pure tightening story. One practitioner, Tasty Live‘s head of global macro, is positioned long bonds, gold and Bitcoin, though that is a single view rather than advice.
The question is whether this remains a 2022-style policy-tightening phase or is turning into 2008-style demand destruction. Four risks could snap the rally:
- Oil breakout: crude clearing mid-September highs; Pimco’s Dan Ivascyn reportedly flagged a 10-year at 6% (unverified)
- Expectations de-anchoring: the oil shock spreading into wages and services
- Weak auctions or hawkish Fed talk: either could reverse the bid
- Nominal versus real distortion: misreading inflated dollar figures as genuine strength
If you are weighing duration (your bonds’ sensitivity to rate changes) or risk exposure, the market leans towards demand destruction. That trade fails if oil keeps climbing and inflation expectations rise.
What the rally changes, and what it does not
The rally shows bond buyers weighting demand damage over the cost shock. The Fed has not endorsed that view, and its officials are still talking hikes.
The checkpoints are close. The FOMC decides on 28 October, Q3 GDP follows on 29 October, and crude’s path against its mid-September highs runs underneath both.
Weak core retail, soft sentiment and flat breakevens would confirm the demand-destruction read. An oil breakout, rising inflation expectations or a hawkish surprise would revive the 2022-style trade.
For readers wanting historical context on multiyear yield highs, our deep-dive into bond yield normalisation compares today’s levels with the pre-QE 2000s range.
This article is for informational purposes only and should not be considered financial advice. Investors should conduct their own research and consult with financial professionals before making investment decisions. Past performance does not guarantee future results, and market pricing and forward-looking statements are subject to change.