
In September, GQG Partners earned US$2.4bn in investment gains for its clients. Over the same month, those clients withdrew a net US$2.3bn. A good month was supposed to slow redemptions, but it barely changed them.
On 16 October 2026, Morningstar analyst Shaun Ler cut his fair value estimate for the ASX-listed fund manager to $1.05 from $1.50. He also raised the Uncertainty Rating to Very High from High. With the shares trading around $1.03-1.04, the market and Morningstar now broadly agree on what the business is worth.
If you hold GQG or are thinking about buying, the price gives you very little margin either way. The outcome depends almost entirely on what happens to client money from here.
The sections below set out the evidence on whether these outflows are a cyclical dip or a structural shift. They also give you a framework for judging whether the shares deserve a place in your portfolio.
Why are clients still leaving despite a good month?
At first glance, September looks reassuring. Funds under management (FUM), the total pool of client money GQG invests and charges fees on, held broadly steady at US$149.2bn (about $213bn) on 30 September 2026. Gains offset withdrawals.
The longer view is less comforting. In the first half of 2026, net outflows reached US$15.1bn, led by emerging markets (US$5.2bn) and international equities (US$4.7bn). June alone took FUM from US$163.3bn to US$156bn. The third quarter added another US$11.1bn of net withdrawals.
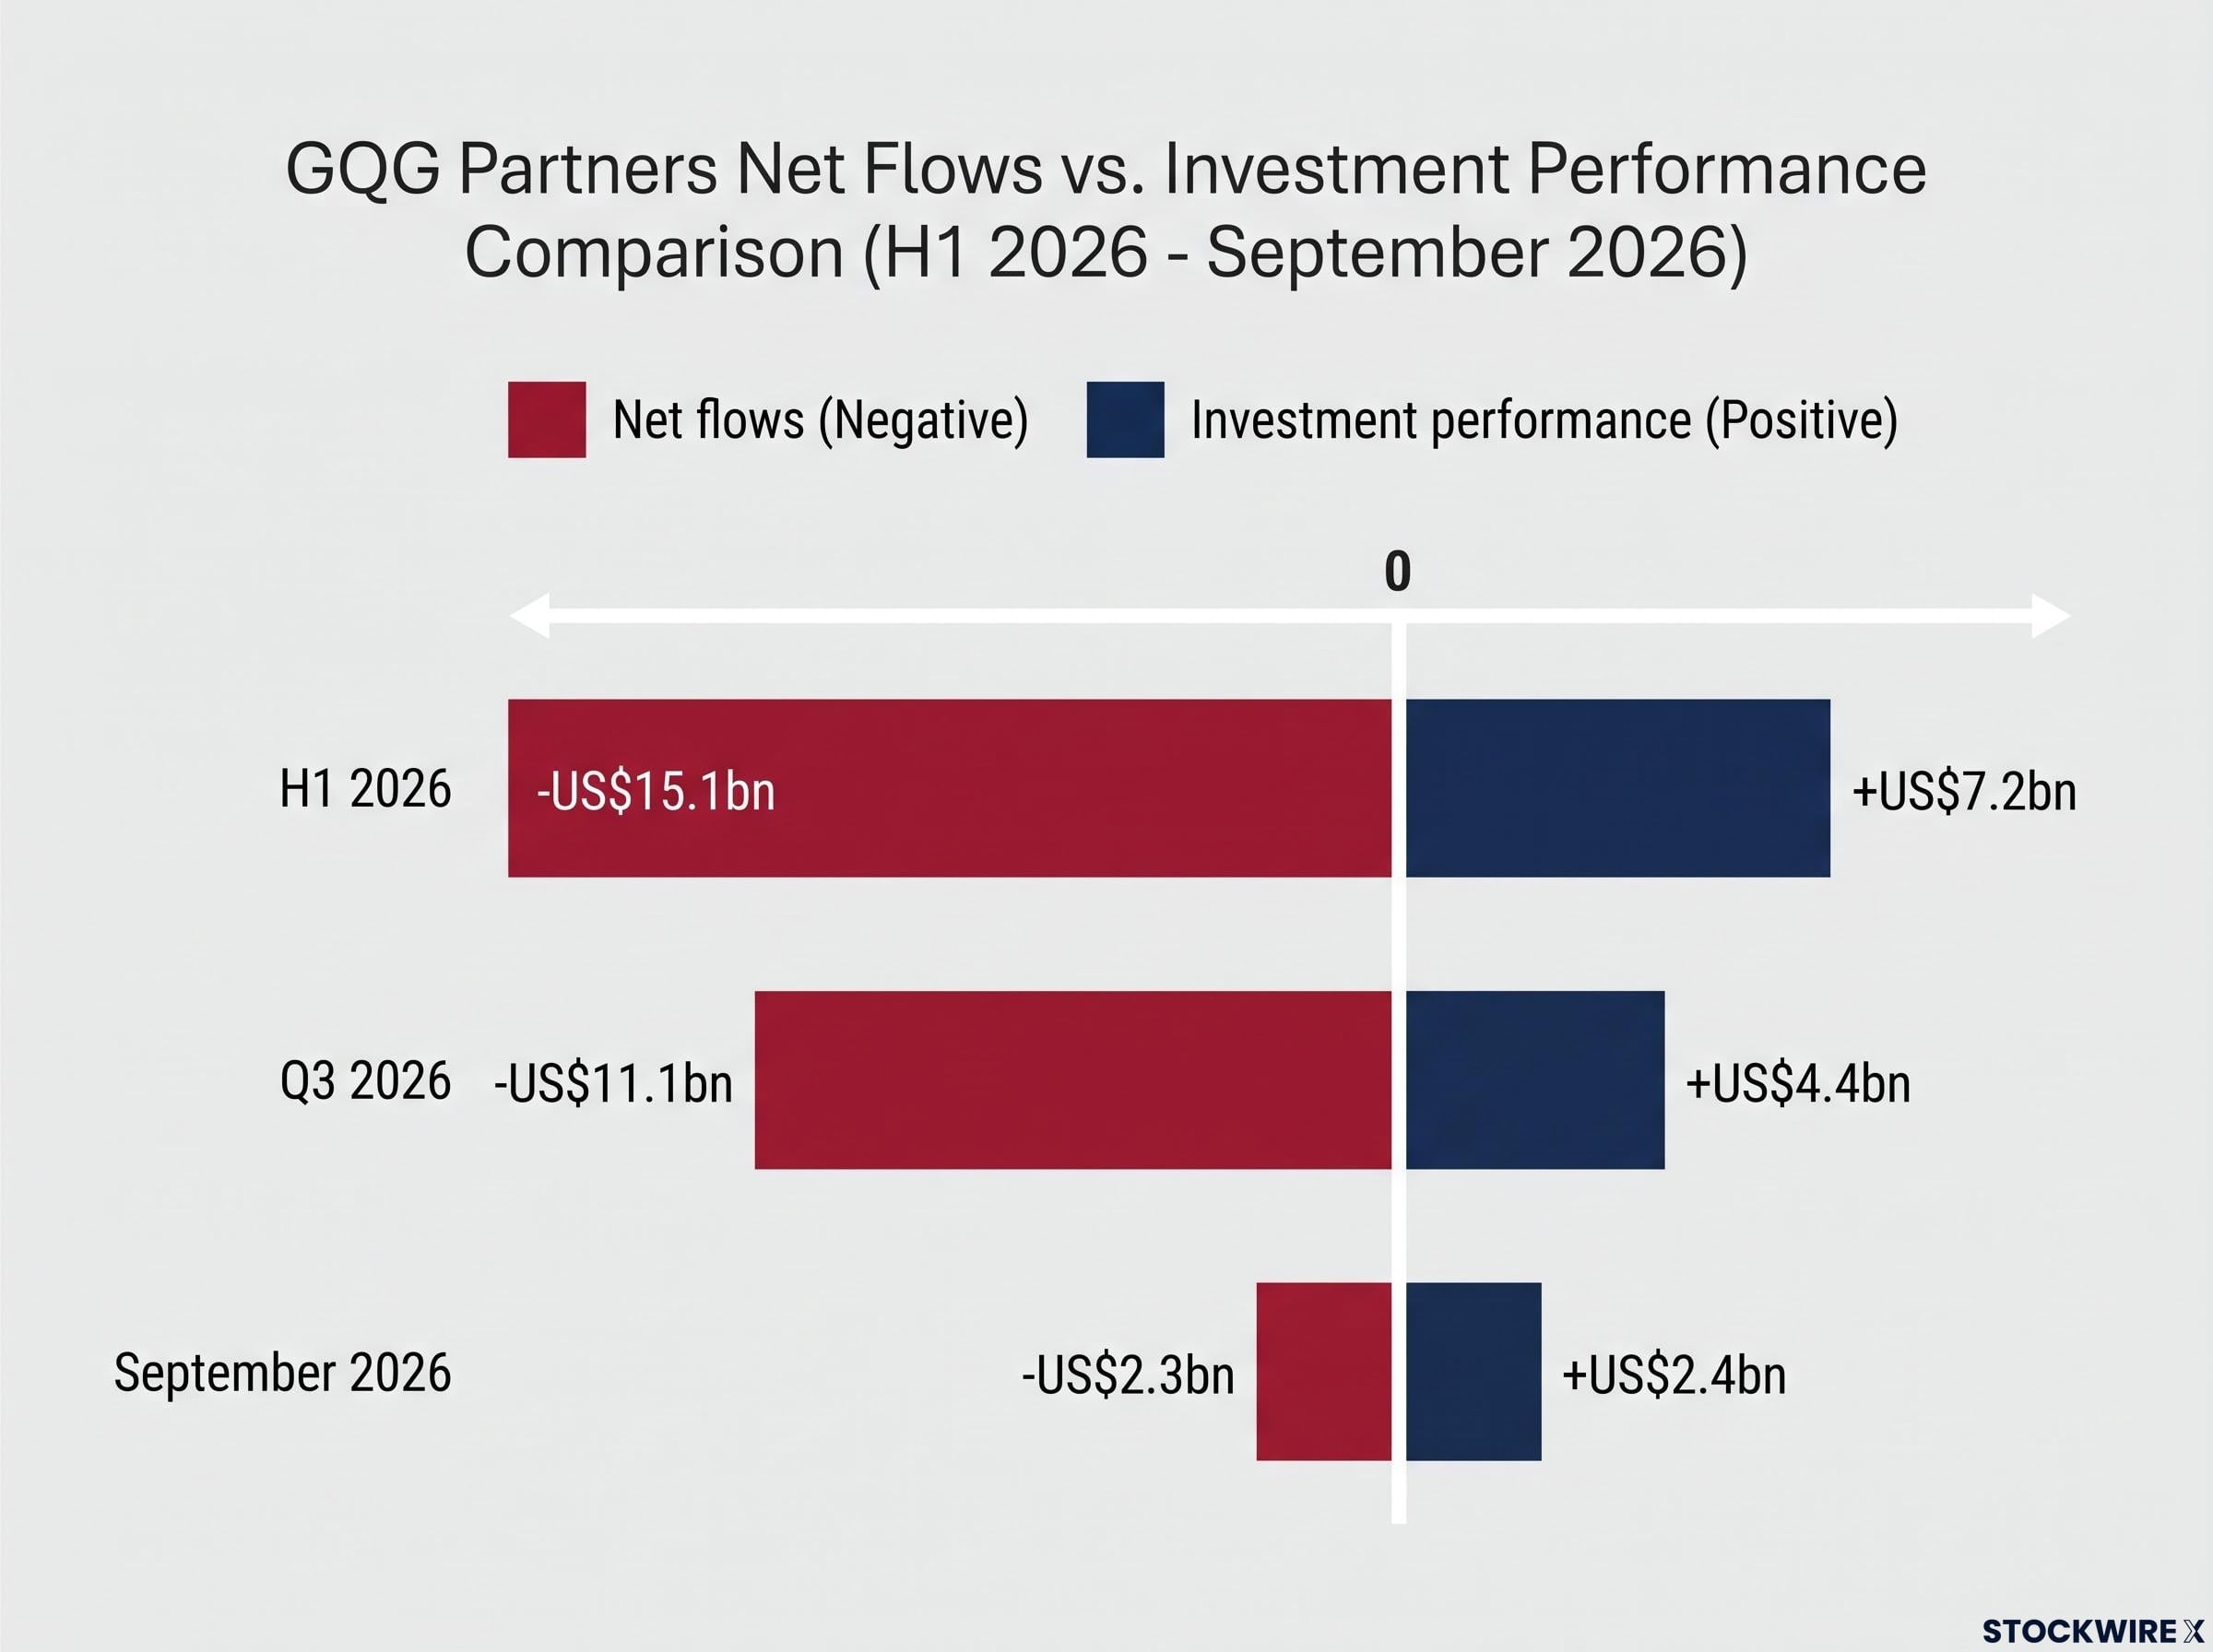
| Period | Net flows | Investment performance | Closing FUM |
|---|---|---|---|
| H1 2026 | -US$15.1bn | +US$7.2bn | US$156bn |
| Q3 2026 | -US$11.1bn | +US$4.4bn | US$149.2bn |
| September 2026 | -US$2.3bn | +US$2.4bn | US$149.2bn |
FUM is down roughly 11-12% year on year. Sources differ slightly on the starting point: Money Management cites US$169.2bn and Morningstar about US$167bn. Morningstar’s trailing-12-month outflow figure of about US$8bn actually understates the pace, because 2026 withdrawals are running well ahead of it.
September in one line All four main strategies delivered positive absolute and relative returns. All four still lost money: about US$1.0bn from emerging markets and roughly US$0.5bn each from international and global.
The flagship Global Equity strategy still trails its benchmark over one, three and five years. Clients appear to be judging GQG on that multi-year record rather than on any single month. You should not read a strong monthly print as a turning point. Flows tell you more than performance does.
What AFR and Money Management say is driving redemptions
The Australian Financial Review linked the September withdrawals to continuing client unease about Rajiv Jain‘s positioning. Jain had been a strong critic of the AI trade, then moved back toward technology in July. AFR suggested clients may be reacting to:
- disappointing relative performance
- doubts about whether the investment thesis will hold up
- how abruptly the AI shift happened
- a broader reassessment of active equity management
Money Management reported that GQG itself expects heavy outflows to continue. It also quoted Jain’s view that “cracks” were appearing in AI-related markets.
Jain’s reversal on technology followed an early call on an AI bubble that left all four flagship funds trailing their benchmarks and fed the institutional withdrawals now visible in the flow data.
When big ASX news breaks, our subscribers know first
How do falling flows turn into falling profit?
Here is the puzzle. Net profit for the first half of 2026 was US$228.4m, almost unchanged from US$230.2m a year earlier. Net management fees actually rose to US$396.6m. So how can billions in outflows leave profit flat?
The answer lies in how a fund manager earns money. GQG charges an asset-based fee, which is a percentage of the money it manages, and that fee is calculated on average FUM across the period rather than the closing figure. Average FUM in the first half was US$164.5bn, while period-end FUM had already fallen to US$156bn. The fees you see now reflect last quarter’s larger pool of money.
Costs work differently. Operating margin, the share of revenue left after operating costs, was 77.0% in FY2025. A margin that high means most costs (investment staff, technology, compliance, listing costs) stay fixed whether revenue rises or falls. When revenue grows, profit grows faster. When revenue shrinks, profit falls faster too.
A margin that high means operating leverage cuts both ways: the same fixed cost base that magnifies profit growth in good years amplifies the damage when fee revenue shrinks.
The chain runs like this:
- Underperformance prompts institutional clients to review the manager.
- Large clients redeem, sometimes in big single moves.
- Lower FUM means lower fee revenue.
- Fee rates compress as the product mix shifts (realisation fell to 48.4 basis points from 49.6bp in FY2025; one basis point is one hundredth of a percentage point).
- Operating leverage magnifies the hit to profit.
- The average-FUM cushion fades as redemptions continue.
Morningstar’s forecast follows that chain to its conclusion. It assumes an annual outflow rate of roughly 22%, FUM falling to about US$80bn by 2030, and fees trimmed to 0.45% from 0.48%.
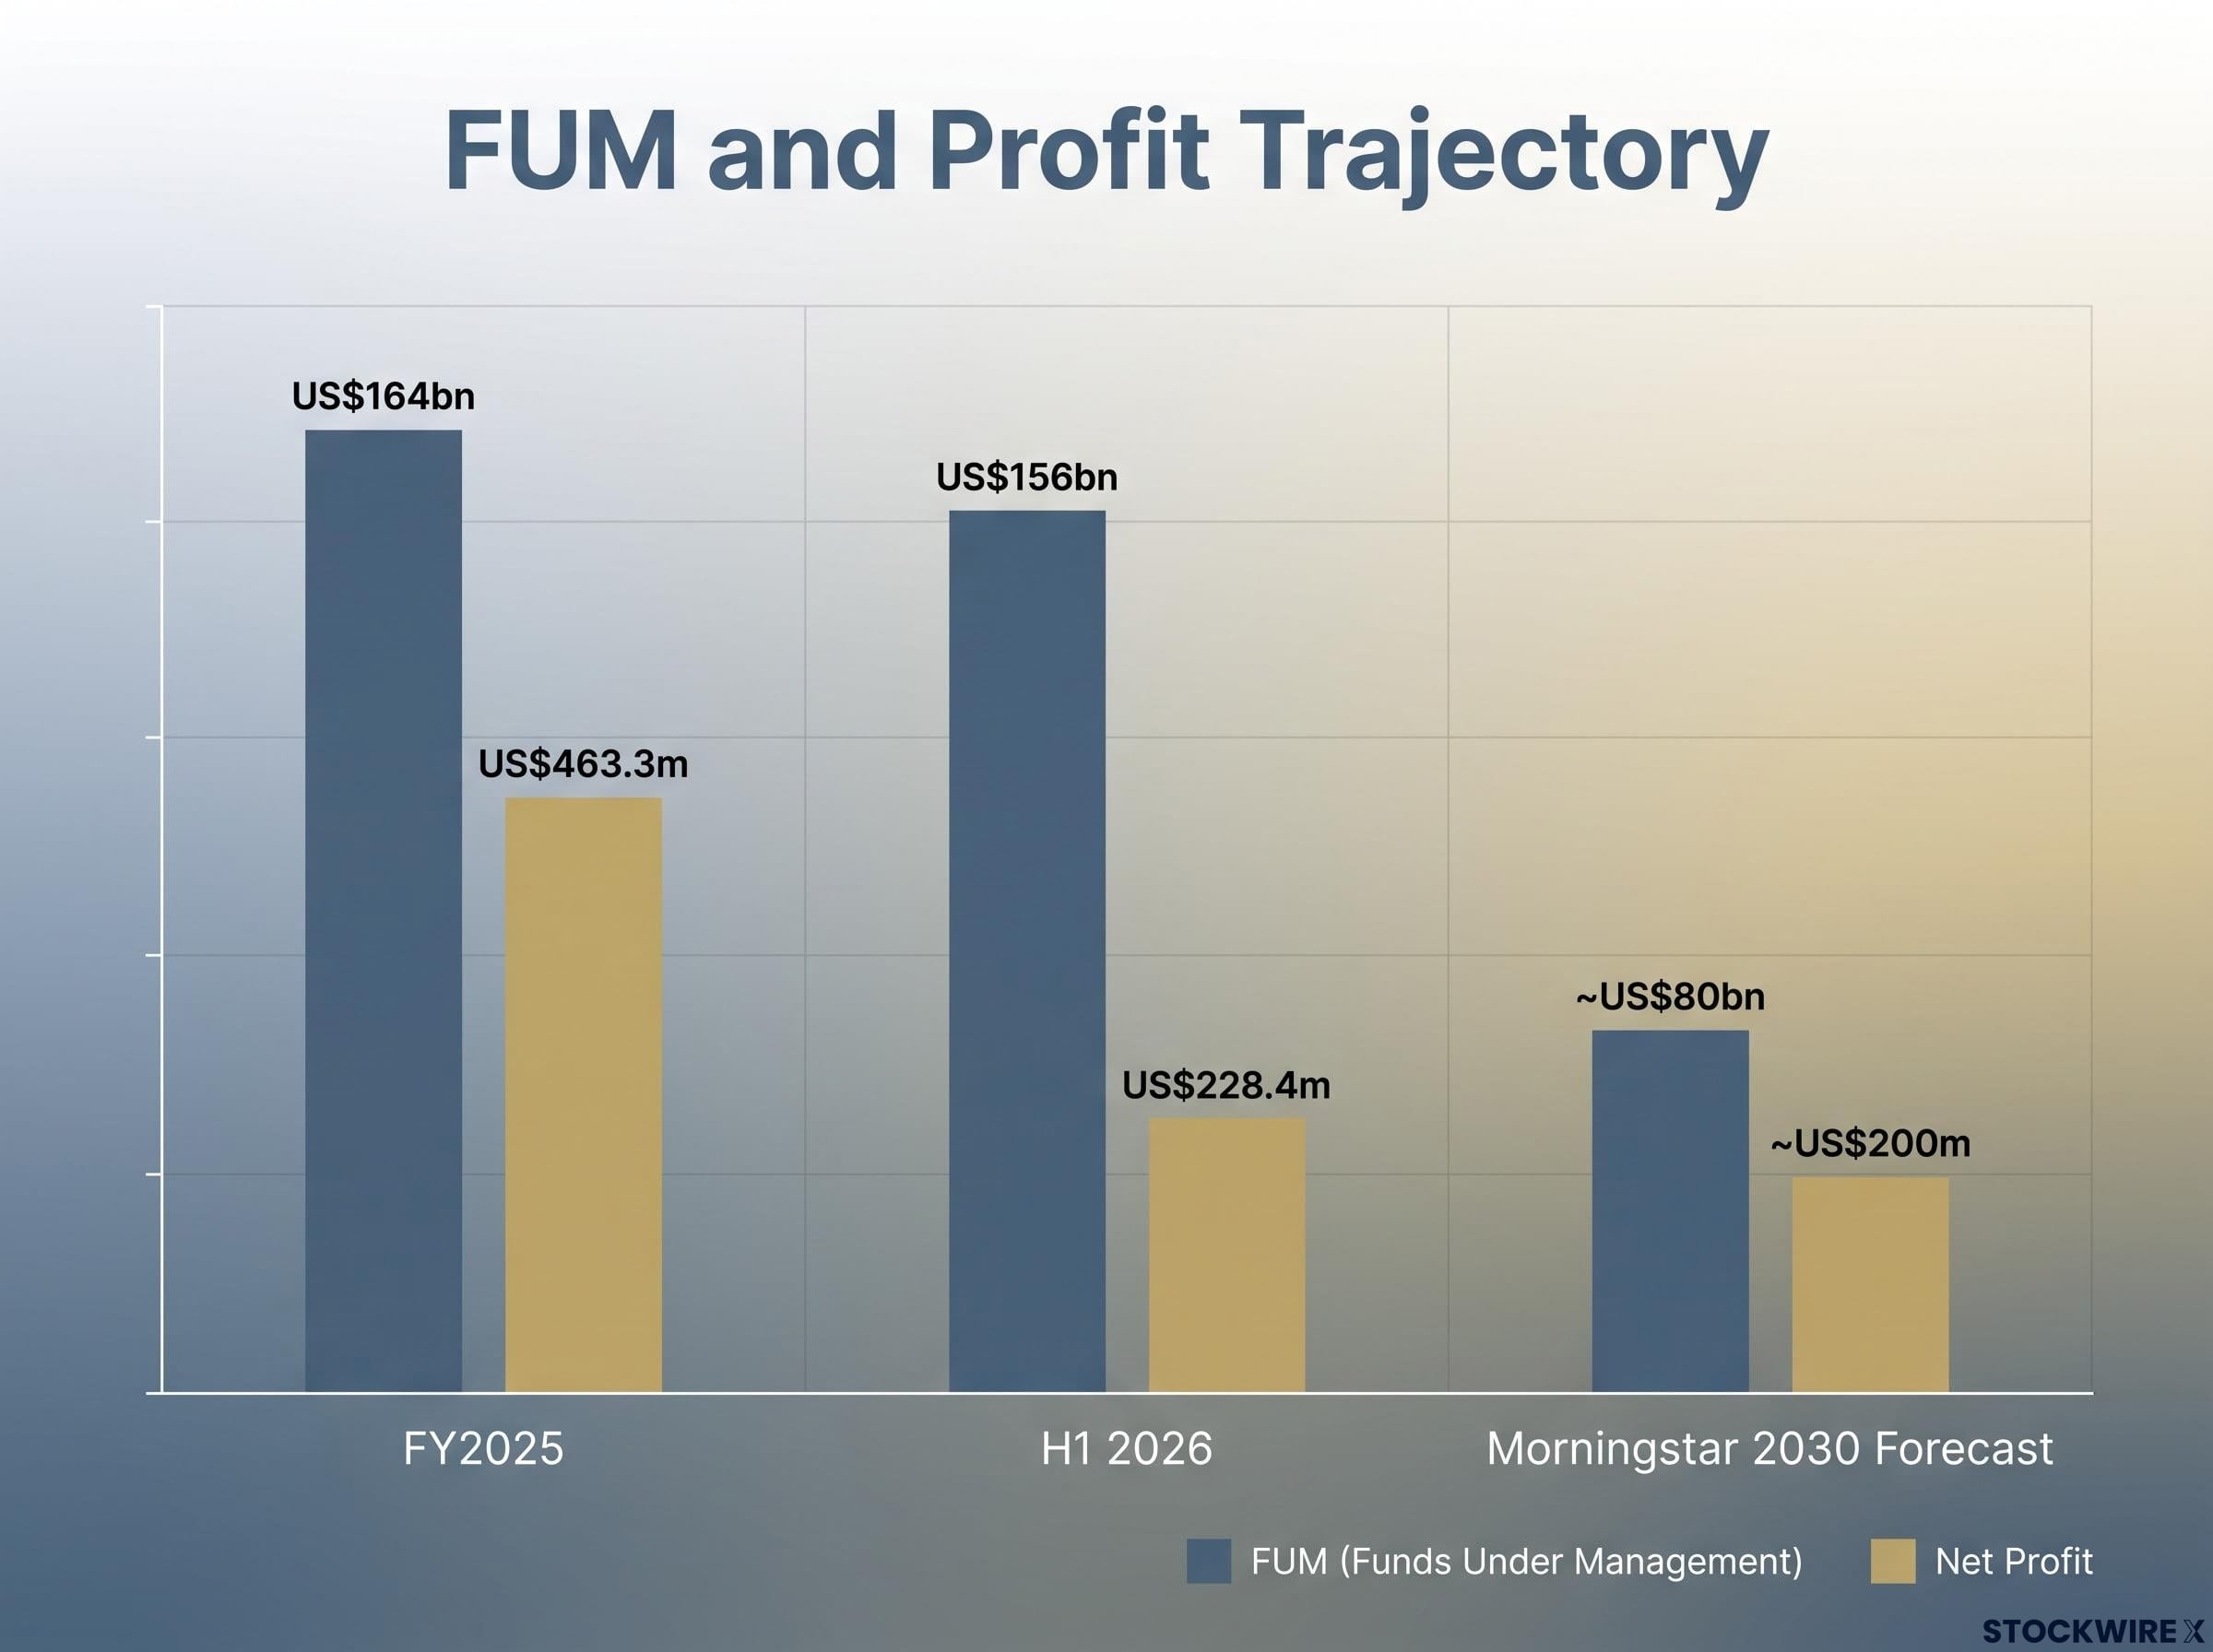
| Measure | FY2025 | H1 2026 | Morningstar 2030 |
|---|---|---|---|
| FUM | US$164bn (year end) | US$156bn (period end) | ~US$80bn |
| Fee rate | 48.4bp | Not separately reported | 0.45% |
| Net profit | US$463.3m | US$228.4m (half year) | ~US$200m |
That works out to a fall of about 60% in net profit from 2025. The flat result you see today is a cushion that is shrinking, and earnings per share could fall faster than revenue once the lag runs out. Taken together, this makes the cut from $1.50 to $1.05 look mathematically plausible.
Why cost cuts only partly help
The incentive pay assumption Incentive pay made up 37% of 2025 staff costs. Morningstar assumes none at all by midcycle.
Some savings are already showing. Incentive compensation in the first half fell to US$19.677m from US$22.020m. However, share-based awards rose to US$4.887m, and total compensation edged up to US$55.588m from US$55.262m. Headcount had also grown to 239 by December 2025, up from 212.
If the weakness persists, keeping staff will require fixed pay and share awards, and both are hard to wind back.
What makes GQG more exposed than a typical fund manager?
Plenty of fund managers lose clients after a soft patch. What sets GQG apart is that three amplifiers sit on top of each other:
- Client mix: more than 70% of FUM comes from institutional and subadvised clients
- One person: heavy reliance on Rajiv Jain
- One market and style: more than 80% of FUM is US-centred, run in concentrated portfolios
Client concentration
Retail investors tend to drift out of funds gradually. Institutions decide in committee and can terminate a mandate in one move, so losing one or two clients can shift revenue materially.
A third-party claim worth weighing Alpha Insights has reported that two institutional clients account for about 47% of revenue. It described this as evidence of both institutional trust and single-point-of-failure risk. This figure has not been independently verified.
Key-person risk
Jain is co-founder, executive chairman, chief investment officer and portfolio manager for the public-equity strategies. Alpha Insights claims, again without independent verification, that he owns about 70% of the company and that no succession plan has been disclosed. On the other side are his long track record, his large personal investment, team-based management and the eight new partners named in December 2025.
US tilt and style risk
GQG’s concentrated, high-conviction portfolios tend to protect more in downturns than they gain in bull markets. Alpha Insights cites historical downside capture of 52%-72% (an unverified claim). Downside capture measures how much of a market fall a fund absorbs. That style lagged badly while broad technology led, and the later pivot on AI risked looking inconsistent.
International expansion into Australia, Canada and the Middle East, including a push into superannuation, has no publicly quantified target. The narrow product range also limits the levers GQG can pull to stem outflows.
For you, that adds up to a bet on one manager’s style and on large clients’ patience. A diversified share register is not the same as a diversified earnings stream. Size any position for single-point-of-failure risk, not for the headline 76% margin.
Bull case, bear case and what the peers teach
Nobody disputes that outflows are happening. The real disagreement is about whether they persist.
The case for resilience
GQG carries no debt, generates strong cash flow and charges fees below many active peers, which leaves less room for further compression. Employee ownership aligns staff with shareholders, market gains compound FUM, and a reversal in technology leadership could restore relative performance. In 2025, Livewire commentary put the stock on a forward price-to-earnings (P/E) ratio of about 13x, though that view is dated and unverified.
The case for further pain
Morningstar’s bear case sees no clear catalyst to reverse redemptions. Defensive, anti-AI positioning has been out of favour, and cost savings slow the earnings decline without stopping it. Add concentration, key-person risk and the speed at which institutions can leave, and September’s failure to turn flows becomes the strongest evidence for the bears.
| Bull case | Bear case |
|---|---|
| No debt, strong cash generation | Single investment style, little business diversity |
| 76% operating margin | Operating leverage magnifies falling revenue |
| Low fees resist compression | Institutional clients can exit quickly |
| Positive September performance across all four strategies | One good month did not restore flows |
| Possible reversal in technology leadership | No clear flow catalyst, per Morningstar |
Lessons from Magellan, Platinum and Perpetual
| Peer | What happened | Lesson for GQG |
|---|---|---|
| Magellan | Lost confidence fed redemptions, lower fees and a weaker share price | Founder-linked managers with high operating leverage can enter self-reinforcing cycles |
| Platinum | A strong reputation did not stop reallocation after long underperformance | A track record buys time, not loyalty |
| Perpetual | Outflows, fee pressure and restructuring combined | Cost cuts shield profit only temporarily |
The domestic precedents point the same way. Once institutional confidence breaks, performance has to rebuild it, and that usually takes years rather than months. At about $1.03-1.04 against a $1.05 fair value, the shares only offer a margin of safety if outflows stabilise. Your decision turns on whether you believe performance can win back institutional trust.
Magellan’s quarterly AUM shows how retail mandates can exit permanently even as institutional balances grow, a split that makes the peer comparison with GQG’s institutional base instructive.
What the fair value cut changes, and what it does not
The cut to $1.05 reflects higher assumed outflows and lower fees. It does not signal a collapse: GQG remains debt-free, highly profitable and cash generative. What has changed is that the share price now sits almost exactly on Morningstar’s estimate, so the valuation no longer gives you a cushion.
The deciding variable is whether institutional clients come back, and September showed they have not yet. Three signals will tell you which way this breaks:
- Quarterly net flows turning positive, not just narrowing
- Global Equity’s three-year relative performance moving back above its benchmark
- Any disclosure on succession planning or changes in client concentration
If those signals improve, the bull case gains weight. If they do not, the Magellan path looks more likely.
The latest monthly FUM update shows every strategy lost money to redemptions in September, and the next release on 11 November 2026 will test whether the slowdown holds.
This article is for informational purposes only and should not be considered financial advice. Investors should conduct their own research and consult with financial professionals before making investment decisions. Past performance does not guarantee future results. Financial projections are subject to market conditions and various risk factors.