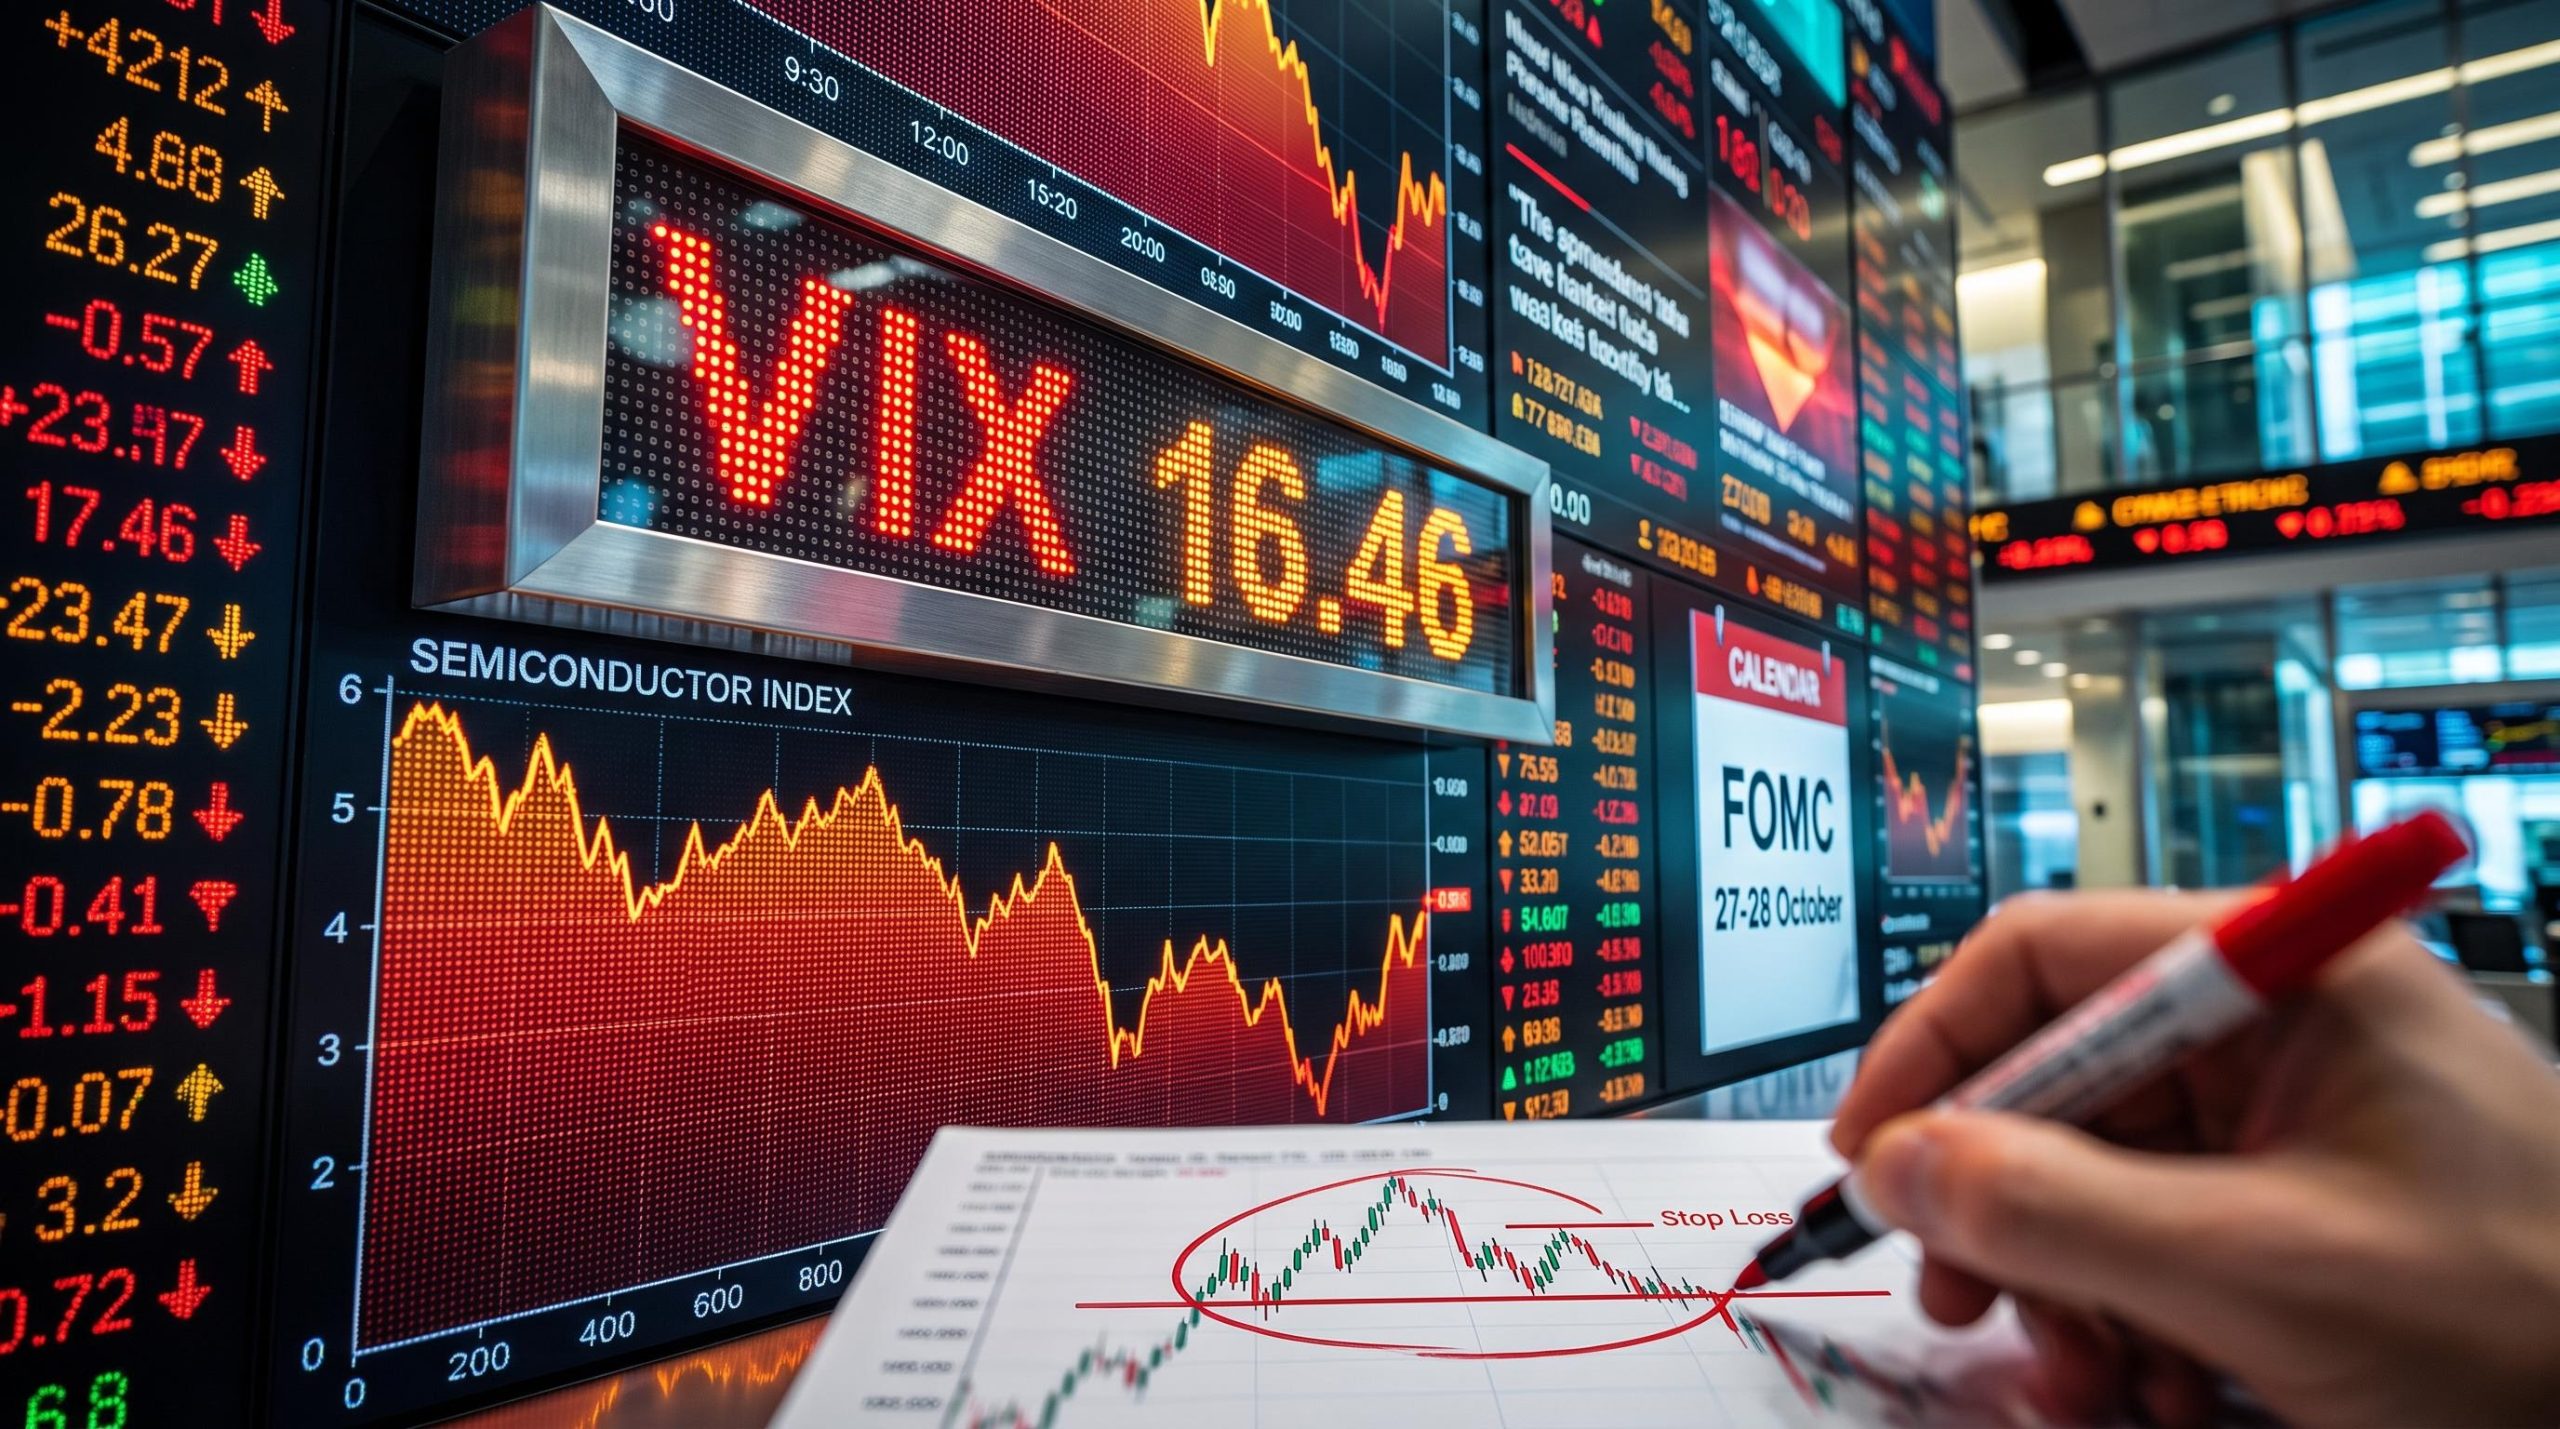
A trader who still expects lower prices cut his short book roughly in half on Thursday, 15 October 2026, from 37 positions to 18. Over the same stretch, the VIX, Wall Street’s fear gauge, never climbed past the high 16s, even as US chip stocks shed roughly $1.64 trillion in market value over six sessions.
That pairing raises an awkward question for anyone practising counter-trend bounce trading: if a committed bear is covering, is the bearish thesis already broken?
Timing makes the question urgent. The Federal Reserve’s policy committee (FOMC) meets 27-28 October, and the US election follows on Tuesday, 3 November. Anyone positioned for more downside now faces two risks at once: a short squeeze, where falling positions are forced to buy back as prices rise, and an overnight gap around two binary events. All figures here are as of 15 October 2026.
Here is how to tell a tactical bounce from a genuine change of trend, and how partial covers, stops, hedges and gap-based re-entry can manage the space between the two.
Is this a bounce or a trend change? What the October 14-15 evidence shows
Wednesday belonged to the sellers. Technology led the decline, and a semiconductor gauge fell 4.3%, according to Bloomberg, stretching a six-session slide to about 12%. The Dow barely moved, which hinted that the damage was concentrated rather than general.
Thursday told a different story. The recovery was broad, but the leaders were not the names that had fallen hardest.
| Index | 14 Oct close | 15 Oct close | 15 Oct move |
|---|---|---|---|
| S&P 500 | 7,718.94 (-1.11%) | 7,744.06 | +0.33% |
| Nasdaq Composite | 26,692.87 (-1.88%) | 26,713.03 | +0.08% |
| Dow Jones Industrial Average | 51,621.48 (-0.09%) | 52,177.69 | +1.1% |
| Russell 2000 | Not reported | 2,767.27 | +1.4% |
The Nasdaq clawed back almost nothing. NVIDIA chief executive Jensen Huang helped steady nerves before the open by saying AI chip demand still exceeds supply, and Tim Knight, host of Slope of Hope, said those comments calmed pre-market worries. Calm, however, is not repair.
The chart evidence for a counter-trend move
Knight’s case rests on broken structure. SPY, the main S&P 500 exchange-traded fund (ETF), fully broke its uptrend line. NVDA broke a trend line, traded below the prior day’s low and left a fresh gap, while trend lines on the 4-hour QQQ chart shaped his decision to lighten up. The UFO space ETF is returning to the neckline of a large head-and-shoulders top, a pattern of three peaks that often marks the end of a rally, and KORU completed one at speed.
The signal is not clean, though. SPY traded back above its broken line intraday.
The case against the bearish read
Goldman Sachs reportedly sees the decline as a buying opportunity, while JPMorgan argues the short-squeeze fuel that powered July’s rebound is exhausted. Breadth was constructive, and lower yields or softer Fed expectations could feed further gains.
What this tells you is that the burden of proof sits with the bulls while leadership stays damaged, but bears cannot assume the next leg down arrives on schedule.
When big ASX news breaks, our subscribers know first
Why can the VIX stay in the high 16s during a selloff?
Most investors assume a falling market sends the VIX soaring. That assumption breaks down more often than you might expect.
The VIX measures how much volatility options traders expect from the S&P 500 over the coming month. It tracks the price of protection, not the size of a decline. It closed at 16.46 on Thursday, up 7.79%; one report showed 16.87, a gap that most likely reflects different data feeds.
Four forces can keep it subdued:
- Gradual selling. Cboe, summarising Reuters analysis, said the decline was slow enough for investors to trim exposure step by step rather than scramble for puts.
- Already-reduced exposure. Investors who have cut positions need less insurance.
- Concentrated weakness. Losses in expensive technology and chip stocks can drag indexes without a disorderly, market-wide liquidation.
- Systematic funds. Reuters warned on 1 October that volatility-control funds, which adjust equity holdings according to market calm, carried very high equity exposure. A modest pullback could force them to sell.
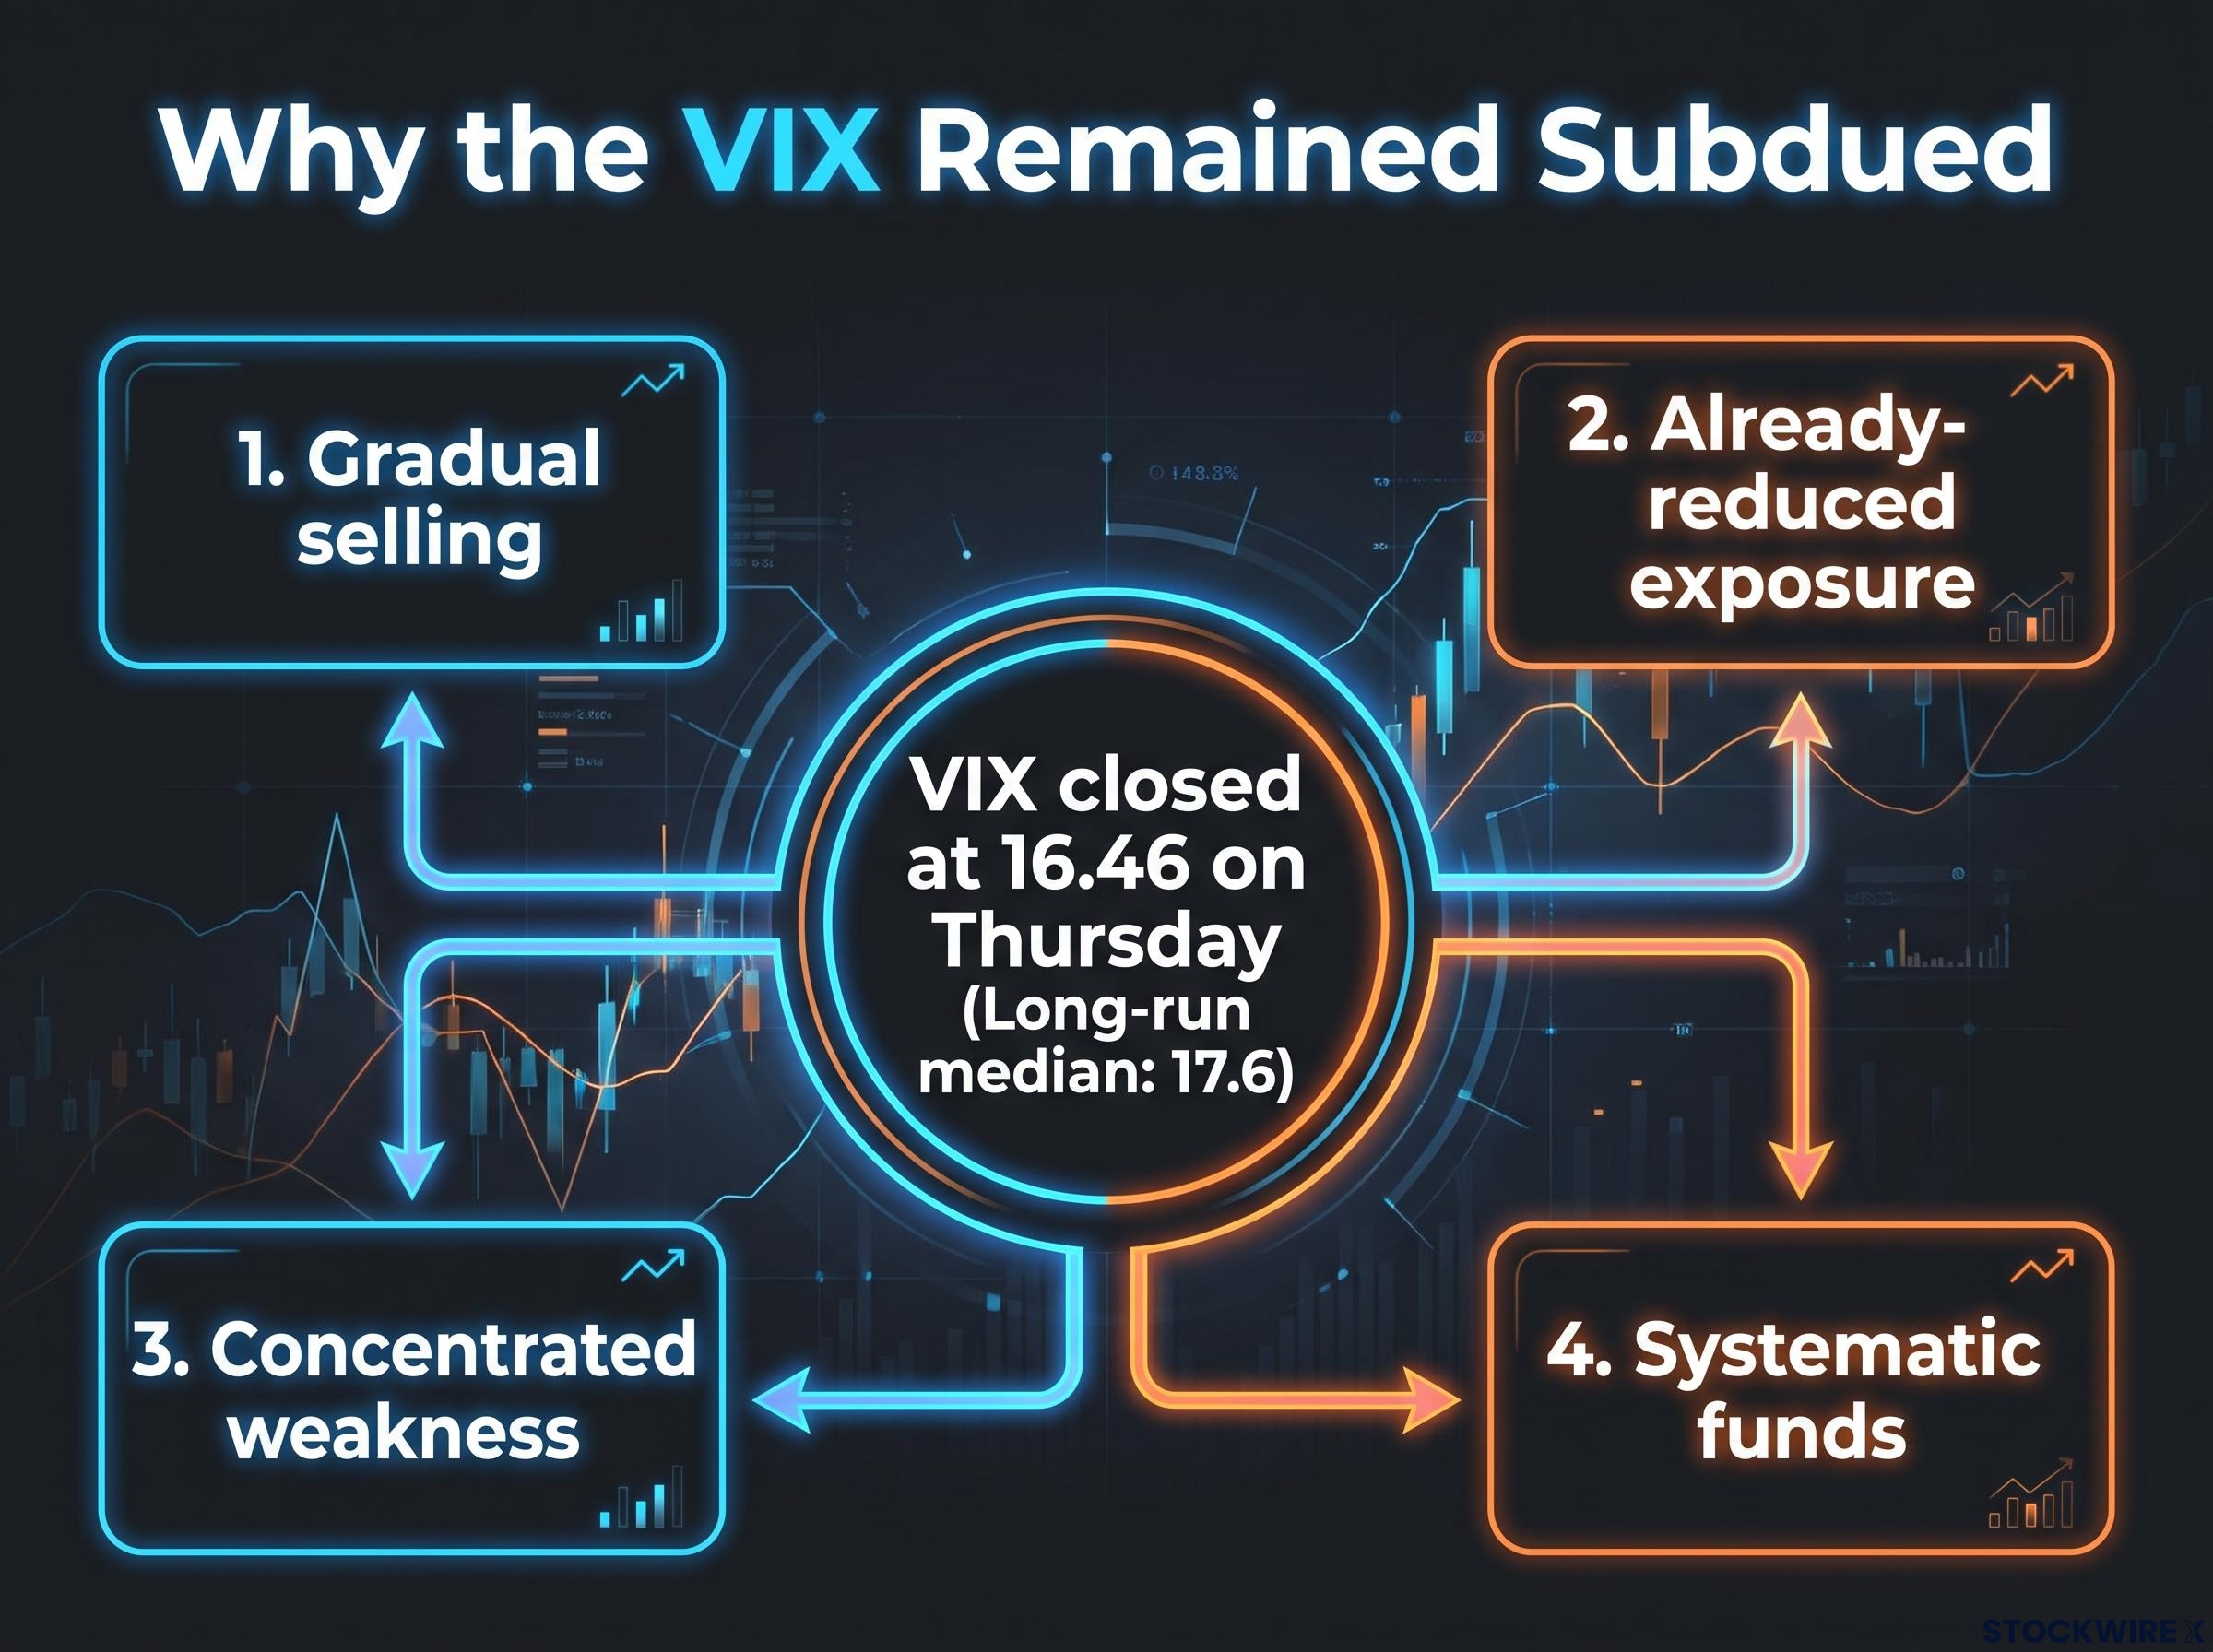
Below the long-run norm Reuters reported the VIX near 15 sat below its long-run median of about 17.6, with little election premium built into the curve.
Michael Purves of Tallbacken Capital Advisors said the VIX curve was not pricing a meaningful election premium, and Evercore ISI’s Julian Emanuel described implied volatility as unusually cheap relative to election risk.
Two readings compete. One says complacency; the other says orderly de-risking. Knight lands firmly on complacency.
The complacency reading gains weight when short-volatility exposure is considered: systematic strategies and structured products can mechanically suppress the headline VIX, so a calm gauge does not always mean calm underlying risk.
For you, the practical point is cost. A VIX in the high 16s means the market is not pricing a crash, so protection is cheap, but a shock would reprice it sharply. That may make this a better window to buy hedges than to rely on stops alone.
How to cut shorts without abandoning the thesis
Knight’s reset was not one decision. It was four, each aimed at a different risk. The specific post documenting it was not independently located, so these details rest on his own session commentary.
| Action | Example from Knight | Risk it addresses |
|---|---|---|
| Halve the short book | 37 positions cut to 18 | Squeeze risk after a sharp drop |
| Keep conviction anchors with stops | Rocket Lab stop tightened; XLU short enlarged | Theoretically unlimited short losses |
| Add brief longs and hedges | QQQ and emerging markets longs | Upside event gaps |
| Avoid holding leveraged ETFs | Caution on SOXS | Daily-reset decay |
The covered names were heavy in semiconductors, hyperscalers and quantum computing:
- Covered: SMH, FXI, EWZ, Applied Materials, Planet Labs, Viasat, WDC, QBTS and Lennar
- Retained: Rocket Lab, Synopsys, Tesla, Carvana and IonQ, the sole quantum holding
Carvana stayed with a distant stop despite what Knight calls a bullish long-term chart. XLU, the utilities ETF, became his largest anchor and hedge after printing a bearish engulfing pattern, where one day’s range swallows the prior day’s.
The emerging-markets long was closed for a profit that same morning. Knight does not hold hedges for long, and SOXS shows why. This triple-leveraged bear semiconductor fund resets daily, and he saw it run from about 28-29 to nearly 50 since around 6 October. Daily compounding can erode such funds in choppy markets, so they suit short tactical use, not permanent protection.
The final piece is re-entry. Rather than chase the next leg lower, Knight plans to rebuild near prior price gaps. The lesson for you: cutting size is a risk decision, not a verdict, and surviving a squeeze is what keeps a correct bearish view tradeable.
Rebuilding near unfilled chart gaps is a recognised approach among contrarian short sellers, who combine gaps with Fibonacci retracements and prior pivot highs to find zones where late buyers become future sellers.
FOMC, the election and the case against staying net short
The calendar compresses quickly:
- 14 October: Technology-led selloff
- 15 October: Broad rebound and Knight’s reset
- 27-28 October: FOMC, with the decision on the 28th
- 3 November: Election day
Knight expects the Fed to hold. Futures markets are less certain, and less consistent. CNBC put the odds of a quarter-point hike at about 53.7% on 14 October, up from 22.1% a day earlier, while Yahoo Finance reported about 40% on 15 October. Those are shifting market probabilities, and the swing itself shows how hard this event is to price.
Rates add another layer. BMO Capital Markets’ Vail Hartman attributed falling yields to safe-haven buying during the tech selloff, the kind of move that could support stocks if it persists.
The bearish case also faces real objections:
- Crowded bearish positioning can fuel a rally if support holds and shorts cover together.
- Analyst commentary suggests volatility tends to contract after midterms and fade into year-end.
- A low VIX may reflect orderly de-risking, meaning further losses could need a fresh catalyst.
- Thursday’s breadth, led by the Dow and Russell 2000, was constructive.
The sizing lesson Staying net short through both events calls for smaller exposure, explicit stops and some upside hedge.
Trading-strategy guidance points the same way, identifying FOMC, CPI and employment releases as moments to cut size. The evidence supports Knight’s reduction as risk management. It does not prove a net-short book will beat a neutral or selectively hedged one.
With two binary events six days apart, your position size and stop placement matter more than your directional call. Being right on direction offers no protection from being wrong on timing.
After-hours gap risk is the reason stops alone fall short around scheduled events; a single-stock jump of 13% overnight can blow through any stop, which makes position count and sizing the real defence.
What stays the same when the bounce fades, and what you should decide now
A bounce is a tactical event to manage, not a thesis to defend or abandon. Knight’s reset shows the difference: fewer shorts, tighter stops, brief hedges, and the bearish view intact.
Three variables decide the next leg. Watch whether semiconductor leadership repairs, how yields and Fed expectations settle, and whether cheap volatility reprices around the FOMC and election.
Decide before the moves arrive. Know where you would re-enter, where your stops sit, and what size you will carry into 28 October and 3 November.
All figures are as of 15 October 2026, and market probabilities may change quickly. Past performance does not guarantee future results, and forward-looking views here are speculative.
This article is for informational purposes only and should not be considered financial advice. Investors should conduct their own research and consult with financial professionals before making investment decisions.