Crude oil is moving through the Strait of Hormuz again. On economist Steve Hanke‘s estimate, flows have climbed back to roughly 85% of the pre-war baseline. Yet Brent still sits near $107 a barrel and US diesel costs more than $6.28 a gallon, which tells you that the link between oil and diesel prices has broken in a way most headlines miss.
Crude recovery is not the same as diesel recovery.
The war began in late February 2026, and diesel is the fuel that moves harvests, freight and food. If you assume falling crude headlines mean relief at the pump, on the farm or in your energy holdings, you risk misreading where costs are heading for months.
This piece shows you where the bottleneck actually sits, why the International Energy Agency (IEA) expects tightness well into 2027, and which policy fixes can add barrels and which only move them around.
Why is crude recovering while diesel stays stuck?
Start with the good news. The IEA estimates total oil flows through Hormuz rose by 3.7 million barrels per day (b/d) to 10.9 million b/d. Saudi Arabia’s East-West pipeline, which bypasses the strait, added 970,000 b/d to reach 5.6 million b/d.
US Energy Secretary Chris Wright goes further, putting flows at 80-90% of pre-conflict levels, or about 13-14 million b/d. The two figures differ because they likely use different periods and definitions, but both point the same way for crude.
Hanke’s trajectory shows how uneven that recovery has been against the 27 February baseline.
| Date | Hormuz flow vs baseline |
|---|---|
| 18 April | 19% |
| June | 52% |
| 14 August | 17% |
| 3 September | About 76% |
| Mid-October | About 85% |
Now look at what is in the tankers. Wright’s own numbers reveal the gap.
Refined products lag far behind Wright said refined-product flows from the Arabian Gulf were running at only 25-35% of pre-conflict levels (Aawsat, 12 October).
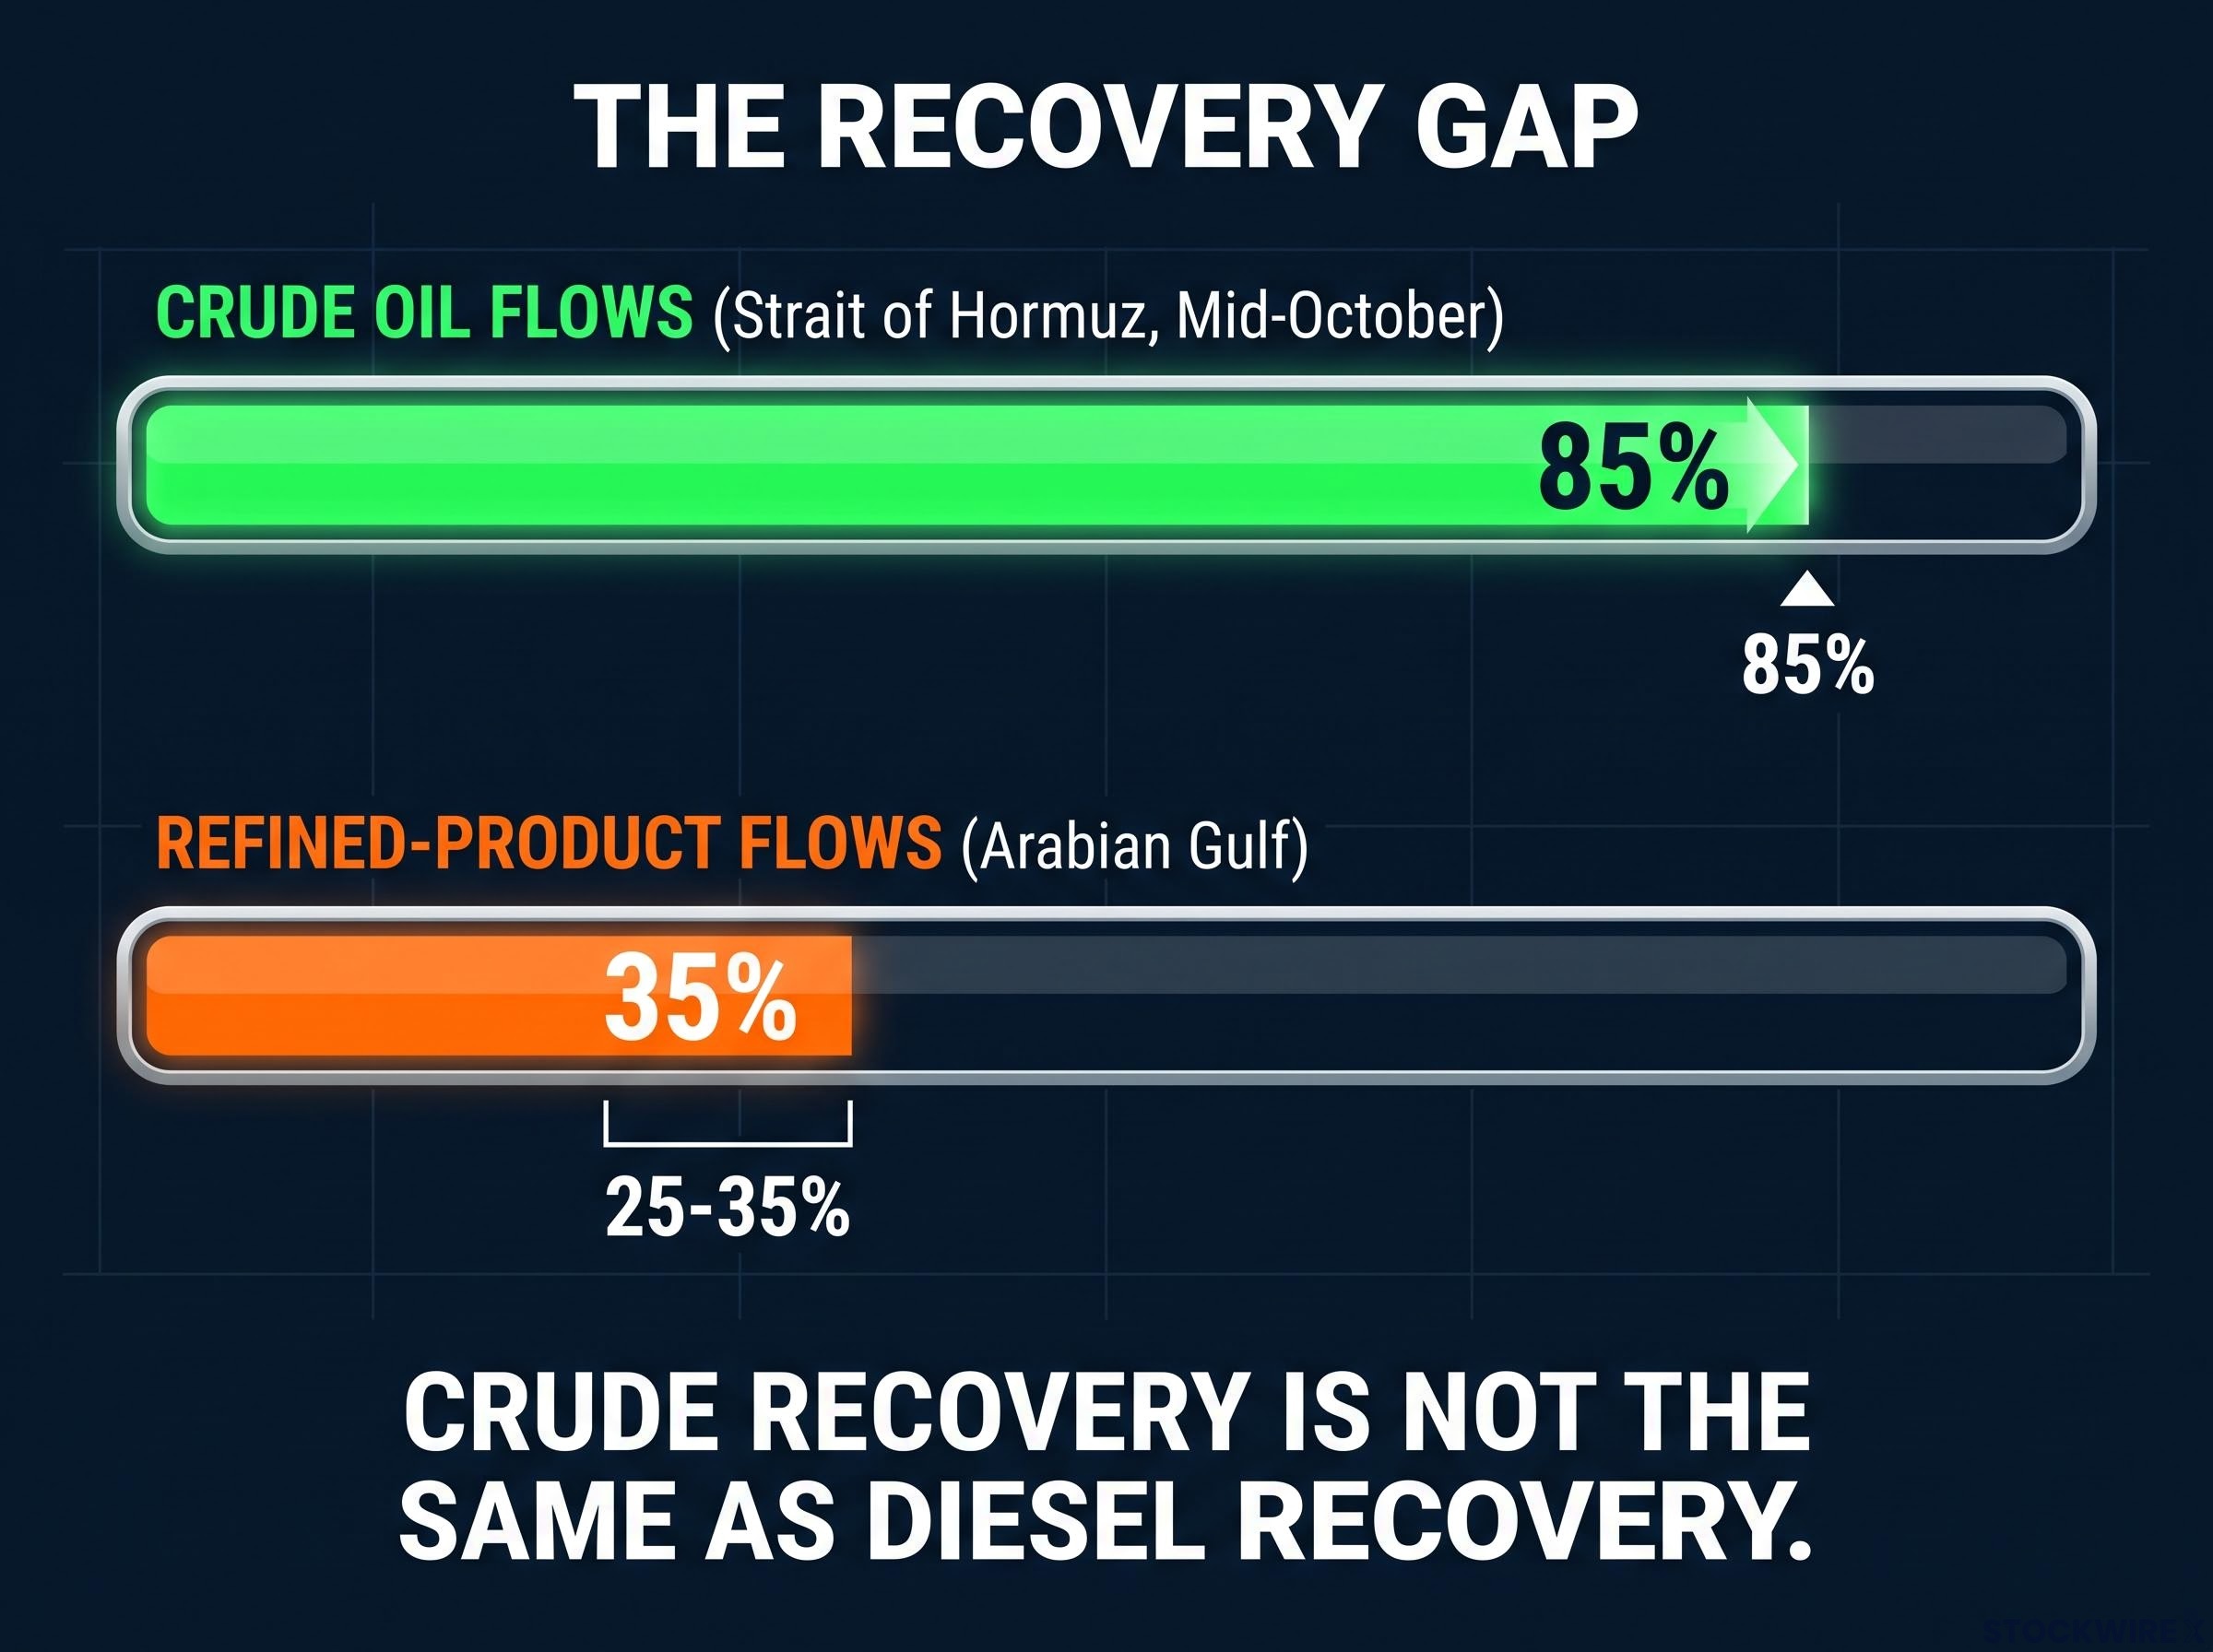
Even so, Brent has risen 13% since the start of September, according to the IEA’s 14 October report. A headline saying “Hormuz is reopening” tells you about crude, not the diesel you actually buy. Treat crude recovery as a necessary signal, but not a sufficient one.
When big ASX news breaks, our subscribers know first
How do futures, physical barrels and backwardation work?
Open a trading screen and you will see something odd: oil for delivery this month costs far more than oil for delivery next year. That shape carries most of the story.
- Futures price: the price agreed today for oil delivered on a set future date. This is the headline number you see quoted.
- Physical premium: the extra amount a buyer pays above that quoted price for real barrels delivered now.
- Backwardation: a market where near-term contracts cost more than later-dated contracts.
Futures versus physical prices
The quoted Brent price is a futures price, not necessarily what a refiner pays to fill a tank this week.
Refined products show the strain more clearly. Wholesale diesel averaged about $220 a barrel in Europe during September, according to IEA figures reported by Forbes Middle East, and topped $200 in Singapore, per ICIS. Compare that with crude near $107.
Dallas Federal Reserve The gap between crude and wholesale gasoline, diesel and jet-fuel prices has widened “well beyond normal,” driven by refinery damage, shipping constraints and export restrictions.
What backwardation is telling you
The IEA has reported extreme backwardation, and CME described near-term crude, gasoline and ultra-low sulphur diesel (ULSD) as significantly above deferred prices. That is not a forecast of cheaper fuel. It reflects inventories so thin that the market pays a premium to pull barrels out of storage now.
Think of it like a builder holding timber during a shortage. If today’s price beats next year’s, selling now pays better than storing, so warehouses empty faster. CME noted exactly this effect: prompt premiums discourage commercial stockpiling and accelerate drawdowns.
For you, the lesson is to read the shape of the curve, not only the front-month number. A drop in a deferred contract does not mean cheaper diesel this month.
The backwardation spread between spot and one-year forward contracts measures how much of today’s price is fear premium, and a wide gap suggests the market expects the squeeze to fade even while physical barrels stay scarce.
Where is the real bottleneck: refineries, tankers and empty tanks?
If crude is flowing, the constraint must sit somewhere between the oilfield and the fuel nozzle. Walk the refining map and it appears in several places at once.
Refineries
US refineries are running near their limits. Crux Investor put utilisation at 92.7% on 12 October, which leaves little slack. US distillate stocks stand at 105.1 million barrels, about 12% below the five-year average, and operable capacity has slipped to 18.027 million b/d from 18.160 million a year earlier.
China has room to run, with utilisation reportedly around 75%, but it extended restrictions on diesel, marine-fuel and gasoil exports through 31 October. Some reports say it would make no refined-product exports at all in October.
Russia is worse off. Ukrainian attacks cut its refining capacity by as much as 60% in summer, with 2.2 million b/d still offline through August. Moscow has also extended its producer export ban on diesel and marine fuel through October.
| Region | Constraint | Key figure | Status |
|---|---|---|---|
| United States | Refineries near limits | 92.7% utilisation; distillates 12% below average | Little spare capacity |
| China | Export curbs | About 75% utilisation | Restrictions to 31 October |
| Russia | Refinery damage, export ban | 2.2 million b/d offline through August | Ban through October |
| Arabian Gulf | Products stranded | 25-35% of pre-war product flows | Severely impaired |
US refiners cannot simply fill the hole. Product specifications, regional logistics and export economics mean American barrels go where margins are highest, not where shortages are worst.
Tankers and stocks
Logistics compound the problem. Tanker shortages, higher lease rates, ship-to-ship transfers, security risk and insurance constraints are all slowing delivery, according to the IEA.
The IEA estimates diesel and gasoil availability fell 1.5 million b/d year on year in Q2 2026 and 1.7 million b/d in Q3 2026. Global inventories have drawn 507 million barrels since February. About 325 million barrels of emergency stocks have been released, with roughly 100 million still to come.
Because no region has spare diesel to share, one country’s fix does not become global relief. You should expect prices to stay elevated until several of these constraints ease together.
Investors exploring China’s role in easing the shortage can read our deep-dive into the structural diesel crisis, which estimates how extra Chinese exports could compress margins.
What does this mean for farmers, truckers and food costs?
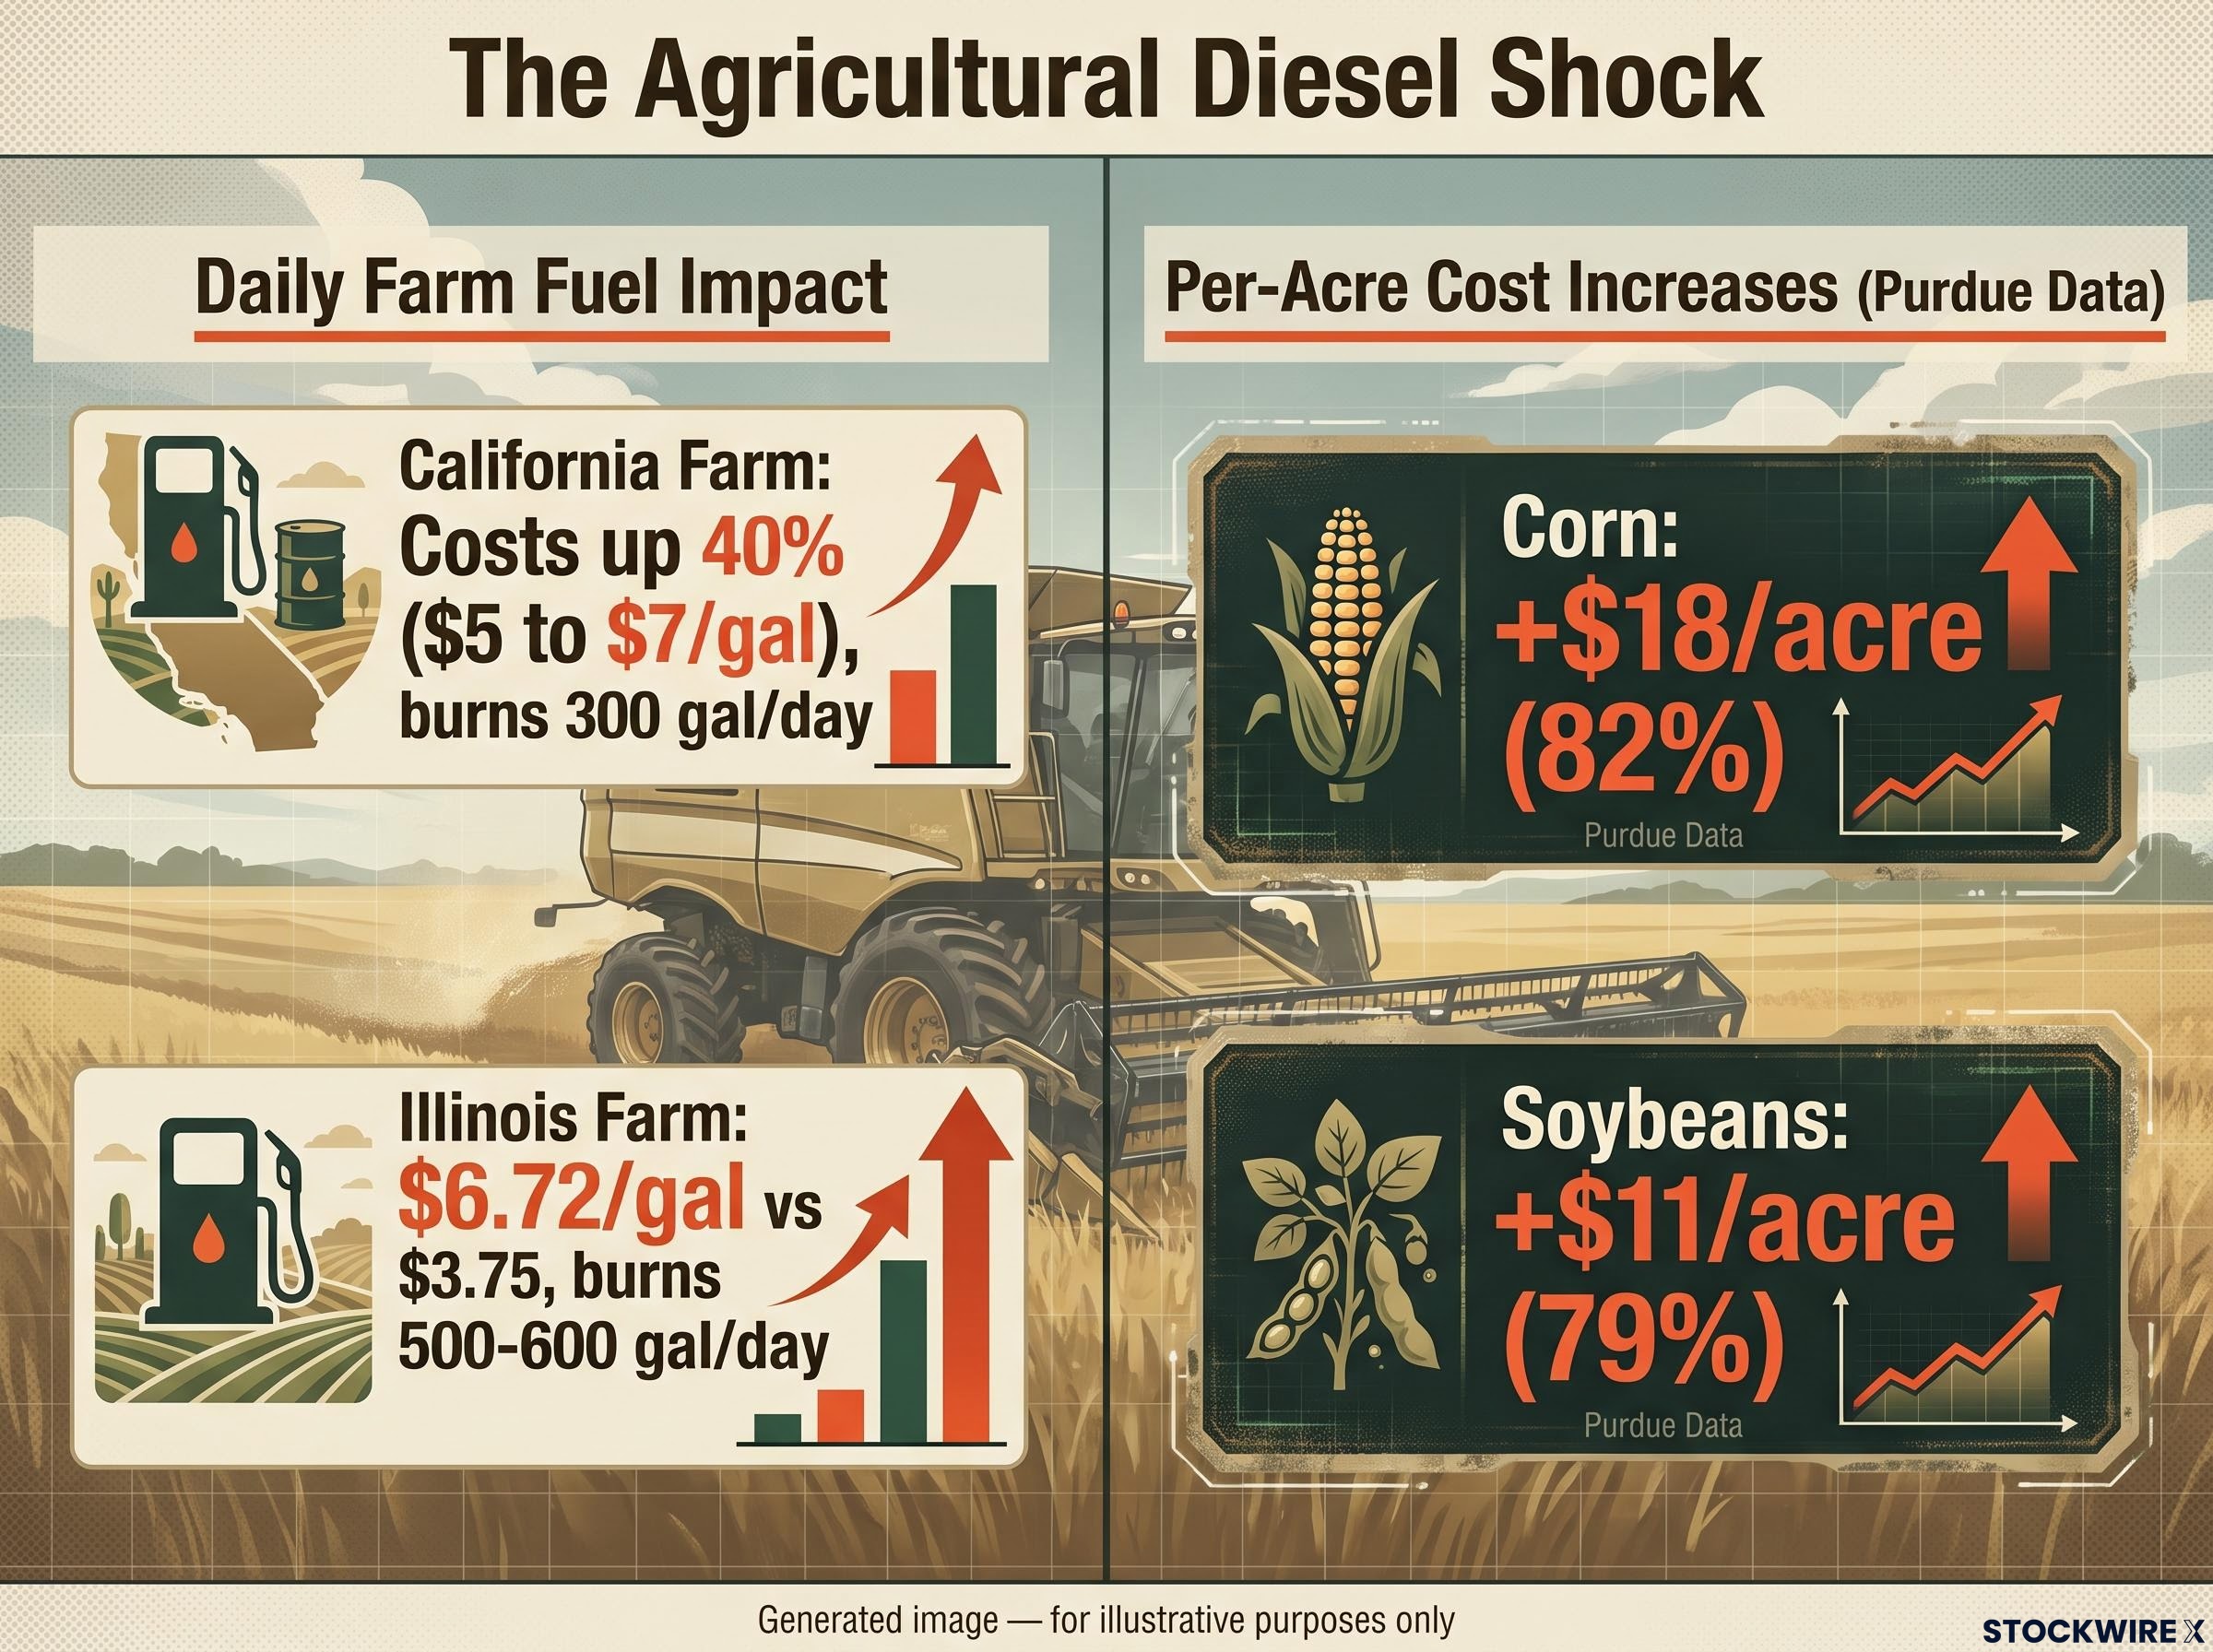
On one 600-acre California farm, fuel costs have risen about 40%, from roughly $5 to $7 a gallon, according to USA Today citing Reuters. The grower’s combine burns about 300 gallons a day during harvest.
An Illinois farm burns 500-600 gallons a day and pays $6.72 a gallon, against $3.75 a year earlier. Purdue University’s Michael Langemeier calculates fuel costs for corn are up $18 an acre (82%) and for soybeans $11 an acre (79%).
Timing makes it worse. Harvest is the most fuel-intensive season, and farmers have little ability to pass costs on. Truckers face the same squeeze, with a single fill-up now topping $1,000.
| Group | Effect | Figure | Source |
|---|---|---|---|
| US motorists and fleets | Record diesel prices | $6.53/gal on 22 September; $6.28 on 8 October | Strategic Energy Map |
| National average | Year-on-year jump | $6.30/gal, over 70% higher | AAA |
| Corn and soybean growers | Higher fuel per acre | +82% and +79% | Purdue |
| Food prices | Added inflation | 0.2-0.4 percentage points | Goldman Sachs |
David Ortega, Michigan State University Diesel increases raise costs at every stage, from harvest through to the grocery shelf.
Goldman Sachs estimates persistent diesel inflation could add 0.2-0.4 percentage points to food-price inflation, with diesel making up about 5-10% of agricultural input costs. Diesel works like a hidden tax on the food chain, so even if you never fill a truck, you will likely see it at the checkout.
Can sanctions relief, price controls or reserves fix it, and what does it mean for investors?
Governments have reached for several levers. Each moves barrels or prices in some way, but the useful question for you is whether it creates any new diesel.
The policy toolkit
The G7 announced a coordinated release of 100 million barrels over four months, with diesel front-loaded in the first 20 days (USA Today, 2 October). President Donald Trump had threatened to ban US diesel exports to Europe, and reportedly a 50% tariff, before ruling the ban out (Politico, AP). On 6 October he allowed highway use of tax-free dyed diesel and deferred the federal diesel excise tax through year-end, which farmers and economists called limited relief.
| Lever | Supporters say | Critics say | Net effect |
|---|---|---|---|
| Reserve releases | Bridge the gap until refineries recover | Temporary; Hanke says European releases were already scheduled | Buys time |
| Russian sanctions relief | Could add physical supply | Weakens leverage; refineries still damaged | Limited; no diesel delivered yet under the proposed deal |
| Tariffs and export threats | Pressure allies to share stocks | Redirect barrels rather than add them | Shifts supply |
| Price controls and tax cuts | Ease posted prices | Hanke cites 1979 queues and shortages | Treats the symptom |
Hanke argues sanctions relief offers little while Ukraine keeps damaging Russian plants, and points to a US heating-oil crack spread (the margin between crude and the refined product) of $117 a barrel. No newly published estimate quantifies what price controls would do in 2026.
The crack spread is the margin a refiner earns between a barrel of crude and the products it yields, and when it runs at several times its normal range, you are looking at a shortage that sits in refining rather than in crude supply.
What it means for energy investors
The IEA expects diesel to stay tight well into 2027, with consumption not returning to growth until March 2027; the original source cited tightness into late 2027. It forecasts 2026 oil demand falling 2.6 million b/d, with diesel about a quarter of that drop.
That backdrop favours diesel, gasoil, tankers and refiners with crude and export access over crude-only exposure. Still, StoneX highlights a forecast split: the IEA sees demand destruction, OPEC sees resilience and the US Energy Information Administration (EIA) sees gradual normalisation. Key risks include:
- Further demand destruction
- Policy intervention, including price controls
- Sanctions relief on Russian diesel
- Additional reserve releases
- Sudden supply restoration if tankers normalise and China and Russia resume exports
If those constraints ease together, premiums could unwind quickly. Judge each headline by whether it adds physical diesel.
Past performance does not guarantee future results. These statements are speculative and subject to change based on market developments.
What the data says about relief, and what to watch next
As of mid-October 2026, the pressure on your fuel bill comes from a product shortage, not a crude shortage. Crude is flowing again; refining capacity, shipping and inventories have not caught up. Forecasts diverge, so watch the evidence rather than the headline.
- Gulf refined-product flows climbing above the 25-35% range
- Chinese and Russian export decisions after October
- US distillate stocks closing the 12% gap to the five-year average
- The backwardation spread narrowing between prompt and deferred contracts
If you are a farmer or trucker, these tell you when to lock in fuel. If you are an investor, they tell you when the refined-product premium is starting to fade.
This article is for informational purposes only and should not be considered financial advice. Investors should conduct their own research and consult with financial professionals before making investment decisions.