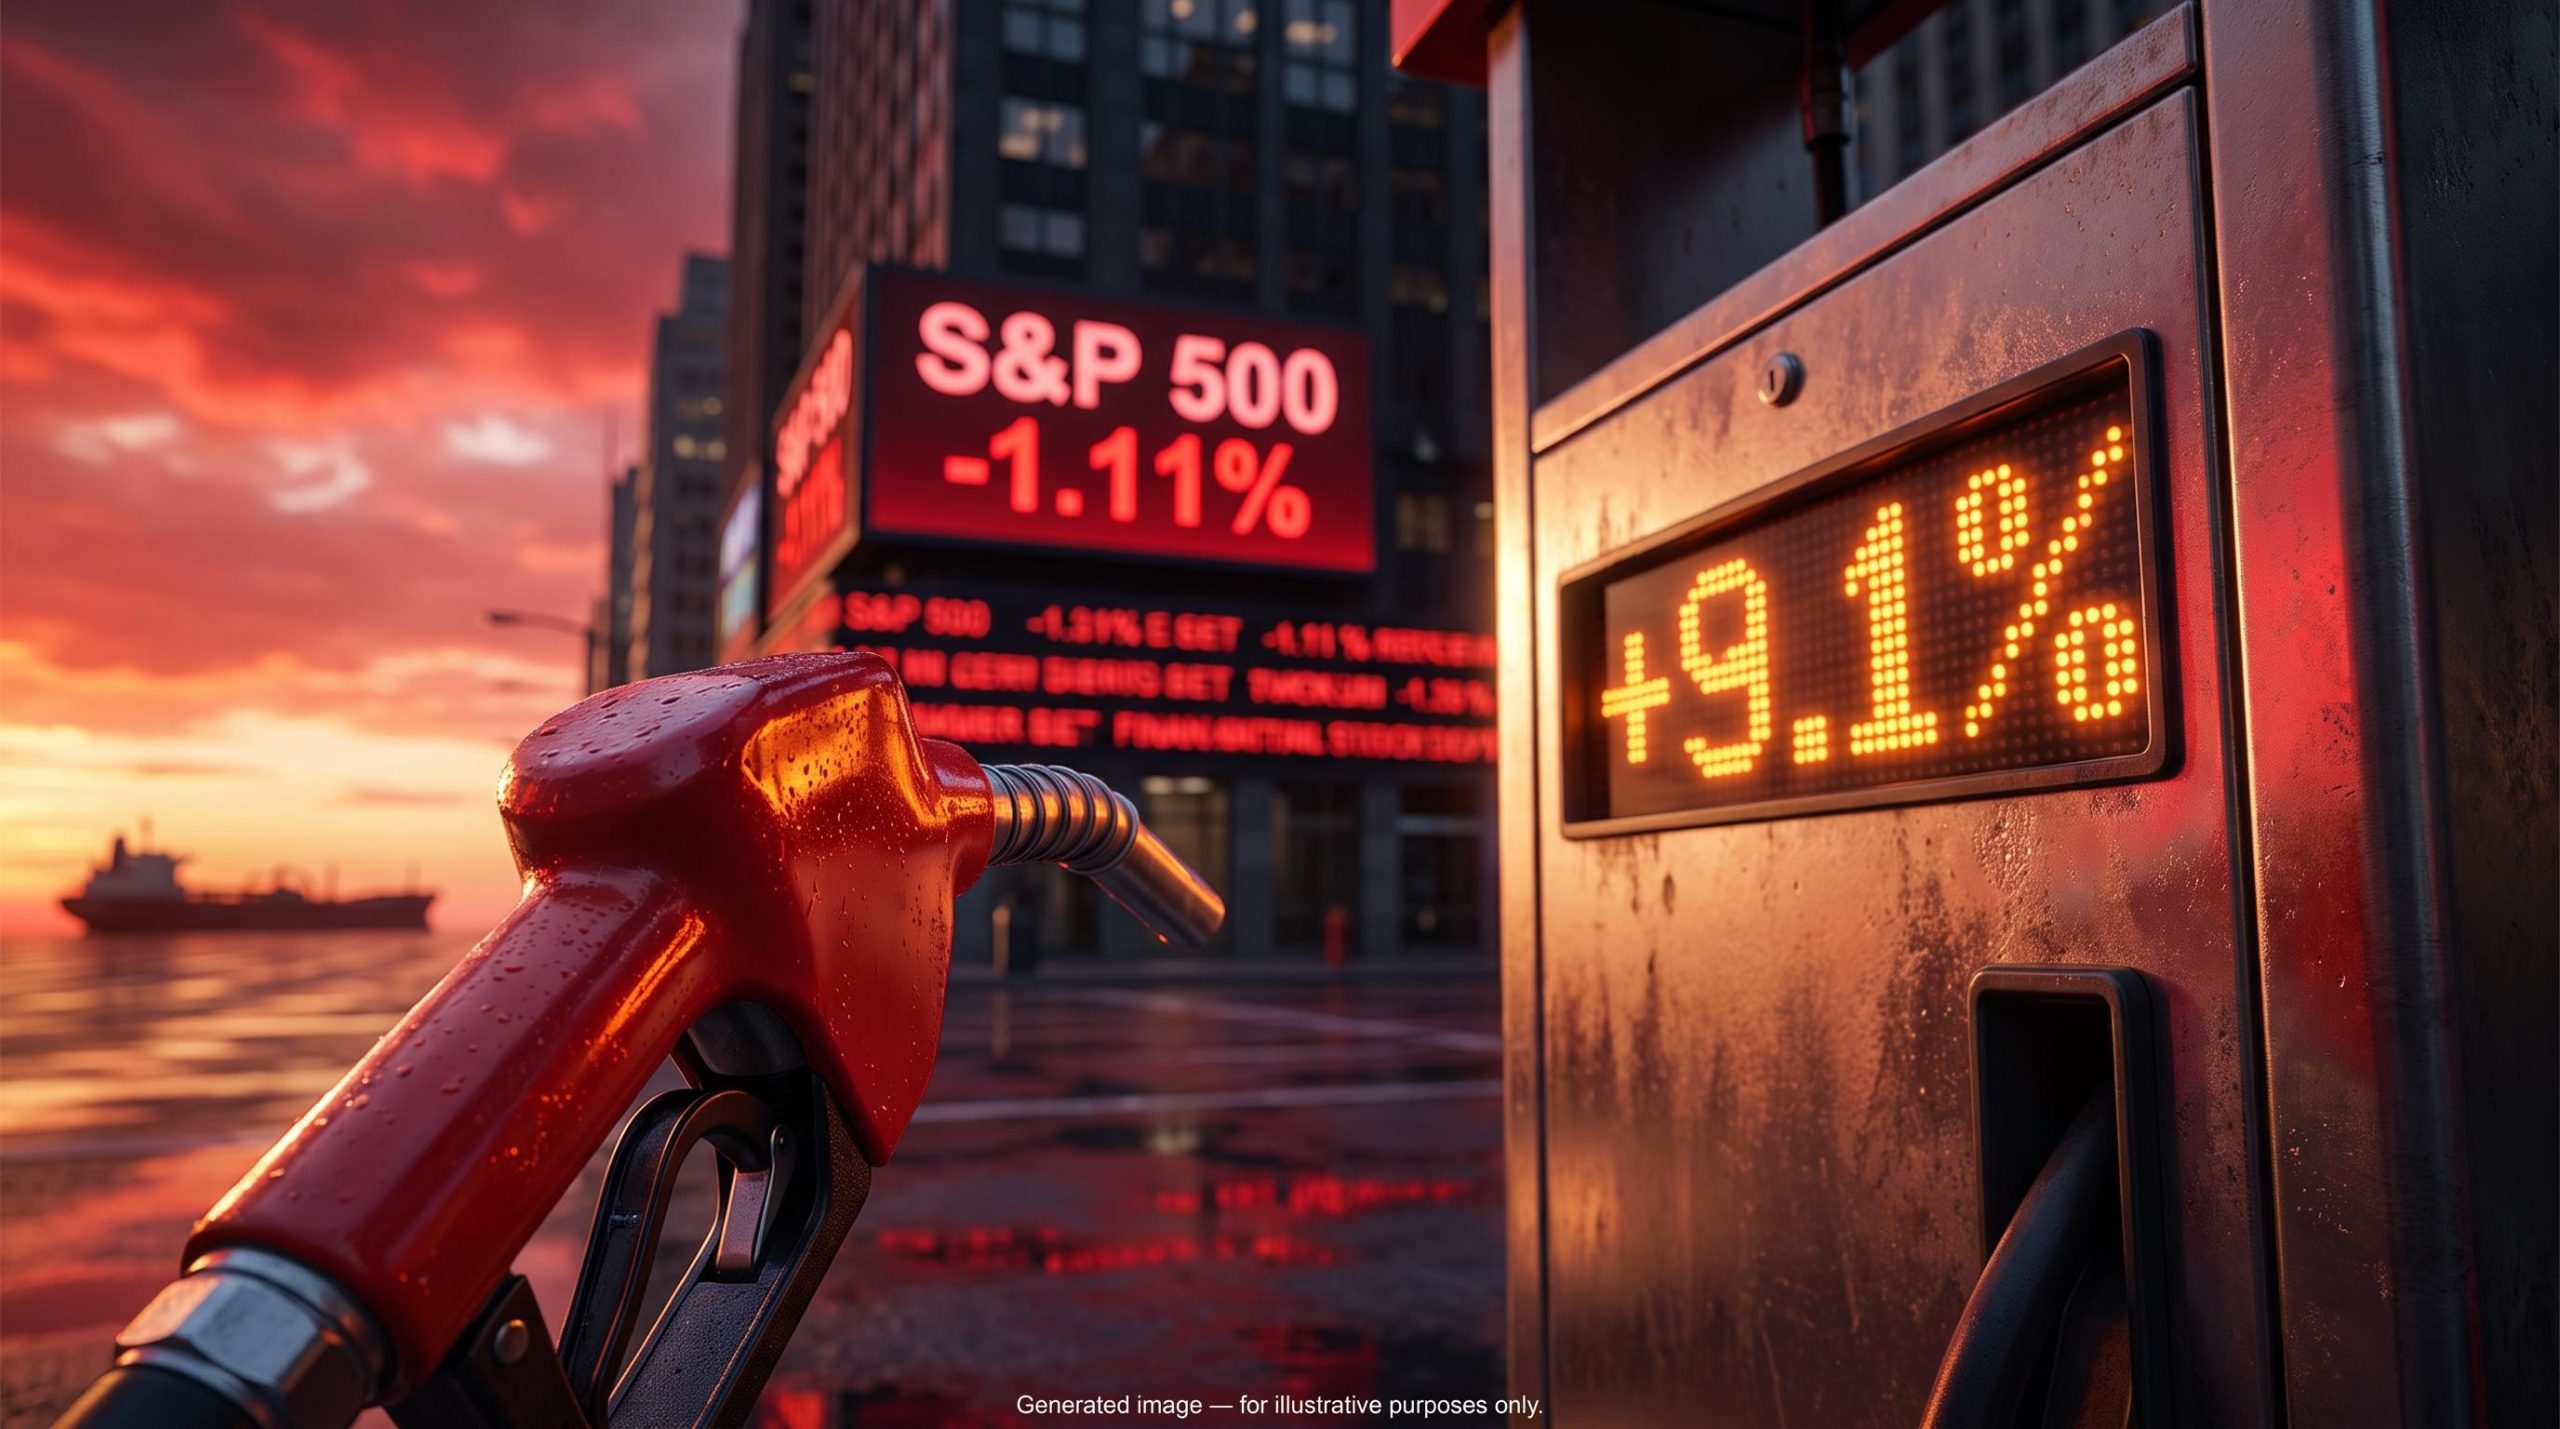
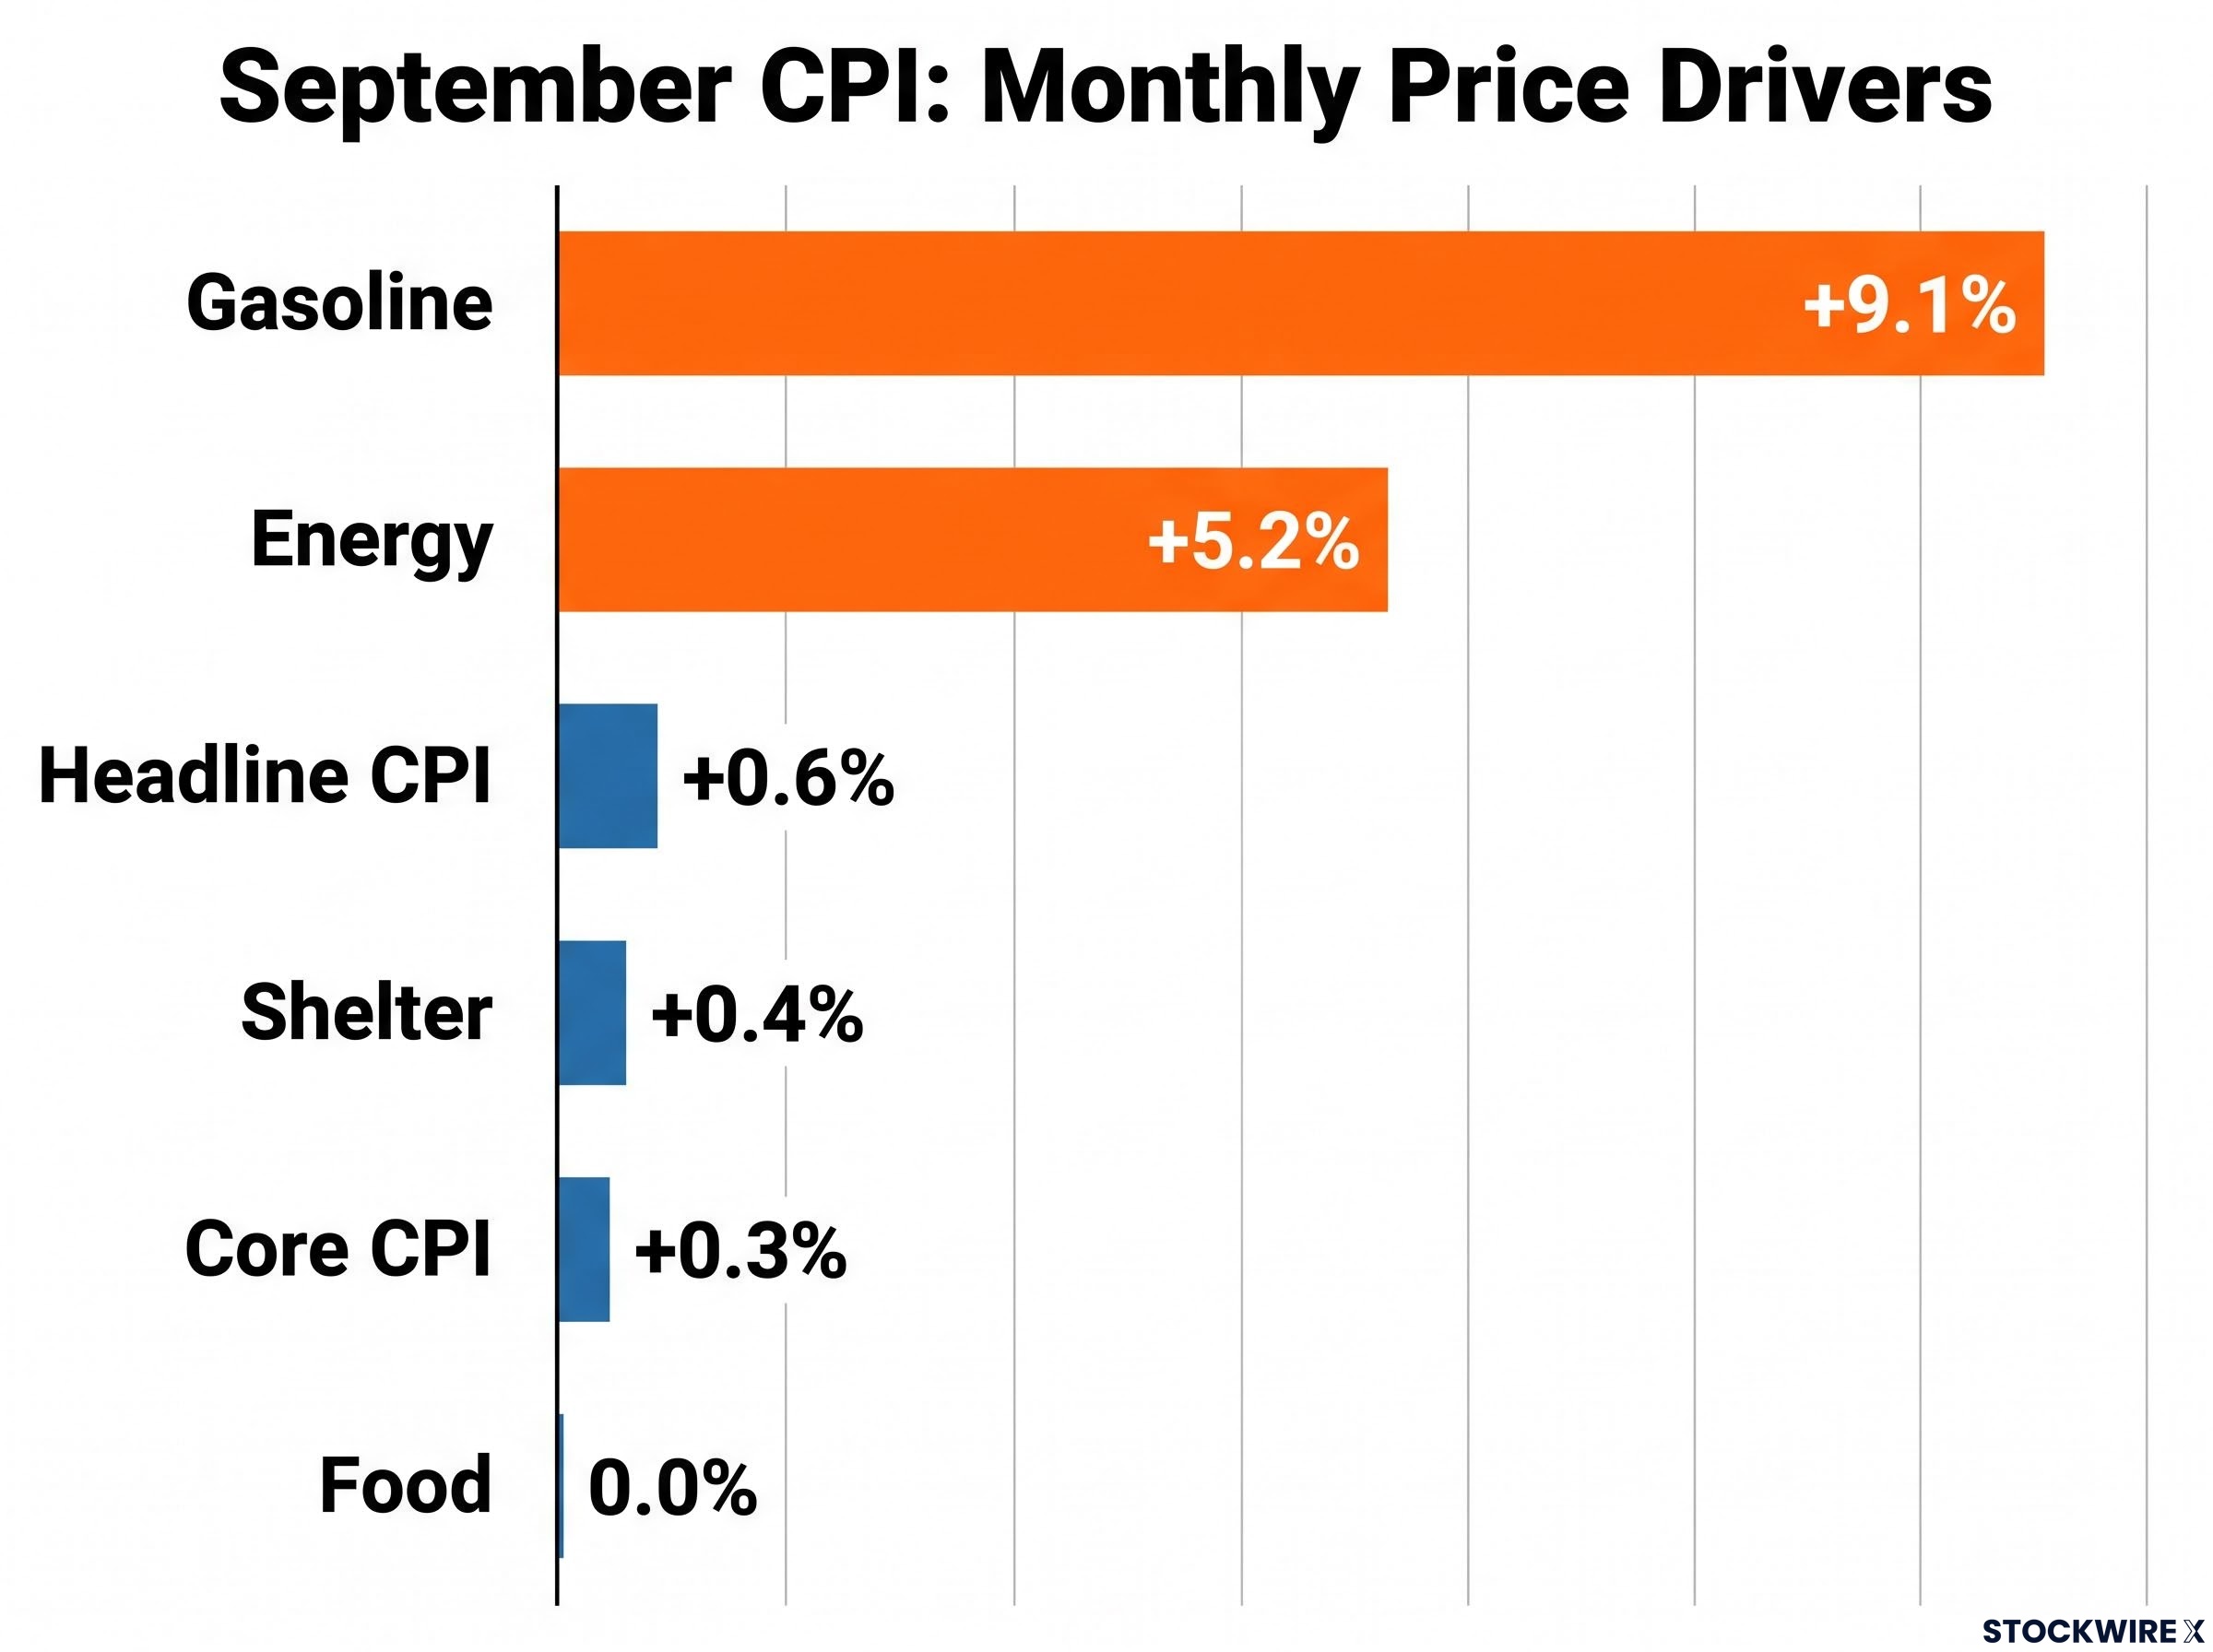
September’s consumer price index (CPI) report came in hotter than forecast on Wednesday, with headline inflation up 0.6% for the month and 3.7% over the year, and core up 0.3% and 2.6%. Stocks took the hit, with the S&P 500 down 1.11% and the Nasdaq down 1.88%, yet the 10-year Treasury yield finished well below its post-release high.
Energy did most of the damage. Gasoline costs tied to disruptions in the Strait of Hormuz pushed the headline figure up, but the familiar rule that hot inflation means higher bond yields broke down by the close. For anyone holding both stocks and bonds, that split decides whether a portfolio’s hedge actually worked.
Here is why equities and Treasuries parted ways, which index levels are under pressure, and the dated events this week (producer prices, retail sales and a speech by Fed Chair Kevin Warsh) that could settle the argument.
Why did stocks and silver fall while bond yields gave back their jump?
The numbers hit at 8:30 a.m. ET: headline CPI up 0.6% against a 0.5% consensus, core up 0.3% against 0.2%. For a few minutes, every market moved the way the rulebook said it should.
Then the bond market changed its mind.
| Asset | Level or move | Note |
|---|---|---|
| S&P 500 | -1.11%, 7,718.94 | Broad risk-off |
| Nasdaq | -1.88%, 26,692.87 | Tech hit hardest among large caps |
| Russell 2000 | -1.93%, 2,729.531 | Small caps weakest |
| Silver | Down more than 6%, about $55.60 | Higher risk sensitivity |
| Gold | Down about 2%, near $4,075/oz | Held its recent base |
| 2-year Treasury | About 4.81% | After about 4.95% intraday |
| 10-year Treasury | About 5.19% close | Jump faded; sources differ on the high |
Equities and metals
Small caps and tech led the decline, the two corners of the market most exposed to borrowing costs. Precious metals offered no shelter. Silver’s fall of more than 6% was roughly three times gold’s, consistent with silver trading more like a risk asset than a safe haven.
Higher yields normally pressure equities through the discount-rate channel, which lowers the present value of future cash flows and hits long-duration sectors such as technology first, even when earnings expectations are unchanged.
Rates and currencies
Ilya Spivak, head of global macro at tastylive, said the long-end jump was fully erased on a 15-minute chart. The 2-year briefly dropped to cycle lows from late September before recovering. One digest cites a 10-year session high near 5.32%, against investingLive’s 5.19% close, but both agree on the shape: a spike, then a fade.
Rate futures followed the same arc. Odds of a hike at the 27-28 October Federal Open Market Committee (FOMC) meeting jumped from about 22% to roughly 47-50%, before settling near 32%. Currencies barely flinched: the euro slid then returned to its range, the pound held support, the Australian dollar stayed inside its seven-day band, and Bitcoin did not rally on the hawkish story.
Bonds refusing to sell off tells you the market did not see this print as a reason to own less duration. If you assumed hot inflation automatically hurts stocks and bonds together, this session showed otherwise.
Is the market reading this CPI as a growth scare rather than a case for more Fed hikes?
The dominant reading starts with what drove the number. Gasoline rose 9.1% in the month (34.2% over the year) and energy 5.2% (20.4% annually), with gasoline alone accounting for more than half of the monthly increase.
An energy supply shock lifts prices while draining household budgets. That raises the risk of recession or stagflation (rising prices alongside stalling growth), which pulls money into Treasuries once the first hike scare passes.
The clearest evidence sits in breakeven inflation rates, the market’s implied inflation expectation derived from inflation-protected bonds. According to Spivak, breakevens stayed flat or fell while oil climbed.
The growth-scare read Spivak’s interpretation is that the hot print signals a Fed unable to respond enough to a weakening economy, pointing towards a cyclical downturn. That would explain falling stocks without a bond selloff.
Reuters and Newsquawk both reported that worries about AI financing amplified the equity selloff. The Atlanta Fed’s GDPNow model, a running estimate rather than a forecast, put Q3 growth at 3.6% on 8 October, down from 3.7%.
The hawkish case is not weak, though.
Growth-scare evidence:
- Long-end yields erased their jump
- Breakevens failed to follow oil higher
- AI-financing stress hit high-valuation stocks
More-hikes evidence:
- Core rose 0.3%, above forecast
- Shelter accelerated to 0.4% from 0.3% in August; core services ran about 0.4%
- Citi expects a December hike, with December odds near 94%
Food was flat at 0.0%, with food at home down 0.1%, so this was not broad price pressure everywhere. Fed voices urged patience: Chicago Fed President Austan Goolsbee called the report discouraging but favoured waiting, and Governor Michelle Bowman saw no urgency for further action. Markets still price 2027 tightening the Fed has not endorsed, with intraday estimates ranging from about 50 to 75 basis points.
Comparisons with the 1970s oil shocks and 2022 are circulating, but fading yields set this episode apart so far. If the growth-scare reading holds, a hot print can hurt your stocks without hurting your bonds. If core keeps running at 0.3% or more, the hawkish case regains ground quickly.
Investors exploring the gap between FOMC projections and market pricing can follow our detailed coverage of the Fed rate hike outlook, including the split in the committee’s dot plot.
What to watch next: PPI, retail sales, the Warsh speech and key index levels
The unresolved question now meets a tight calendar.
| Event | Date and time (ET) | Consensus | What it tests |
|---|---|---|---|
| September PPI | Thu 15 October, 8:30 a.m. | +0.5% headline, +0.3% core | Whether the CPI rise was energy-only |
| September retail sales | Thu 15 October, 8:30 a.m. | Not available | Signs of consumer strain |
| Warsh at the IMF | Fri 16 October, morning | No expectations found | Fed tone on the gas-price shock |
| FOMC meeting | 27-28 October | Hold expected, hike seen in December | Policy path |
The producer price index (PPI) measures prices businesses receive, so a firm core reading would suggest cost pressure spreading beyond fuel. Some analysts expect retail sales to show consumer strain, though no formal consensus was available. Warsh, appearing alongside IMF head Kristalina Georgieva, has said his aim is to stop the gas-price shock from spreading.
A soft retail sales number alongside a hot PPI would reinforce the stagflation reading. That is the combination to watch if you are weighing whether to add or trim equity risk.
Index levels in focus
Spivak treats the S&P 500 as the main gauge of risk sentiment. For the Nasdaq, a recent failed breakout has pushed price back onto an old ceiling that is now serving as a floor, and losing it would open the way to further weakness. The Russell has already slipped beneath a significant threshold, which may leave it exposed to more downside.
Spivak himself is positioned bearishly on risk, though that is one analyst’s view. There is also a caveat on bonds: heavy long-end Treasury supply and term premium (the extra yield investors demand to hold longer debt) can keep yields elevated, so the fade does not prove inflation worries have vanished.
Goldman Sachs strategists had described the bond market threat to equities as the key constraint on gains, a view that explains why long-end supply and term premium remain a caveat even after the fade.
Reading the next two days without overreacting to one print
The print was hot, and energy explains most but not all of it. Even so, the market’s reaction pointed more to growth worry than fear of hikes. What decides the next move is whether core strength proves persistent or turns out to be a secondary effect of the energy shock.
Check PPI and retail sales together on Thursday, then weigh Warsh’s tone on Friday before drawing conclusions about your stock and bond mix.
This article is for informational purposes only and should not be considered financial advice. Investors should conduct their own research and consult with financial professionals before making investment decisions. Past performance does not guarantee future results. Financial projections and market-implied probabilities are subject to market conditions and various risk factors.
—