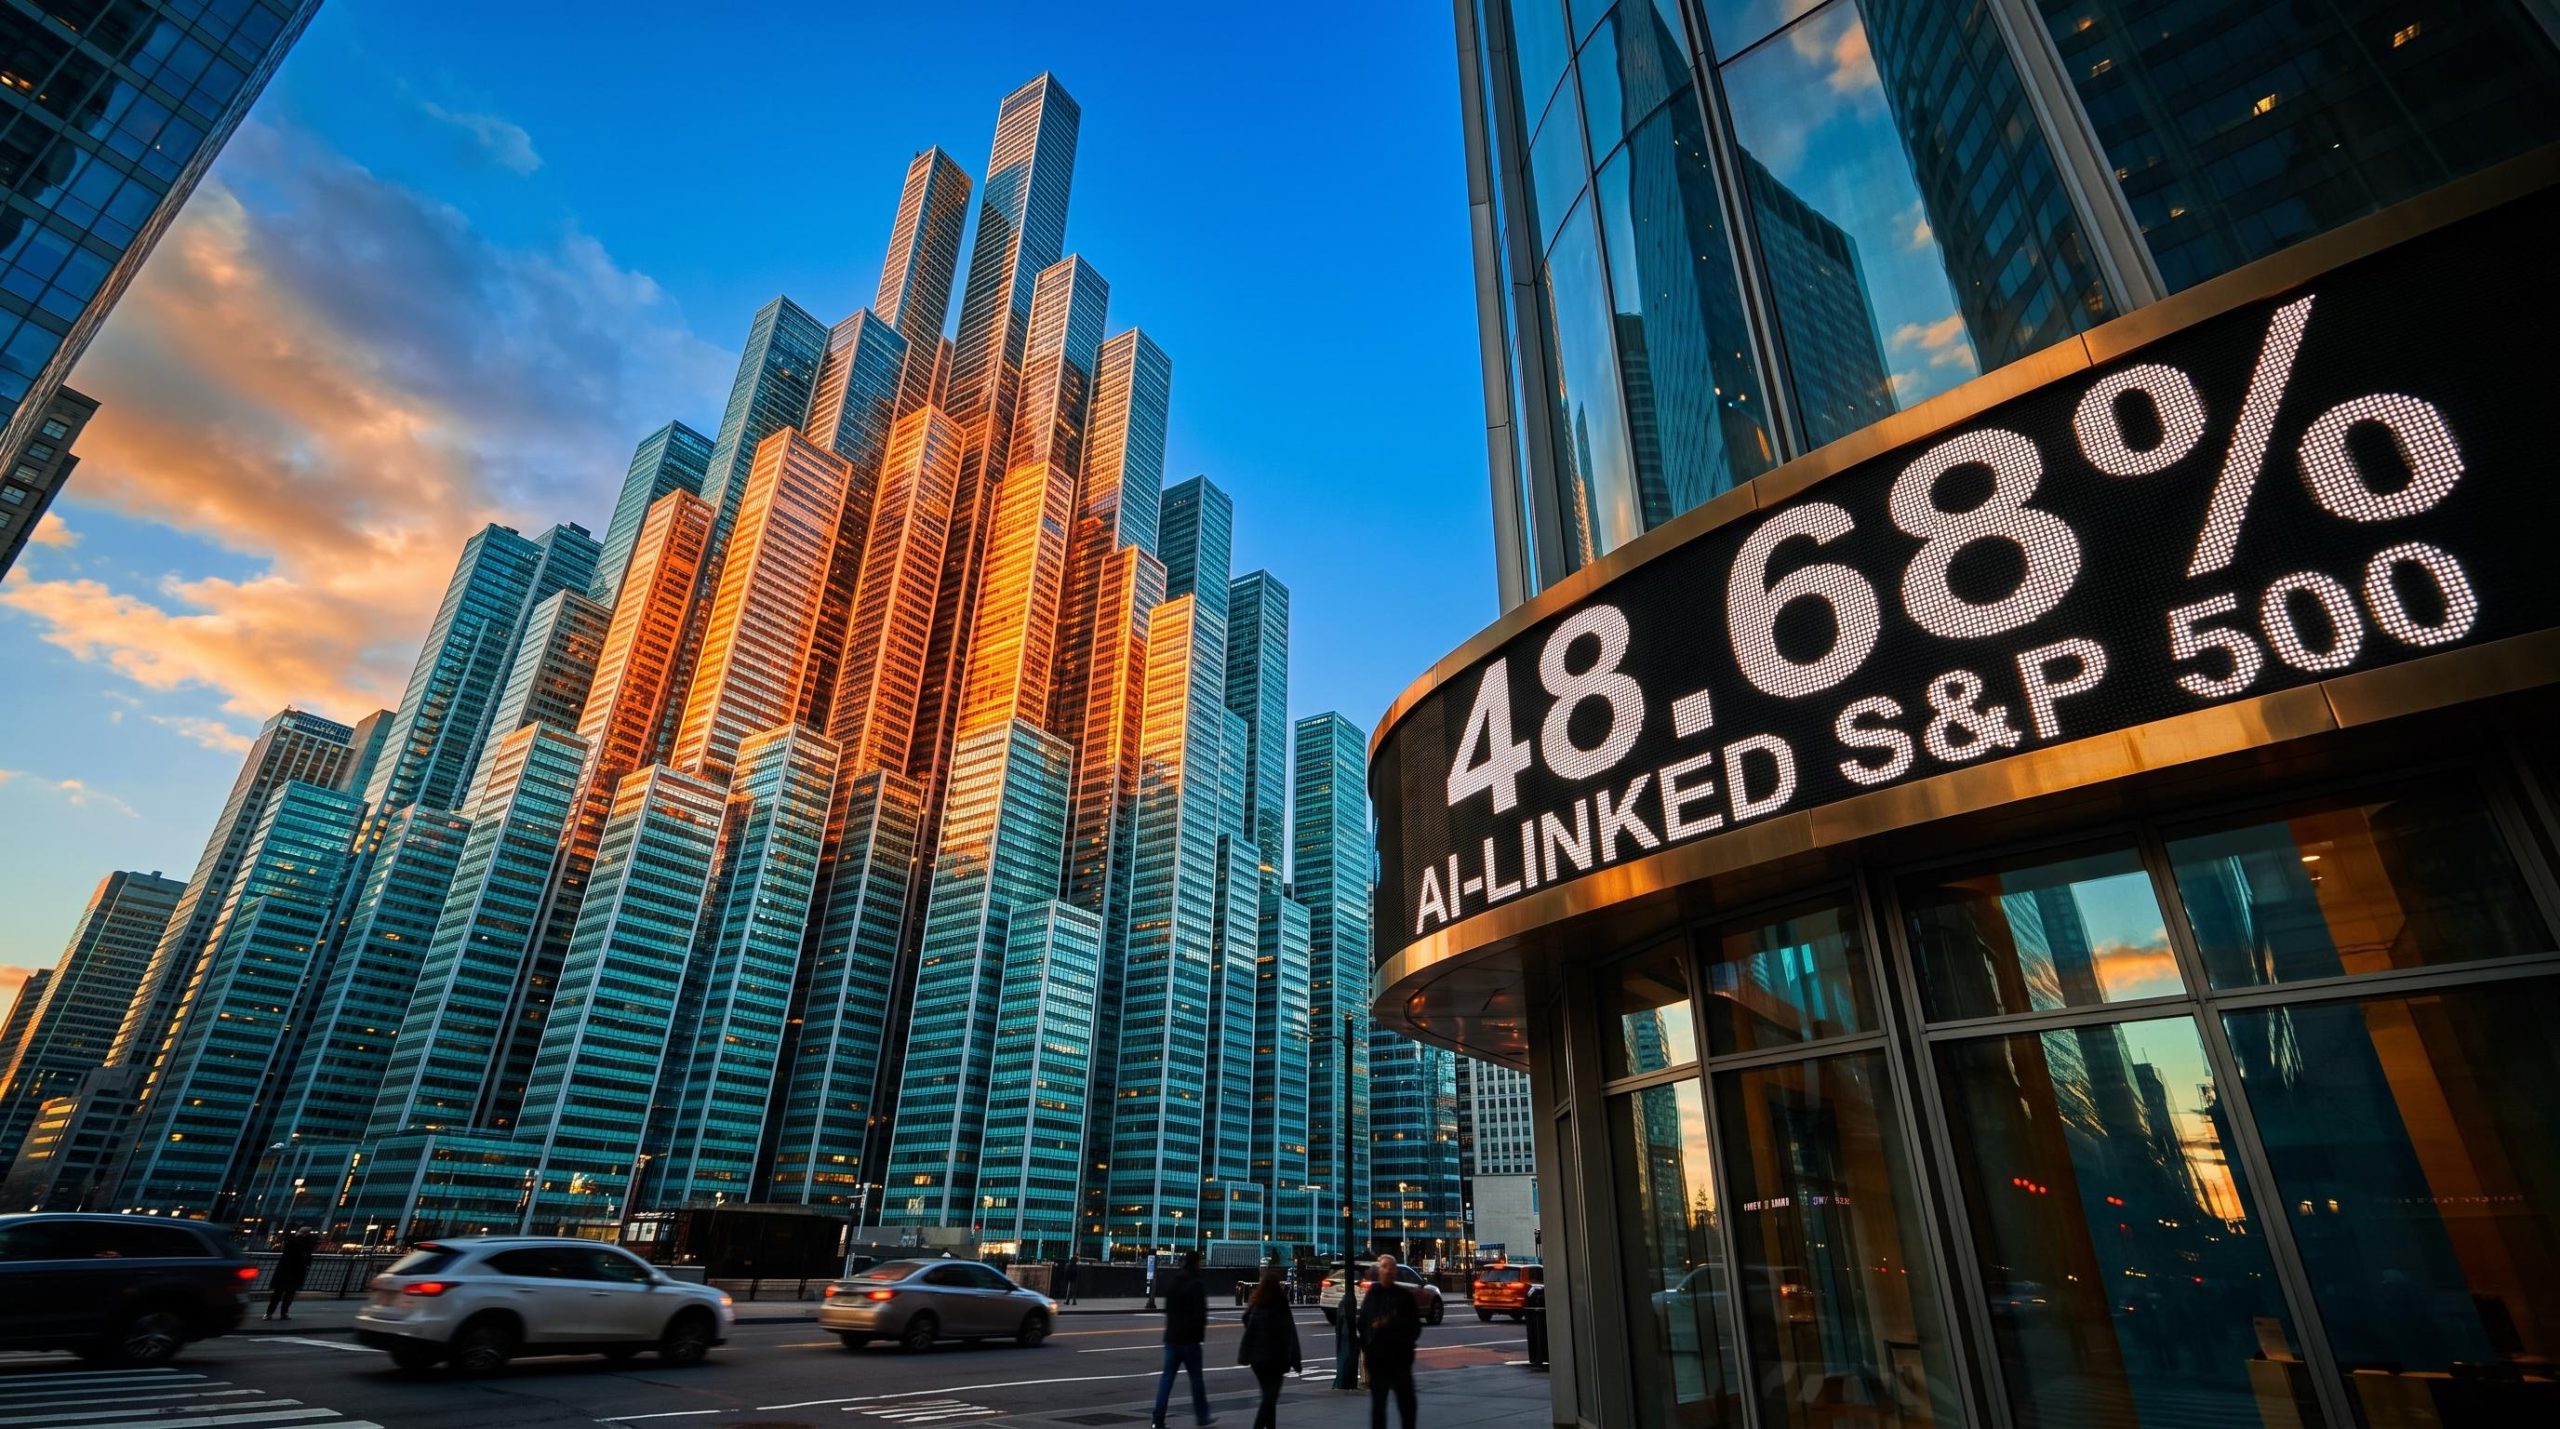
Owning an S&P 500 fund feels like owning 500 separate bets. It is closer to one large bet with 500 names attached. By J.P. Morgan’s classification, 41 companies tied to the artificial intelligence (AI) cycle now make up roughly 49% of the index. That level of AI concentration in the S&P 500 is higher than the market reached in 1929 or 2000.
The timing matters. The spending that lifts these companies is also pushing inflation up and holding interest rates high. Those two forces put pressure on valuations and on the debt that is paying for the build-out.
The useful question is not whether this is a bubble. It is what this concentration means for your portfolio.
Here is how today’s concentration compares with past episodes, how the loop between inflation and debt creates the risk, and the specific checks you can run on your own exposure.
How concentrated is the S&P 500 in AI, and why does the number vary?
The 48.68% figure, measured by J.P. Morgan on 9 October 2026, stands out. But it is one measure among several, and each answers a different question.
J.P. Morgan’s group covers 29 direct AI companies, 8 utilities and 4 capital-equipment makers. That is a broad net. It captures firms that sell power or machinery to data centres, not only the companies building AI models. Goldman Sachs uses a basket of AI enablers and arrives at about 45%.
| Measure | Figure | What it includes | Date |
|---|---|---|---|
| J.P. Morgan AI-linked share | 48.68% | 41 firms: AI developers, utilities, capital equipment | 9 October 2026 |
| Goldman Sachs AI-enabler basket | About 45% | Beneficiaries of AI infrastructure and demand | 7 October 2026 |
| Top-10 weighting | About 43% | Ten largest companies, mostly tech and AI-linked | June 2026 |
| Top-10 weighting (alternative) | 40.7%-40.8% | Ten largest by market capitalisation | End-2025 to May 2026 |
The top-10 measure is narrower and is not the same thing as AI exposure. Even so, it sits at nearly double the 18%-23% range of 1990-2015, and well above the late-1990s peak of 26.6% reported by J.P. Morgan Asset Management (about 27% in RBC’s series).
Concentration without a bubble call Dan Lefkovitz of Morningstar Indexes argues that you do not have to believe in a bubble to be concerned about concentration. A cap-weighted index can end up dominated by a single theme even when its members are high quality.
The read for you is direct. A fall in a handful of AI-linked names, or their suppliers, reaches your fund through overlapping holdings at the same time.
Passive holders carry record market concentration by default, since roughly half of S&P 500 exposure now sits in ETFs that mechanically buy more of whatever has already grown largest.
When big ASX news breaks, our subscribers know first
What do railroads, the Nifty Fifty and the dot-com era teach about concentrated markets?
Today’s figure only means something against history, and history offers several reference points.
Bubble versus real technology
Market concentration means a small group of companies makes up a large share of an index’s total value. A bubble is something narrower: prices that have drifted away from the earnings and cash flows a business can realistically produce.
The two are easily confused. Railroads in the 1880s changed the American economy, yet according to Bank of America analysis cited by Lloyds Bank, investors who paid for extraordinary future growth endured severe volatility and long underperformance as competition, overbuilding and financing problems took hold. A useful technology can still hurt buyers who pay too much for it.
| Episode | Concentration | Emphasis | Outcome |
|---|---|---|---|
| 1880s railroads | ~63% | Paying for extraordinary future growth | Long underperformance from overbuilding and financing strain |
| 1929 | ~36% | Narrow leadership, extreme optimism | Prolonged depression |
| Nifty Fifty, early 1970s | ~40% | “One-decision” stocks bought at any price | 1973-74 bear market |
| March 2000 | ~41% | Extrapolated capex, weaker earnings | S&P 500 fell about 49% to October 2002 |
| Current AI cycle | ~49% | Strong earnings alongside concentration | Unresolved |
The recovery after 2000 is often quoted as 13 years. On a total-return basis, which counts reinvested dividends, the index reached a new high in October 2006, after a drawdown of about 42%. The longer figure probably rests on a different measure, such as price-only, inflation-adjusted or Nasdaq data, so a range of roughly six to 13 years is the honest answer.
Today’s leaders earn far more than the 2000 cohort did. That is real, but recovery time depends on starting valuation, leverage, the speed of earnings growth and whether capex builds excess capacity. A diversified investor in 2000 got back to even sooner than one concentrated in the leading theme, which tells you the cost of concentration is counted in years, not just percentage points.
Why is AI spending pushing inflation higher, and what has the Fed done about it?
The concentration story turns into a rates story through inflation, and Goldman’s own forecast miss shows how.
The 0.7-point miss In January, Goldman forecast August 2026 core PCE inflation at about 2.3%. The actual figure came in near 3.0%. Its review pointed to chips, laptops, memory and software, not oil or tariffs, as the largest factor.
Core PCE (personal consumption expenditures) is the Federal Reserve’s preferred gauge of underlying inflation, excluding food and energy. Goldman economists Rindels and David Mericle estimate AI is adding about 45 basis points to it, peaking near 50 bp by end-2026 before easing to about 10 bp by end-2027. Roughly half is genuine price pressure and half is measurement effects.
The mechanism runs through five channels:
- Memory and chip prices. J.P. Morgan estimates DRAM prices could rise more than 400% from early 2024 to end-2026, feeding into phones, laptops and servers.
- Electricity and construction. Five major US hyperscalers could spend about $697 billion on capex in 2026.
- Inflation before productivity. J.P. Morgan Asset Management notes the spending arrives before the efficiency gains.
- Higher rates. Persistent inflation limits Fed easing and lowers the present value of distant profits.
- Debt-funded infrastructure. Building on borrowed money adds refinancing risk.
Software prices are also rising for the first time as AI features justify higher charges. One commentator claims the next iPhone may cost about $300 more due to memory prices, though that figure is unverified.
The Fed raised rates in September 2026. Views on what comes next diverge: markets have priced another hike, while Goldman expects cuts in December 2026 and March 2027. The catch is that Microsoft, Amazon and Meta are described as insensitive to rates, so tightening does little to slow the spending. You should not count on quick rate relief to prop up growth-stock valuations.
Core PCE has run above 3% in every month of 2026, and the Fed does not project a return to its 2% target until 2029, which limits how quickly policy relief can arrive.
Where does debt and refinancing risk enter, and what does Temasek fear?
Higher rates matter most where the building is paid for with borrowed money.
The debt build-up
According to IESE Insight, AI-related corporate issuance reached about $152 billion in the first 4.5 months of 2026, with around $300 billion expected for the year. Alphabet, Amazon, Meta and Oracle issued about $93 billion of US investment-grade bonds in 2025, and the five largest hyperscalers raised about $121 billion in a later wave, including an $18 billion Oracle sale in September.
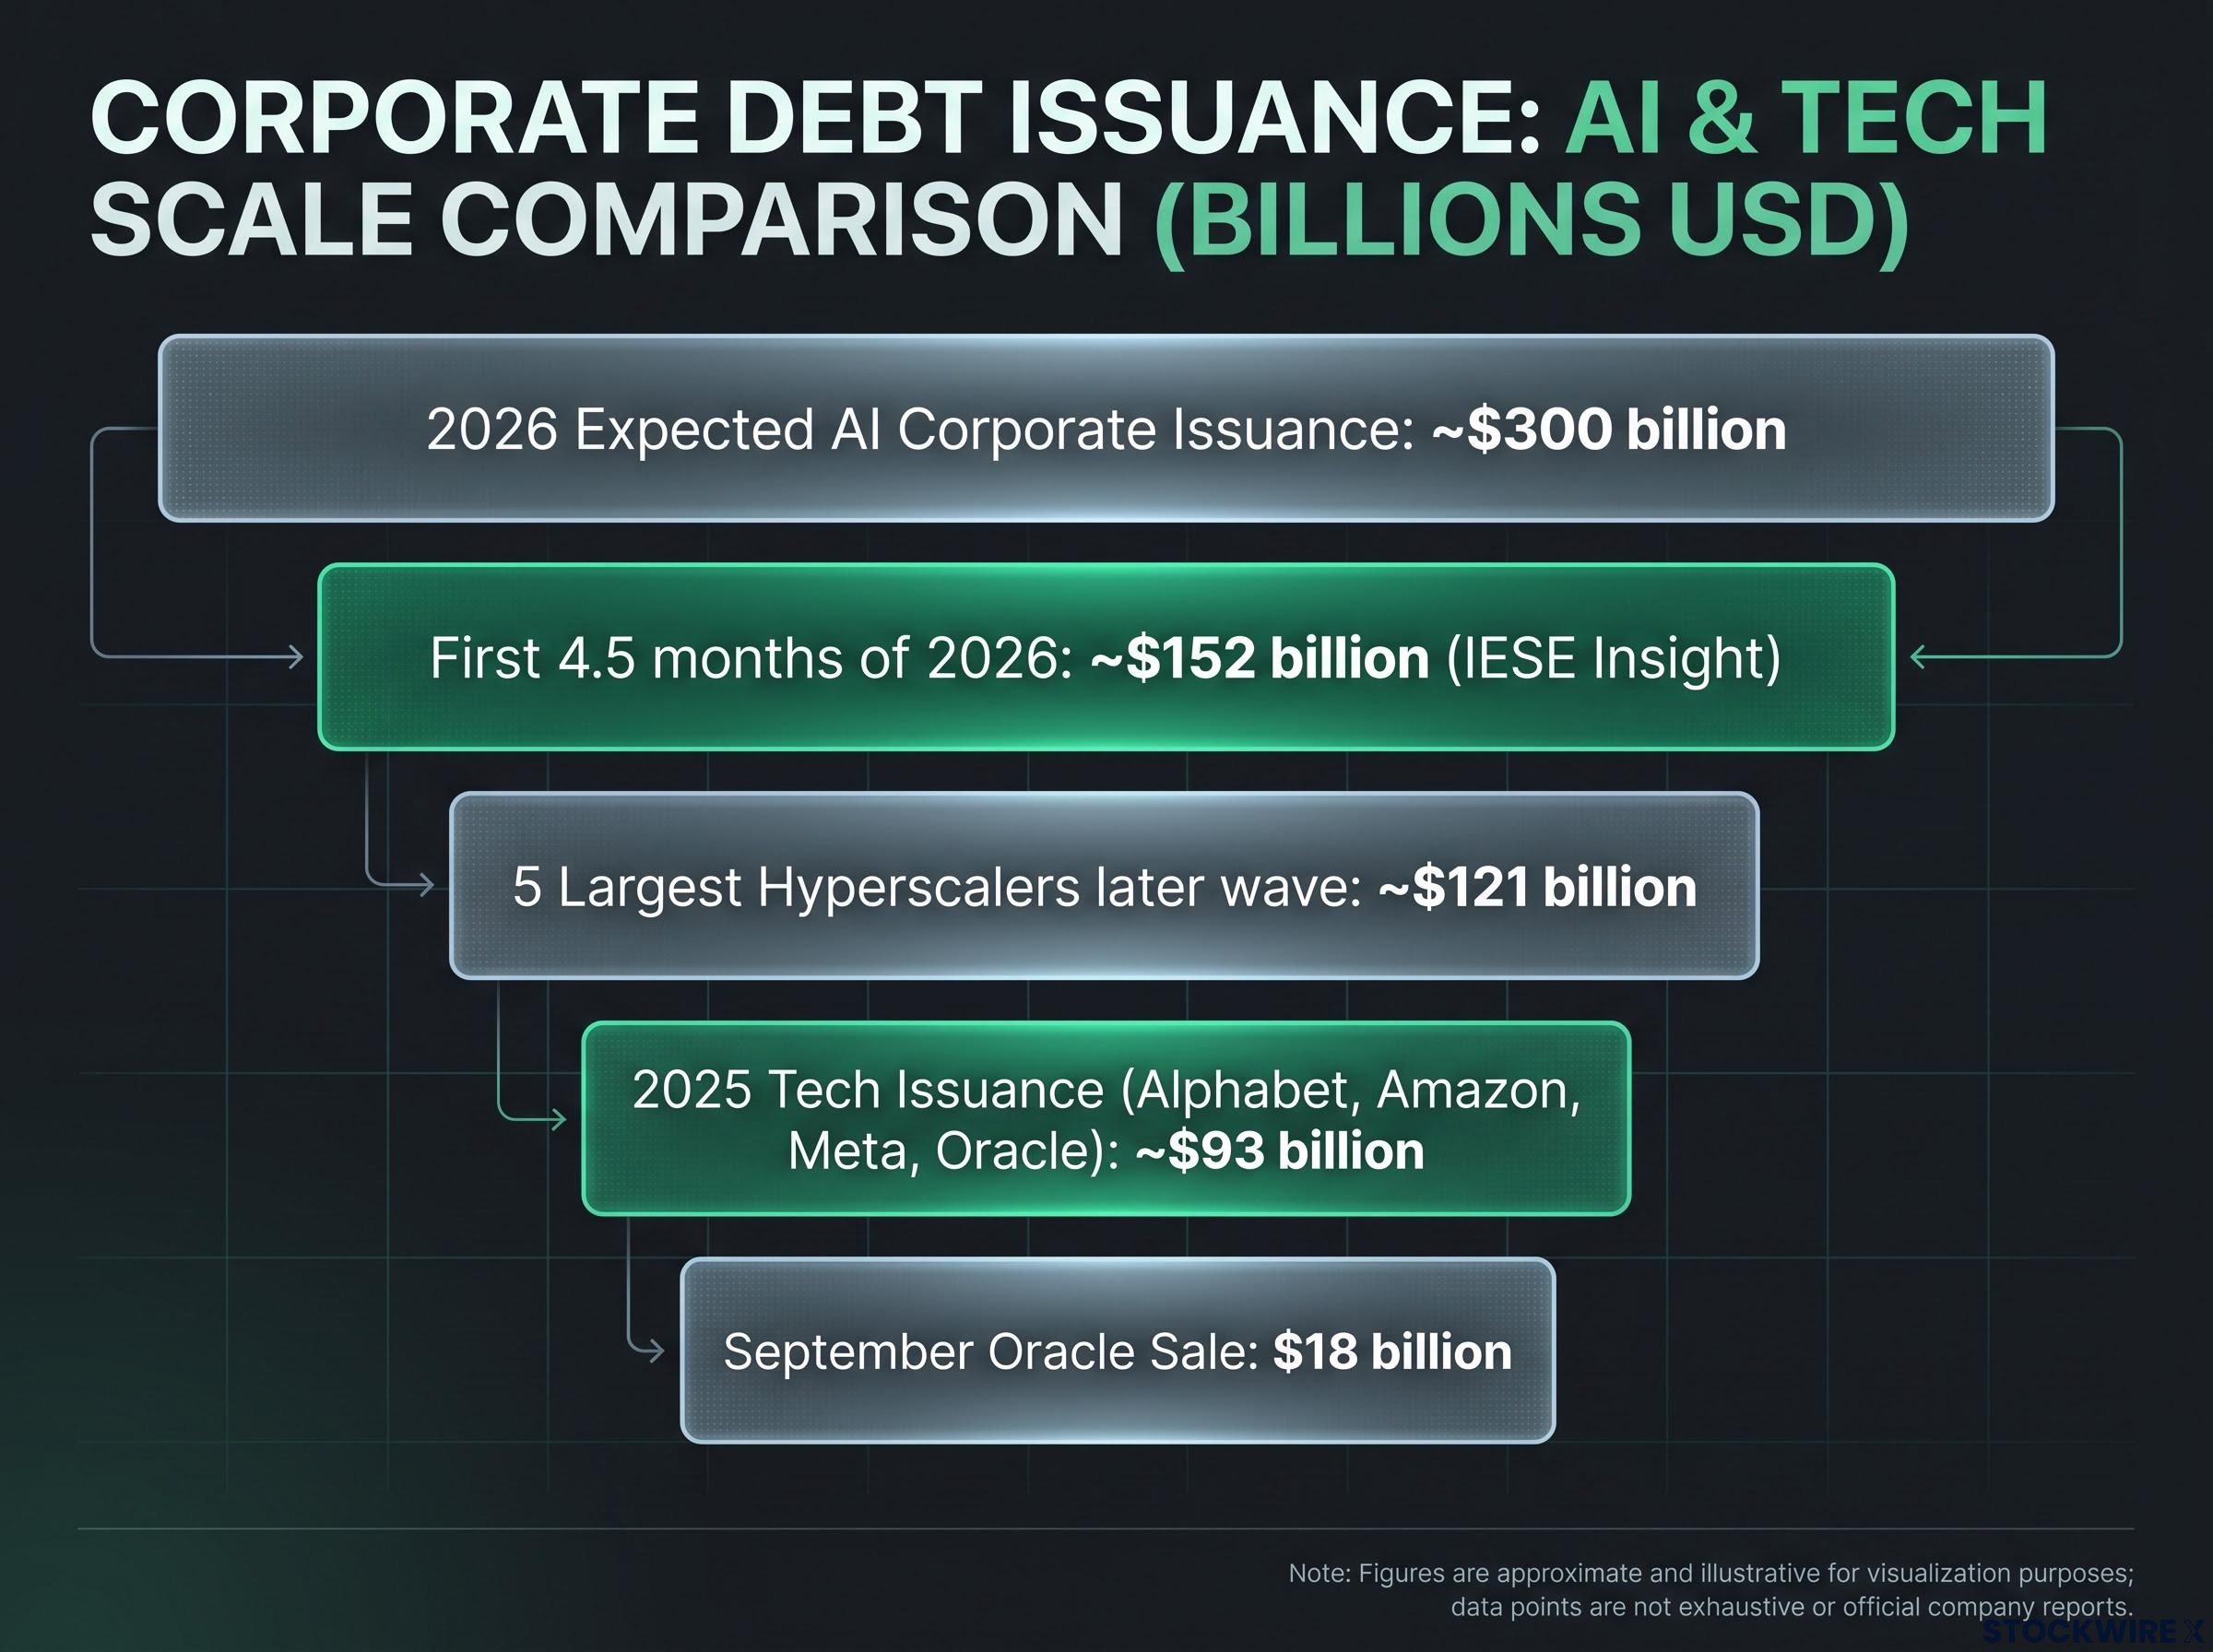
Oracle’s projected 2026 capex runs at about twice its operating cash flow. That gap is what borrowing fills.
The outcomes are lopsided. If AI revenue grows fast, cash flow services the debt comfortably. If model economics disappoint, chip prices fall or rates stay high, companies refinance at higher yields with less cash than planned.
The unwind scenario
Temasek CIO Rohit Sipahimalani said last week that “the unwinding of the AI trade” is the biggest risk to markets. He does not see it as imminent, but warned of possible “bumps” in 2027. His triggers:
- AI-safety problems
- Tighter regulation
- Companies and consumers not earning adequate returns on AI spending
Temasek, with about S$518 billion (about US$405 billion) in assets, still holds a long-term bullish view. AI makes up about 6% of portfolio value, and roughly half sits in public assets; it would like that closer to 70%-75% for flexibility, which tells you a sophisticated holder wants the ability to exit quickly.
The Bank of England’s worry is that several parts of the financial system could take losses at once. For you, the lesson is that a heavily borrowed company can fall harder than a cash-rich peer carrying the same AI label, so balance sheets matter as much as the theme.
Is AI a bubble, and what should investors do about their exposure?
Where the institutions stand
The warnings come from the Bank of England and the IMF, which flag systemic risk from leverage and concentrated ownership, and the BIS, which describes valuations as elevated. On the other side, Goldman Sachs Research, led by Peter Oppenheimer, argues this is not a conventional bubble: profits are rising and forward valuations sit below dot-com extremes. The risk it sees lies in excess capex, disappointing returns or credit stress.
That disagreement matters less than it seems. You do not need to settle the bubble question; you need to know how much of your portfolio rides on one theme and whether your hedges would actually hold.
A practical exposure checklist
- Inspect actual holdings. Capital Group suggests checking weights rather than assuming an index fund is diversified.
- Screen balance sheets. Nvidia carries little debt; Oracle borrows heavily for data centres. The contrast shows where refinancing risk sits.
- Review cash and bond duration. Cash loses ground with inflation near 3%. One commentator argues buy-and-hold bonds worked while rates fell from 1981 to 2021, a tailwind that ended in 2022; iShares notes the stock-bond relationship is less stable than in past decades.
- Consider diversifiers. Schwab Asset Management favours disciplined rebalancing and equal-weight approaches.
| Approach | Potential benefit | Key caveat |
|---|---|---|
| Equal-weight | Reduces mega-cap dominance | Can lag when mega-caps lead |
| International equities | Different revenue drivers | Currency, governance and some tech concentration |
| Short bonds and TIPS | Lower duration risk | Do not remove credit or inflation risk |
| Long bonds | Can rally in recession | May lose if inflation pushes yields up |
| Alternatives and gold | Different return sources | Costly, opaque; gold sensitive to real rates and the dollar |
None of these removes losses; each trades one risk for another. Which fits depends on your own circumstances.
For readers wanting to see how the build-out ties into Treasuries, our deep-dive into the AI bond market problem explains how falling stock-bond diversification affects portfolios.
What the AI boom changes about diversification, and what it does not
AI can be economically real while the market built around it stays financially fragile. Current earnings set this cycle apart from 2000, but concentrated markets have historically left buyers underwater for years.
Three variables deserve your attention from here: the path of core PCE, hyperscaler capex and debt issuance, and whether the 2027 “bumps” Temasek flagged begin to show. Each feeds directly into how much risk your index fund is carrying.
The practical step is simple. Look at what your fund actually holds, and decide whether that weighting matches what you intended.
Past performance does not guarantee future results. Financial projections are subject to market conditions and various risk factors. These statements are speculative and subject to change based on market developments and company performance.
This article is for informational purposes only and should not be considered financial advice. Investors should conduct their own research and consult with financial professionals before making investment decisions.