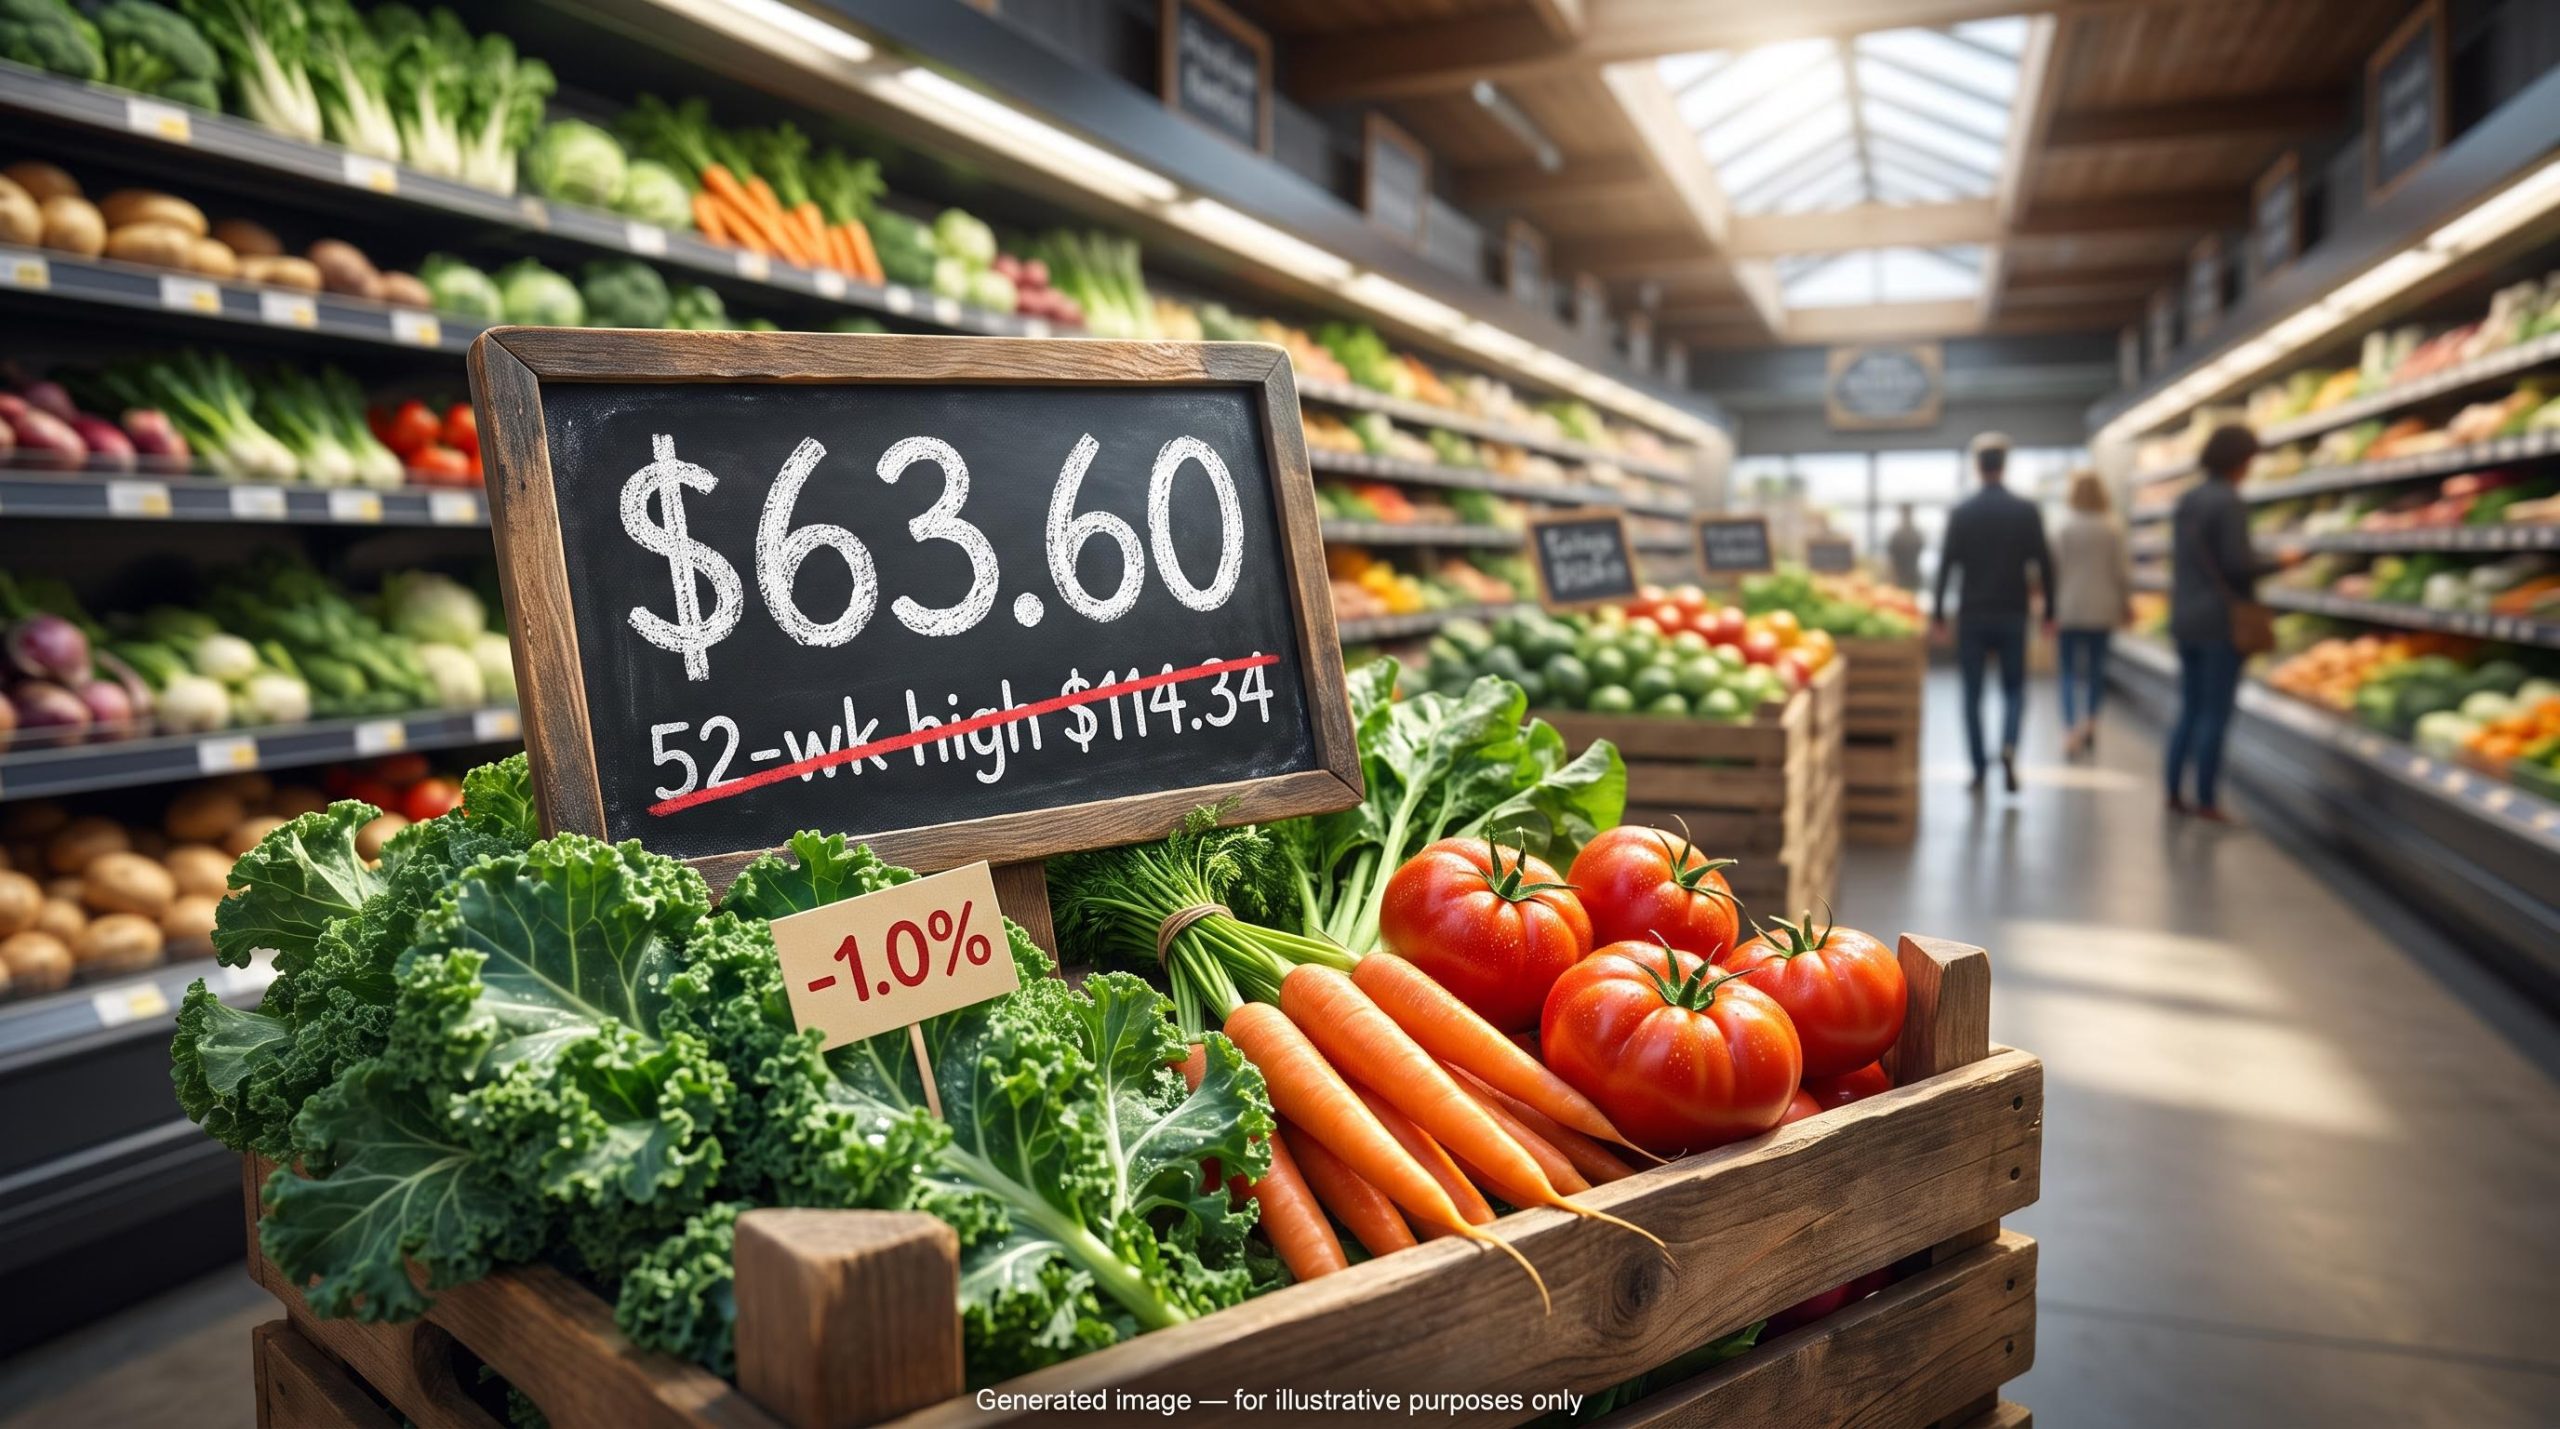
Sprouts Farmers Market just reported a quarter in which sales rose about 5% and earnings per share reached $1.37, ahead of consensus. Yet Sprouts Farmers Market stock closed near $63.60 on 13 October 2026, far below its 52-week high of $114.34. The puzzle is not a bad quarter. It is what the market is actually pricing.
For most of its run, Sprouts Farmers Market (SFM) traded as a high-growth grocer. What held that premium up was not earnings beats but comparable-store sales, often called “comps”: the sales change at stores open at least a year, which strips out the boost from new openings.
Those comps have now turned negative. The share price sits only slightly above its 52-week low of $61.88. Jimmy of Investors Grow, a retail investor who presented an analysis of the stock, claimed shares fell nearly 26% after one earnings report, though independent research could not verify the size or date of that drop.
This gives you a way to judge whether the discount reflects a temporary reset or a lasting change. It also shows you how to stress-test the price-to-earnings and discounted cash flow claims now circulating about the stock.
How a growth grocer gets repriced when comps turn negative
The sell-off makes more sense once you see the rally that came before it. The two are the same mechanism, run forwards and then backwards.
The climb began with margins. Better profitability came first, then same-store sales accelerated from roughly 4% to nearly 6.5%, and the stock rose about 13% on that report. At the next release comps cleared 8%, and shares gained another 8%. Each acceleration pulled the valuation higher, because investors were paying for the speed of growth.
Then the speed dropped.
| Quarter | Comp sales | Stock context |
|---|---|---|
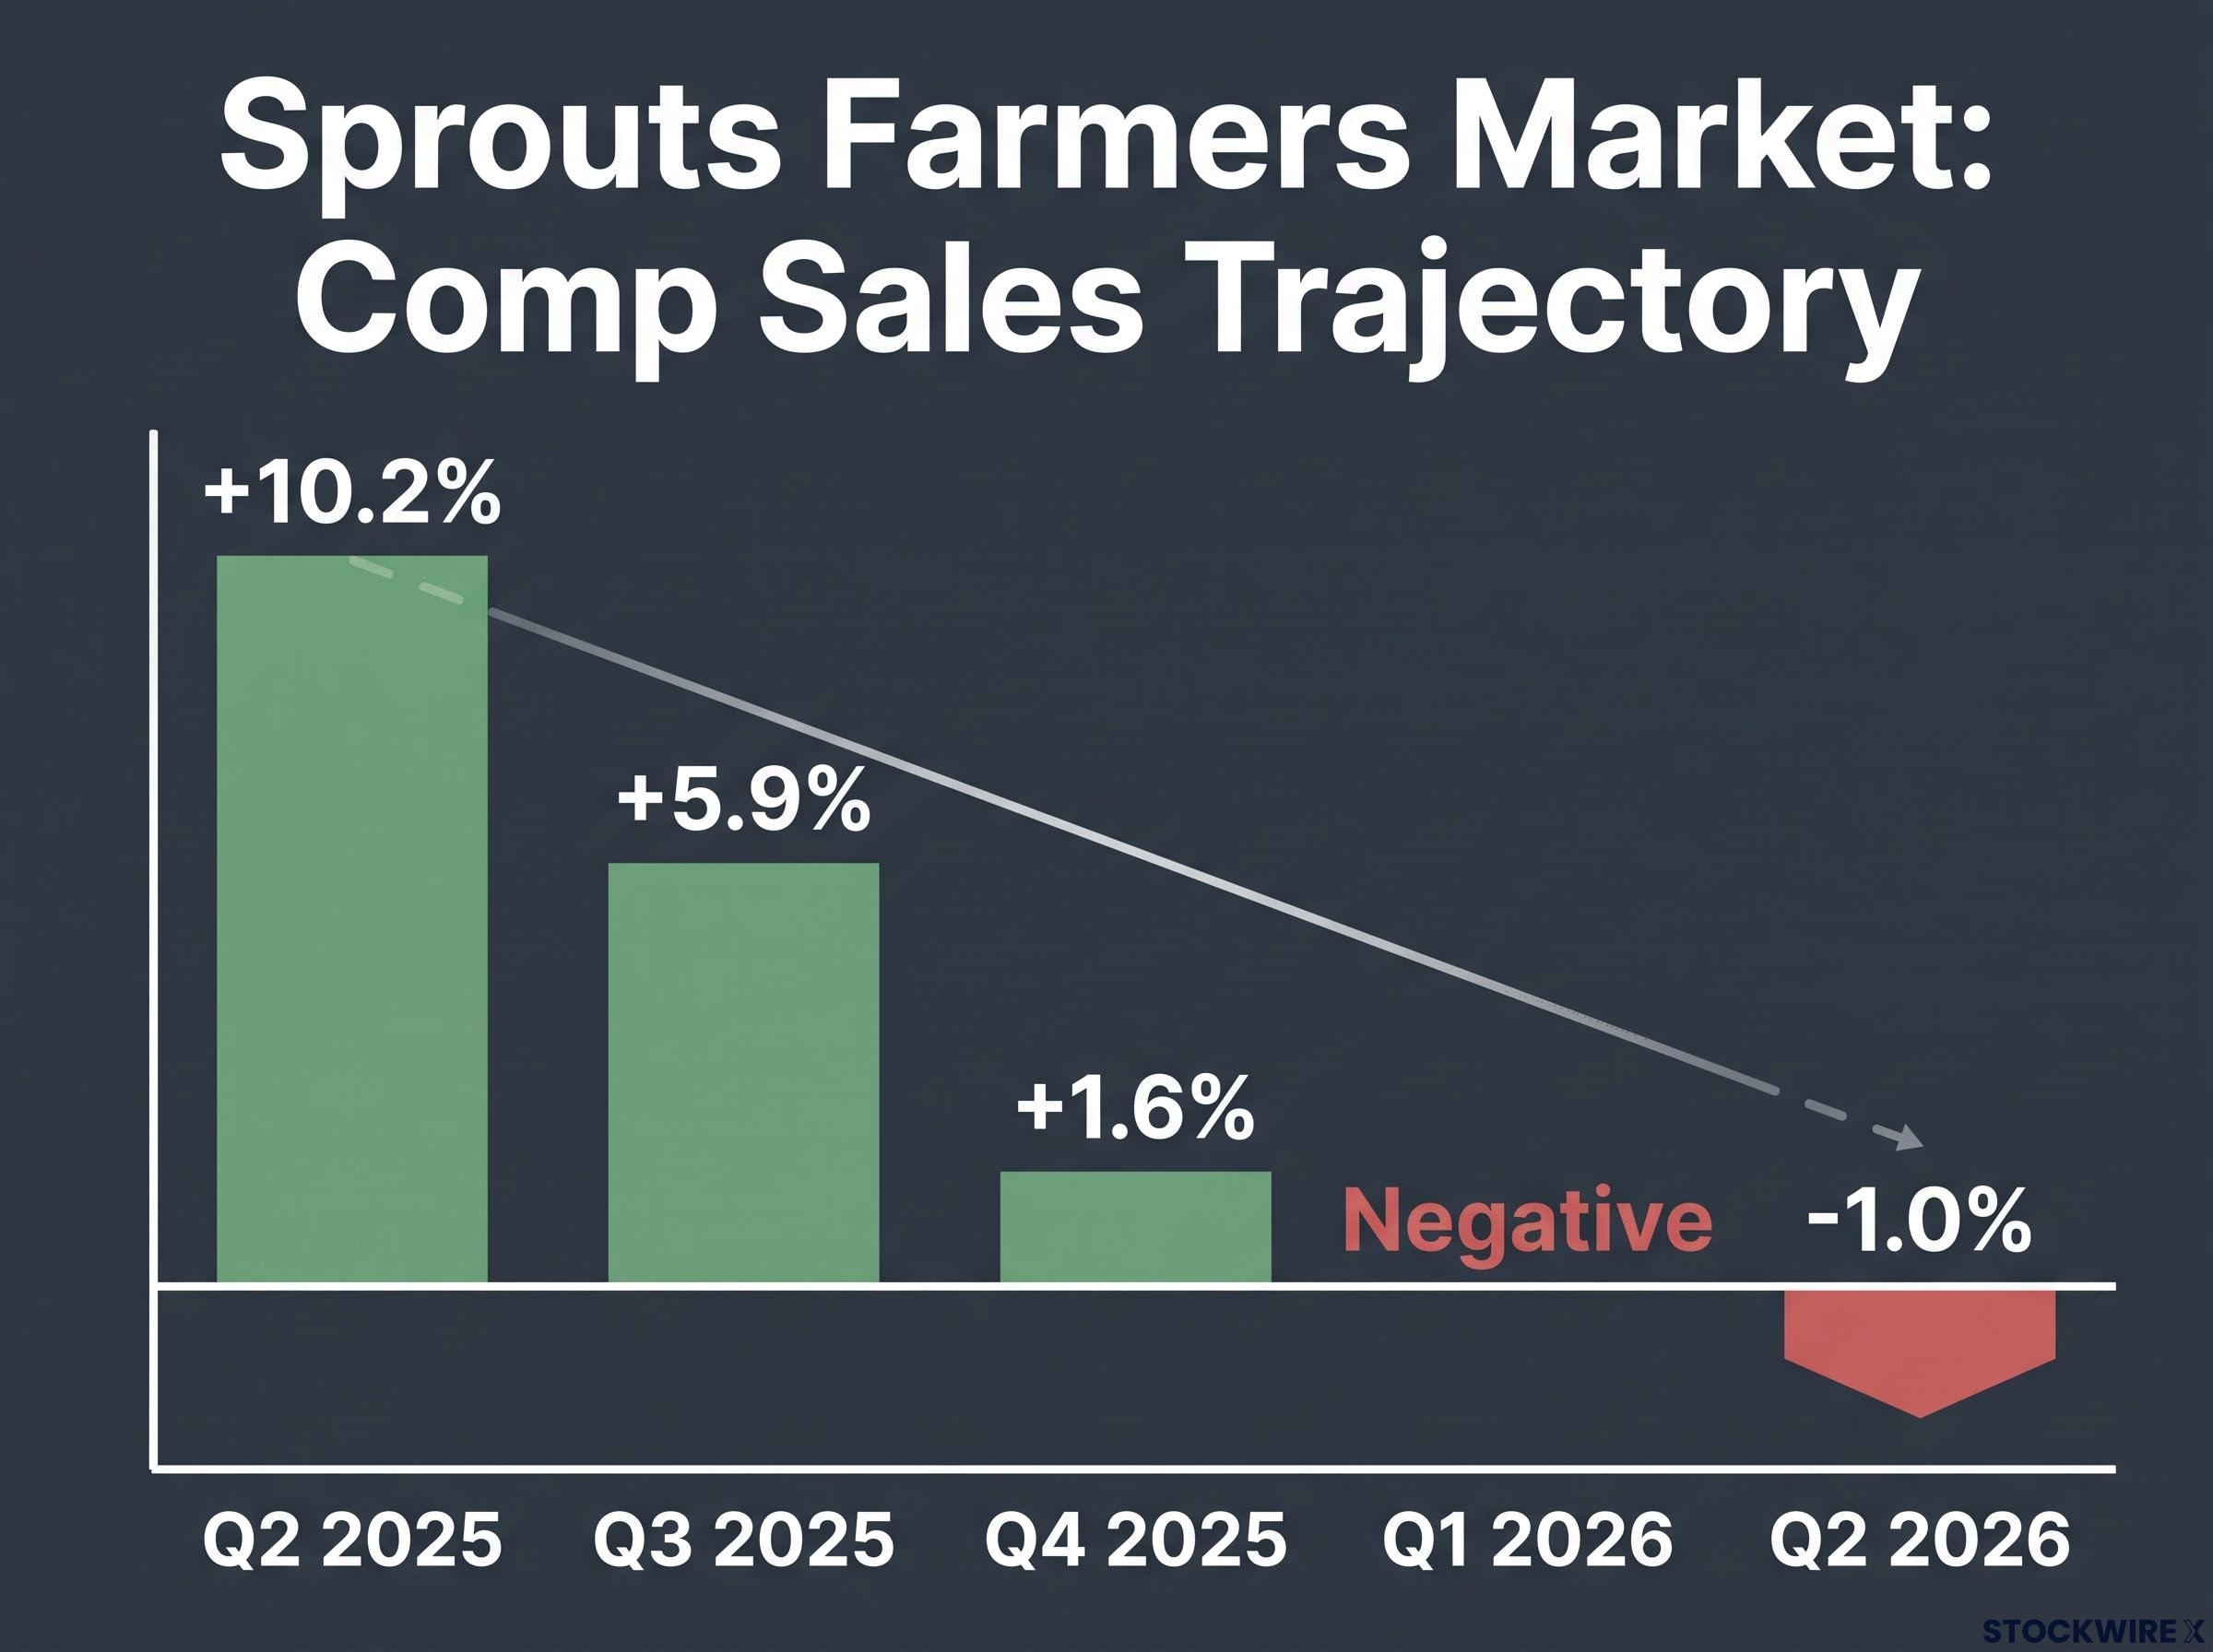
| Q2 2025 | +10.2% | Double-digit growth supporting a premium valuation |
| Q3 2025 | +5.9% | EPS beat, but comps well short of hopes above 10% |
| Q4 2025 | +1.6% | Growth narrative weakening |
| Q1 2026 | Negative | Comps turn below zero |
| Q2 2026 | -1.0% | EPS of $1.37 beats; shares slide toward 52-week low |
The Q3 2025 result shows how the reversal works. A 5.9% comp is respectable for a grocer, but the market had priced in something far higher, so a decent number registered as a miss.
By Q2 FY2026, net sales reached about $2.3 billion and EPS rose to $1.37 from $1.35 a year earlier. Gross margin held at 38.7%, down just 12 basis points. On profit, the business looked fine.
The contrast that matters Sales up about 5%, comparable-store sales down 1%. Growth now comes from new square footage, not from existing stores selling more.
Investors value footprint growth less than organic growth because each new store costs capital to build. That tells you an EPS beat can still coincide with a falling stock when the market is paying for the growth rate, not the profit level. Before you read any beat as good news, check which metric the price actually depends on.
Dutch Bros expansion shows the same tension, where valuation reflects growth potential and same-store sales become the signal of whether new units are adding value or simply adding footprint.
When big ASX news breaks, our subscribers know first
What actually drove the slowdown, and which causes are proven?
If comps are the metric that matters, the next question is why they fell. Several explanations are circulating, and they do not carry equal weight.
The best-supported cause comes from management. Sprouts pointed to a tough June comparison against unusually strong produce sales a year earlier. Sales improved through May, weakened in June and began improving again in July, a pattern consistent with a base effect rather than a collapse in demand.
Beyond that, the evidence thins out quickly.
| Suspected cause | Evidence level | Quantified impact? |
|---|---|---|
| Tough June produce comparison | Cited by management | Not quantified |
| Consumer trade-down | Described in Q2 coverage | No |
| Competition (Trader Joe’s, Whole Foods, Aldi, Kroger) | Plausible, overlapping customers | No |
| Tariffs and produce costs | Plausible pressure | No |
| GLP-1 shopping changes | Industry commentary, unverified | No link to SFM shown |
Coverage of the second quarter described a cautious, price-sensitive shopper shifting to cheaper options, and Trader Joe’s, Whole Foods, Aldi and Kroger all chase similar fresh-food spending. Tariffs on some suppliers could squeeze margins too. None of these has a measured effect on SFM’s comps.
GLP-1 weight-loss drugs sit lower still. Industry commentary citing Numerator suggested affected households spend less on groceries, but those figures were not independently confirmed, and there is no evidence management blamed its comps on the drugs.
Food-safety headlines: what the notices say and do not say
The presenter also cited a Centers for Disease Control and Prevention (CDC) produce announcement. The 2026 sprout outbreaks were real: one linked to alfalfa sprouts infected 76 people across 16 states, and a broccoli-sprout outbreak involved 32 cases.
But the CDC and Food and Drug Administration (FDA) notices named Everything Sprouts LLC and Evergreen Fresh Sprouts LLC, not SFM. The company said no affected product reached its stores. The only recent SFM-specific event was an October 2025 deli recall of smoked mozzarella pasta salad over Listeria, where it acted as a retailer, unrelated to sprouts.
The risk here is name association, not culpability. This means you should weigh management’s cited cause most heavily and treat the rest as risks to monitor, not explanations already proven.
Does the valuation hold up? Using P/E, DCF and CAPM as cross-checks
With causes still uncertain, many investors jump straight to valuation. The tools are useful, but each has a limit you should understand before trusting it.
Reading the multiples
The forward price-to-earnings (P/E) ratio divides today’s share price by expected earnings over the next year. A lower number means you pay less per dollar of future profit.
CNBC’s next-twelve-months measure put SFM at 10.95x on 12 October 2026. An earlier snapshot showed about 15x when shares traded near $83.69, and GAAP P/E sat near 12x in late September. These figures use different prices, estimates and conventions, so they are not directly comparable.
A low multiple tells you the market expects weak growth. The real question for you is whether comps are stabilising, not whether the multiple looks cheap.
Treating DCF and CAPM as scenarios
A discounted cash flow (DCF) model estimates a company’s value by projecting future cash and converting it into today’s dollars using a required rate of return. The Capital Asset Pricing Model (CAPM) estimates that required return from a stock’s volatility relative to the market.
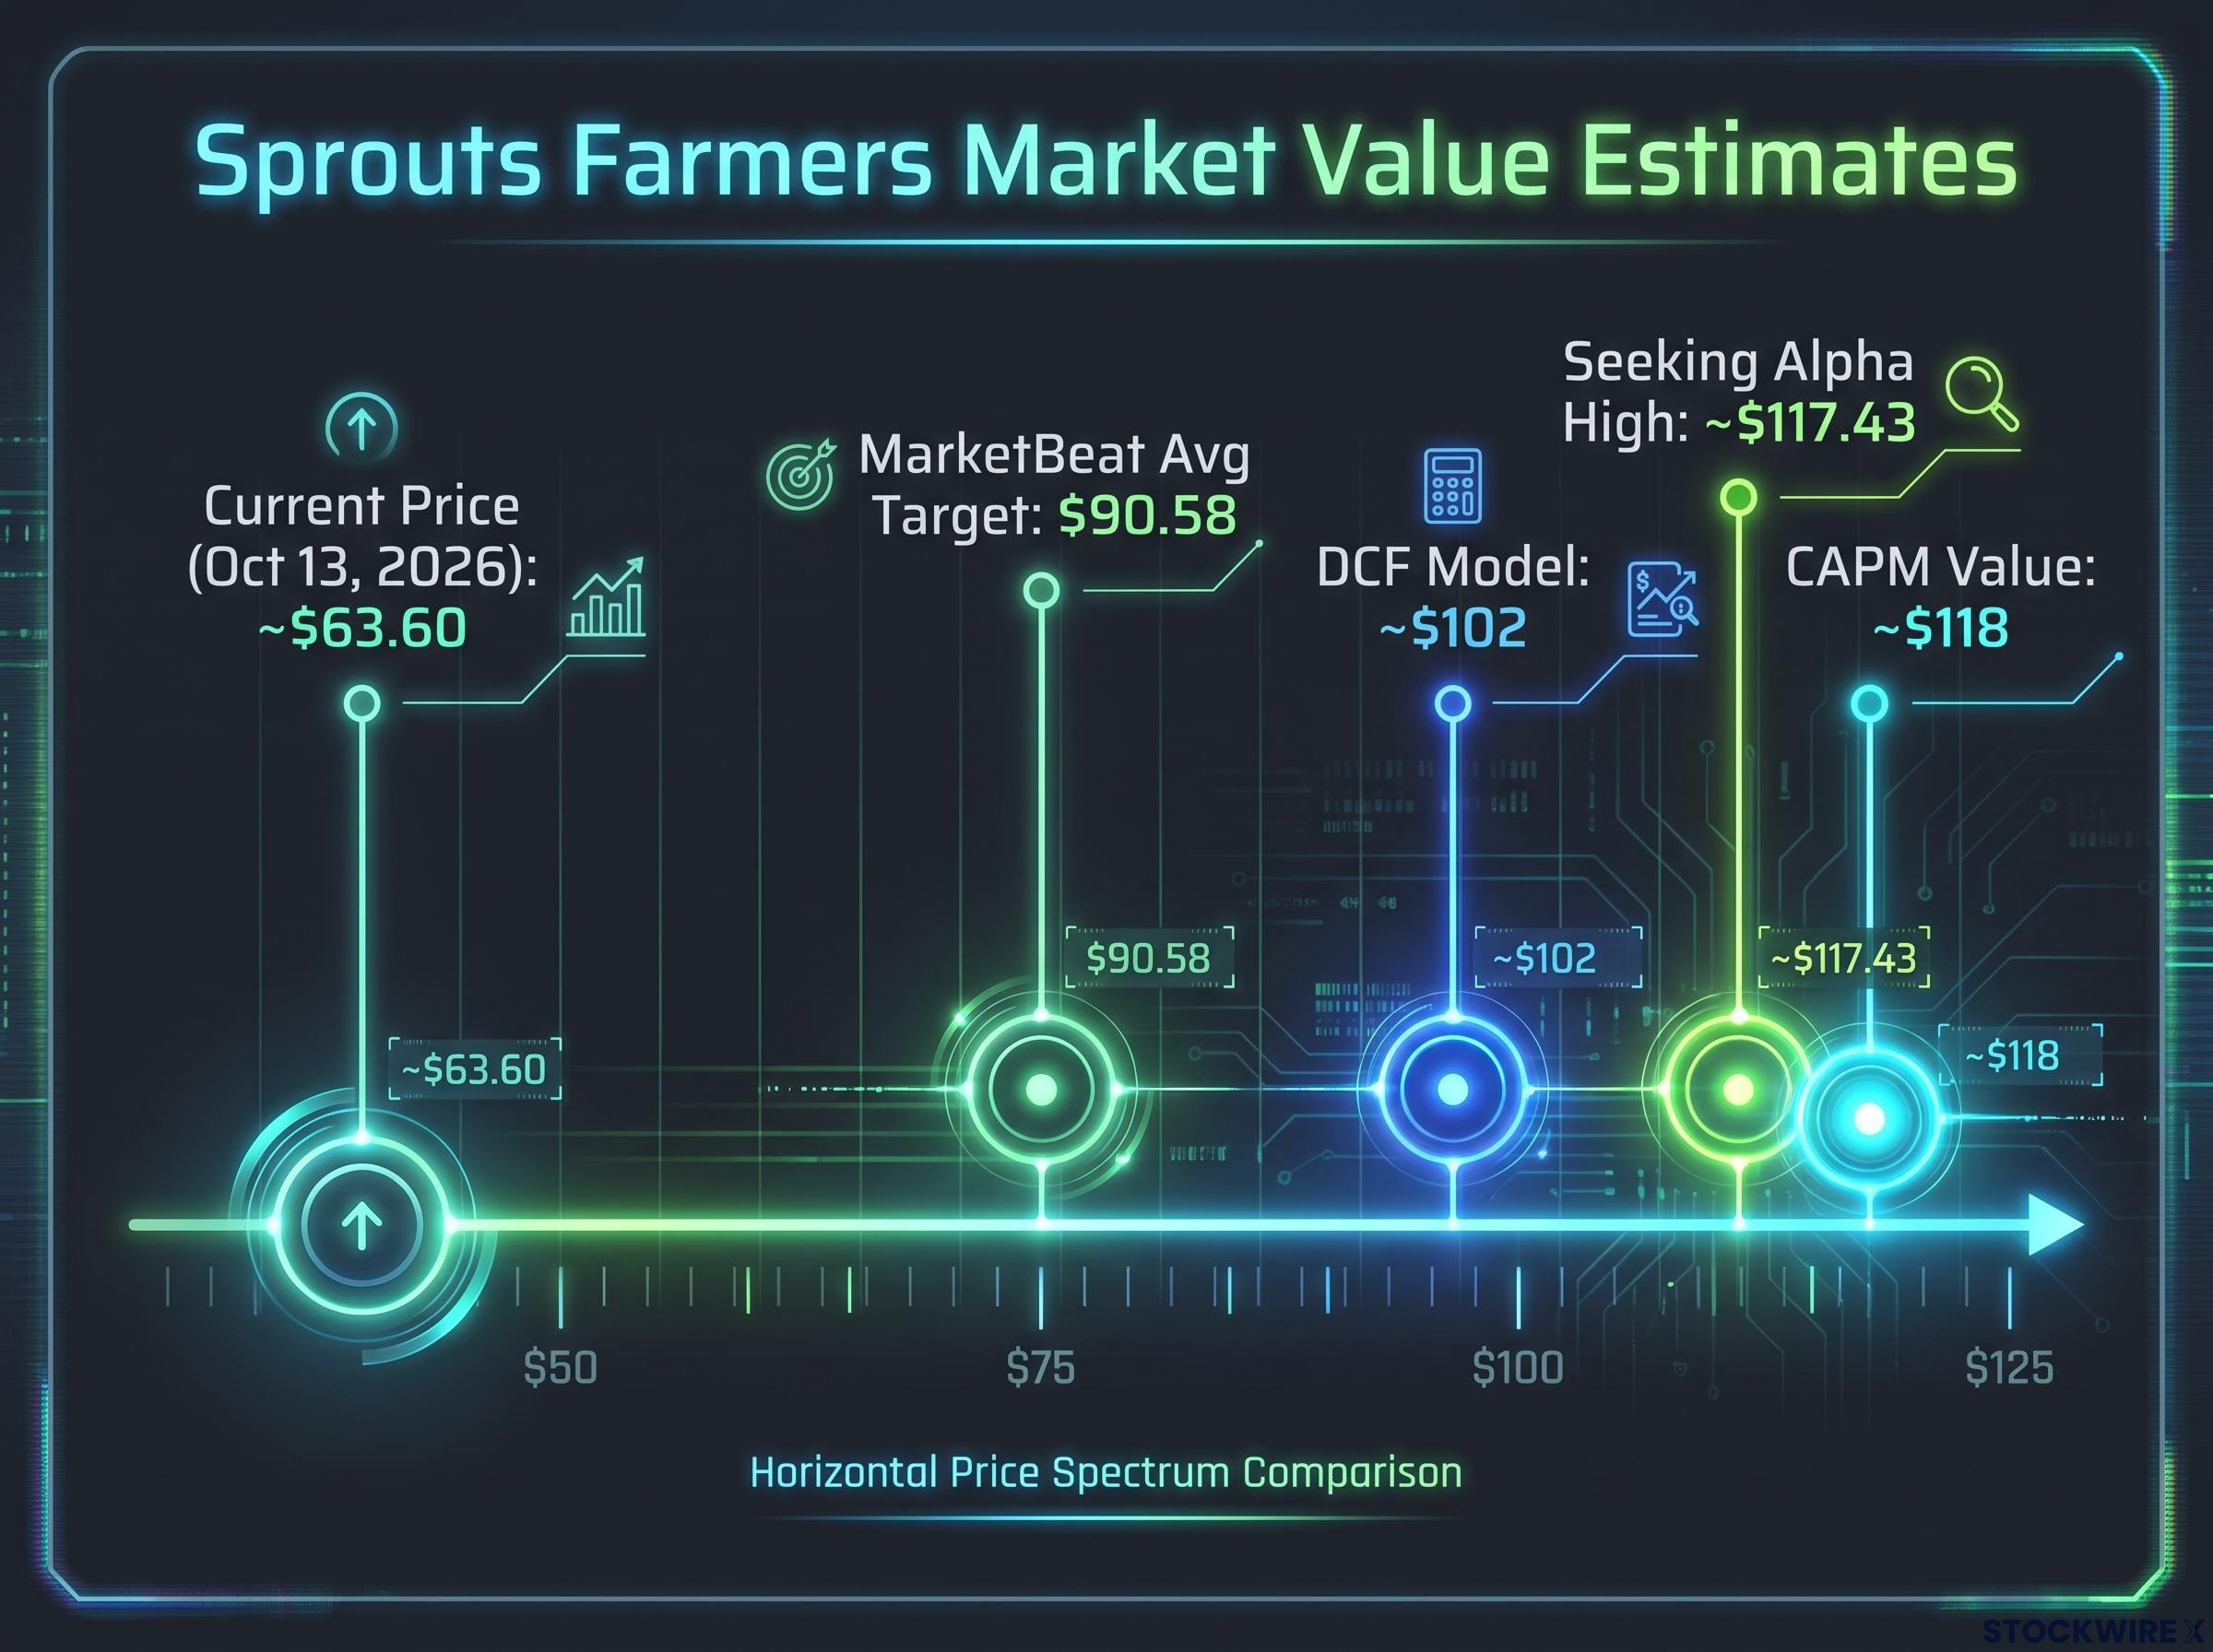
Investors Grow’s figures put DCF value near $102 and CAPM value near $118. Those inputs could not be audited.
The presenter’s DCF and CAPM figures are two attempts at estimating intrinsic value, and the terminal value assumption alone often drives most of the result, which is why the $102 and $118 outputs deserve scenario treatment.
| Method | Result | Key assumption or limit |
|---|---|---|
| Forward P/E | 10.95x | Depends on earnings estimates holding |
| DCF (presenter) | About $102 | 9% required return; undervalued at 10-12%, wait at 13% |
| CAPM (presenter) | About $118 | Sensitive to beta and risk premium |
| Historical P/E zones (presenter) | Green zone gain about 32%; red zone loss about 16% | Past patterns may not repeat |
Company guidance gives these models their anchor: FY2026 EPS of $5.32-$5.40, EBIT of $675-$685 million and comps of -0.5% to +0.5%. Trailing EPS sits around $5.23, with net margin near 5.5%.
Professional views point the same direction, with wide spreads:
- MarketBeat consensus on 13 October 2026: 7 Buy, 6 Hold, 1 Sell, average target $90.58
- JPMorgan upgraded to Overweight on 30 July 2026, with its target later set at $90
- Seeking Alpha contributors issued Buy cases valuing shares up to about $117.43
- Morningstar: no current fair-value estimate found
Every method suggests upside, yet none can tell you whether the slowdown is temporary or structural. Past performance does not guarantee future results, and projections depend on assumptions that may not hold.
What could keep the discount in place, and what would close it?
Cheap-looking valuations stay cheap when the bear case proves right. The strongest arguments deserve a fair hearing alongside their rebuttals.
| Risk | Why it matters | Counterargument |
|---|---|---|
| Growth-dependent valuation | Flat comps invite a conventional grocer multiple | Already about 11x forward |
| Margin deleverage | Negative comps spread fixed labour and rent over less sales | About 38% gross margin retained; guidance maintained |
| New-store execution | 42 net new stores, entering New England and upper Midwest | About 490 stores in 25 states; openings cited as successful |
| Competition and trade-down | Pressure on traffic and pricing | Differentiated fresh and specialty range |
| Tariff exposure | Cost inflation could hurt traffic if passed on | Private label and sourcing flexibility, unquantified |
| DCF sensitivity | Small input changes swing value widely | Useful as scenarios only |
No verified precedent of a comparable retailer, with a similar slowdown and documented outcome, turned up in research. Any recovery case rests on SFM’s own numbers.
A margin of safety matters here because every scenario value rests on comps assumptions nobody can confirm; buying at a meaningful discount to estimated value absorbs the risk that the slowdown proves structural.
That makes the next few prints decisive. Management guides Q3 EPS of $1.20-$1.24 and comps of -0.5% to +1.5%, with full-year EPS assuming at least $300 million of buybacks.
- Comps: flat to positive supports recovery; persistent negatives masked by new stores point to further de-rating.
- Gross margin: holding near 38% suggests pricing power intact.
- New-store returns: acceptable productivity in new markets validates the expansion.
- Guidance: maintained or raised full-year targets versus cuts.
Opinion, not advice The presenter believes the market oversold SFM after mispricing it as a fast grower. That is his personal view, not formal financial advice.
These signposts tell you which upcoming data should change your view, so you can decide on evidence instead of price alone.
Weighing the discount: what to track before making a call on SFM
The evidence points to a growth-expectation reset more than an earnings collapse. Profits held; the comp story broke, and the multiple followed it down.
Your three cross-checks (forward P/E, analyst targets and DCF scenarios) all lean towards undervaluation, but each rests on assumptions about comps that nobody can yet confirm. A cheap multiple only matters if existing stores start growing again.
The next comp print, gross margin and new-store productivity will settle more than any model can. Watch those before treating the discount as an opportunity or a warning.
This article is for informational purposes only and should not be considered financial advice. Investors should conduct their own research and consult with financial professionals before making investment decisions. Forward-looking statements are speculative and subject to change based on market developments and company performance.