
The S&P 500 and Nasdaq Composite both closed at record highs last week. Underneath those headlines, only about half of S&P 500 stocks trade above their 200-day average, and the equal-weight version of the index has slipped since the start of July. Market breadth, the measure of how many stocks are actually joining a rally, is telling a less flattering story than the index level.
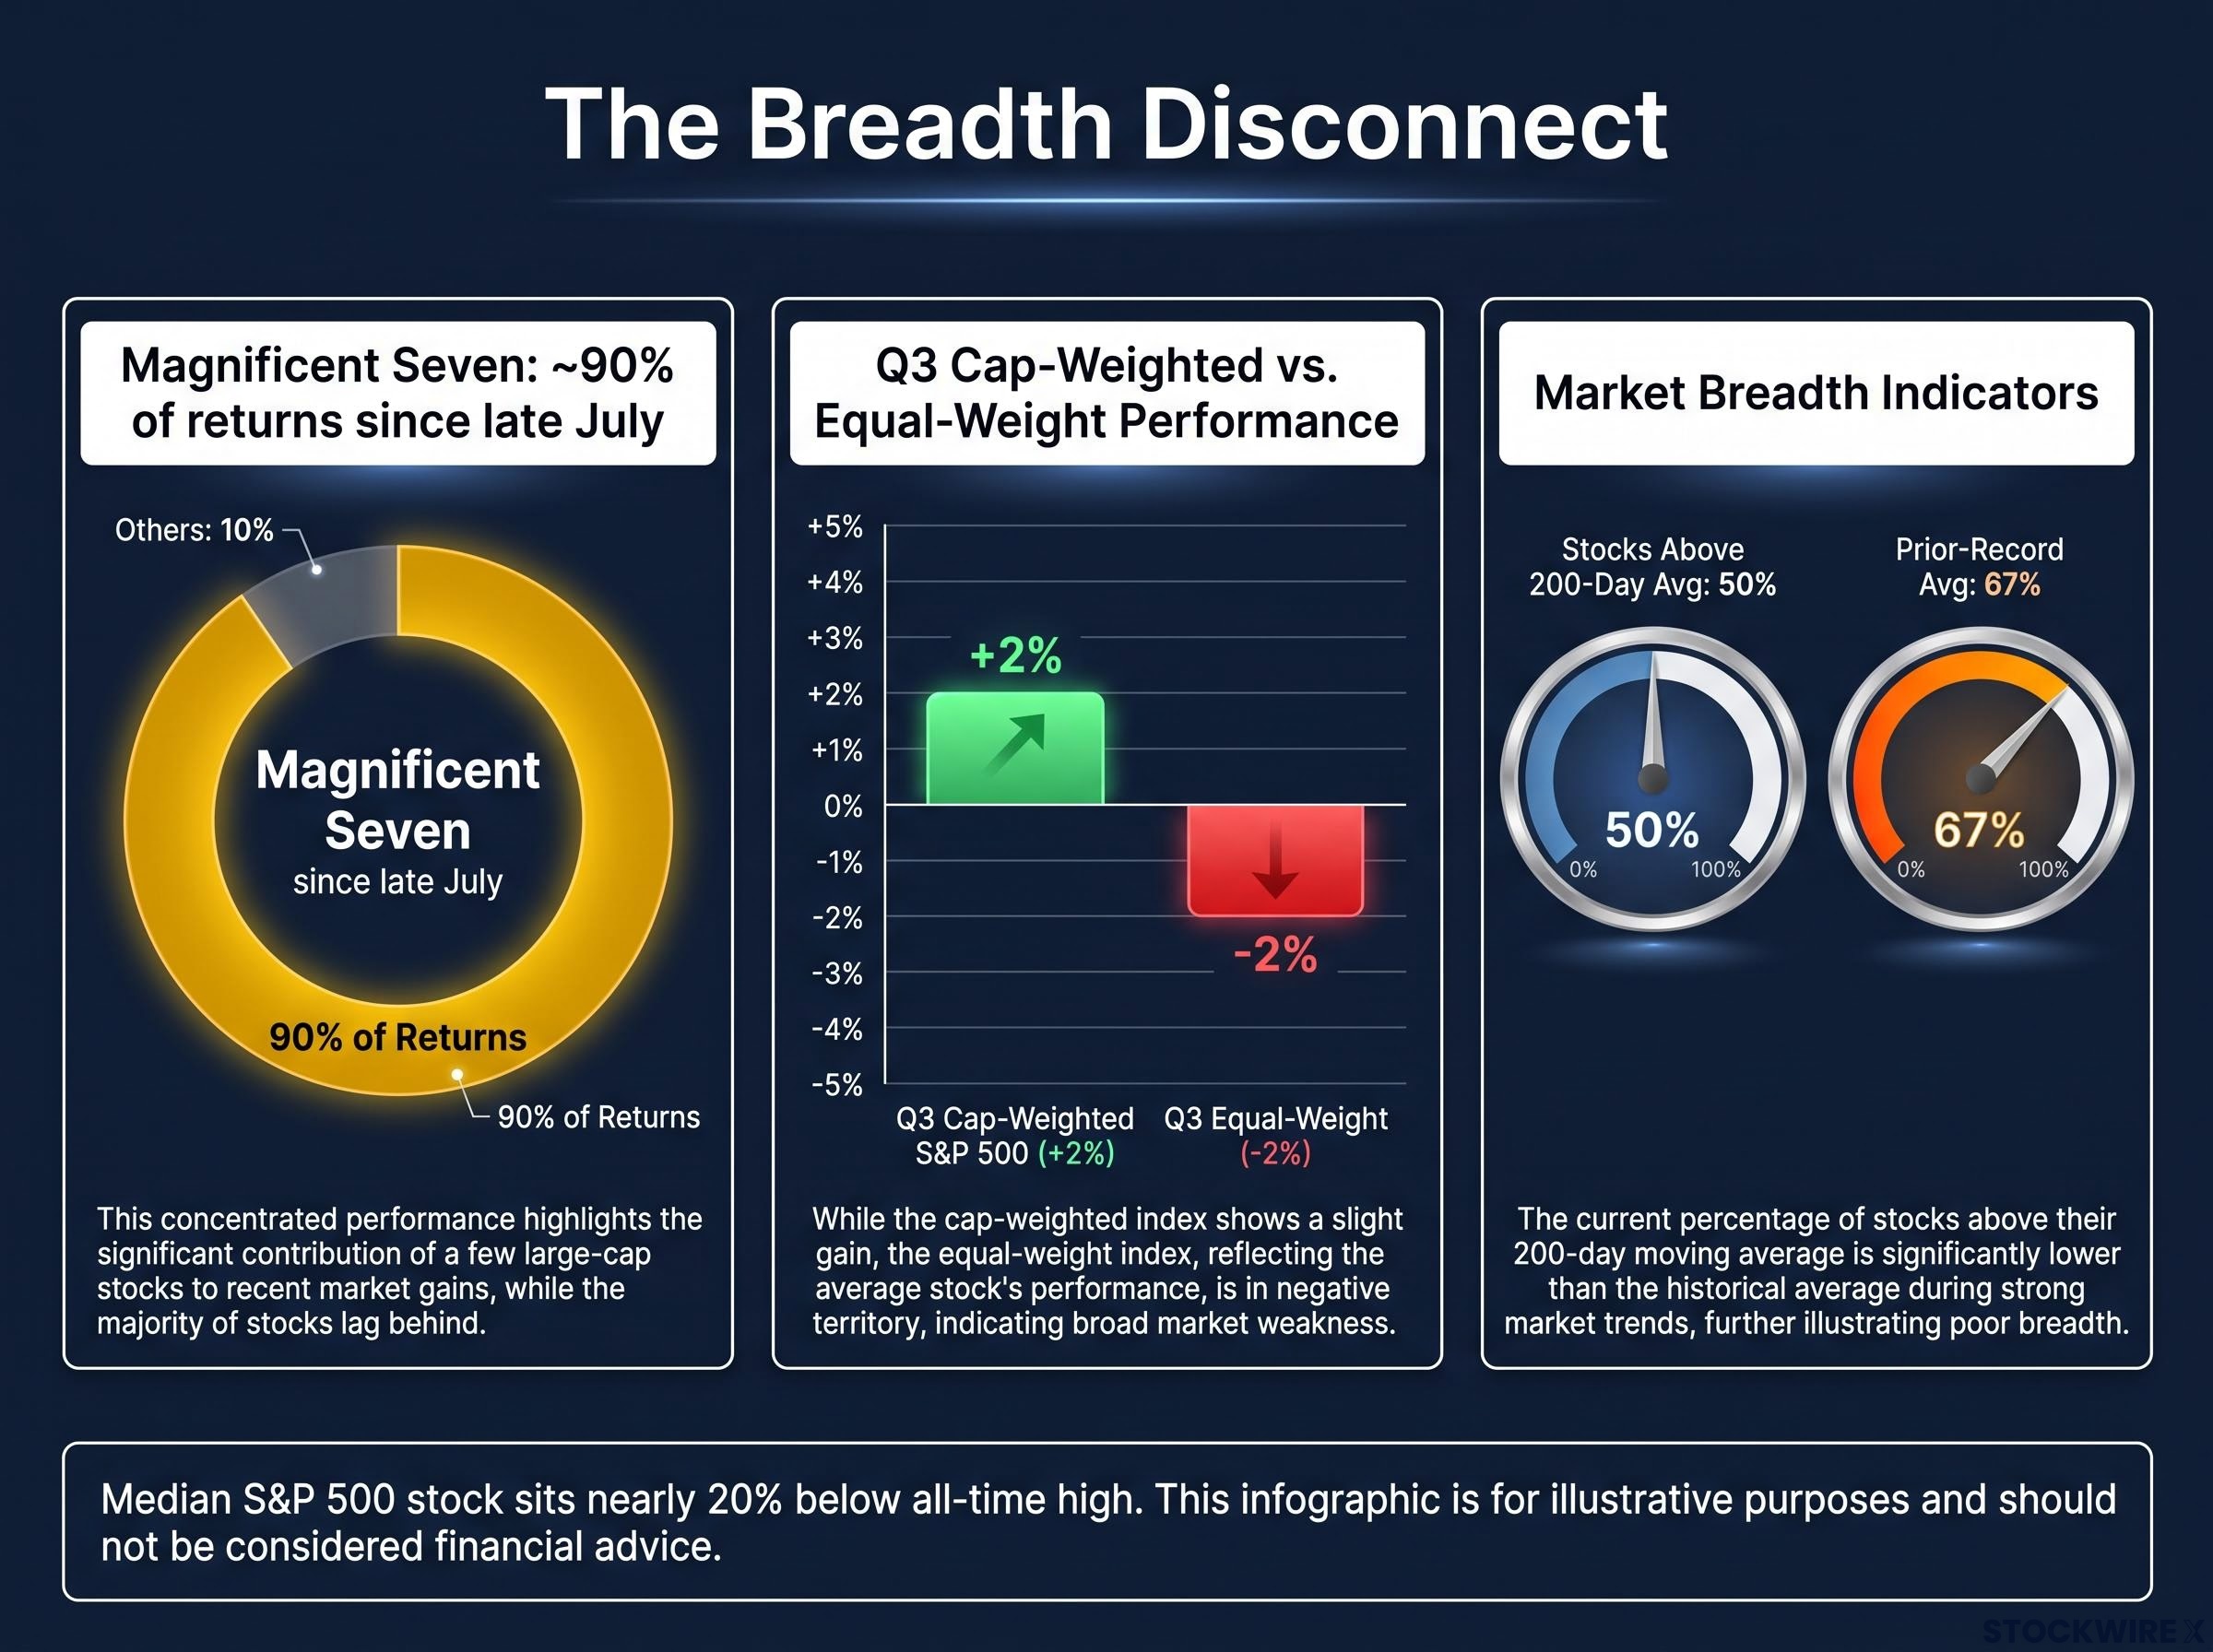
The gap has a clear source. According to Morningstar, the Magnificent Seven accounted for about 90% of total market returns since late July. Over the same stretch, the 10-year Treasury yield climbed to its highest level since 2002, and the Federal Reserve resumed raising interest rates.
Q3 earnings season, which opens with the big banks this week, is the next real test.
Here is how to read breadth, valuation and earnings signals side by side, and what they currently say about whether this rally is widening or simply being carried by a handful of giants.
What does market breadth actually tell you about a rally?
A record high answers one question: did the index rise? It cannot tell you who did the lifting.
Breadth measures the share of stocks participating in an index move. That matters because the S&P 500 is cap-weighted, meaning larger companies carry more weight, so a few giants can push it higher while most members go nowhere. An equal-weight index gives every company the same weight, which makes it a fair proxy for the typical stock.
Reading market divergence means comparing the index against ex-tech gauges, equal-weight funds and the median stock; when the headline rises while those measures stall, the rally depends on a single theme.
Four indicators do most of the work:
- Advance/decline ratio: the number of rising stocks versus falling stocks in a session. Signals how wide a single day’s move was.
- Stocks at four-week highs: the share of stocks hitting fresh short-term peaks. Signals whether momentum is spreading.
- Share above the 200-day average: the portion of stocks trading above their average price over roughly the past 200 trading days. Signals long-term trend health.
- Equal-weight versus cap-weighted performance: signals whether the typical stock is keeping pace with the giants.
Breadth is a confirmation tool, not a timing tool. Narrow rallies can run for long periods, which is why LPL Financial‘s Jeff Buchbinder argues that lasting bull runs generally need wider participation, not that narrow ones must end soon.
Why narrow leadership raises the stakes
- Index vulnerability: a few companies contribute an outsized share of returns.
- Less internal confirmation: the headline index stops representing the median stock.
- Crowded positioning: concentrated flows reinforce momentum but can make exits disorderly.
- Macro sensitivity: long-duration mega-cap cash flows react sharply to real yields.
- Earnings dependency: the leaders must keep delivering on revenue, margins and guidance.
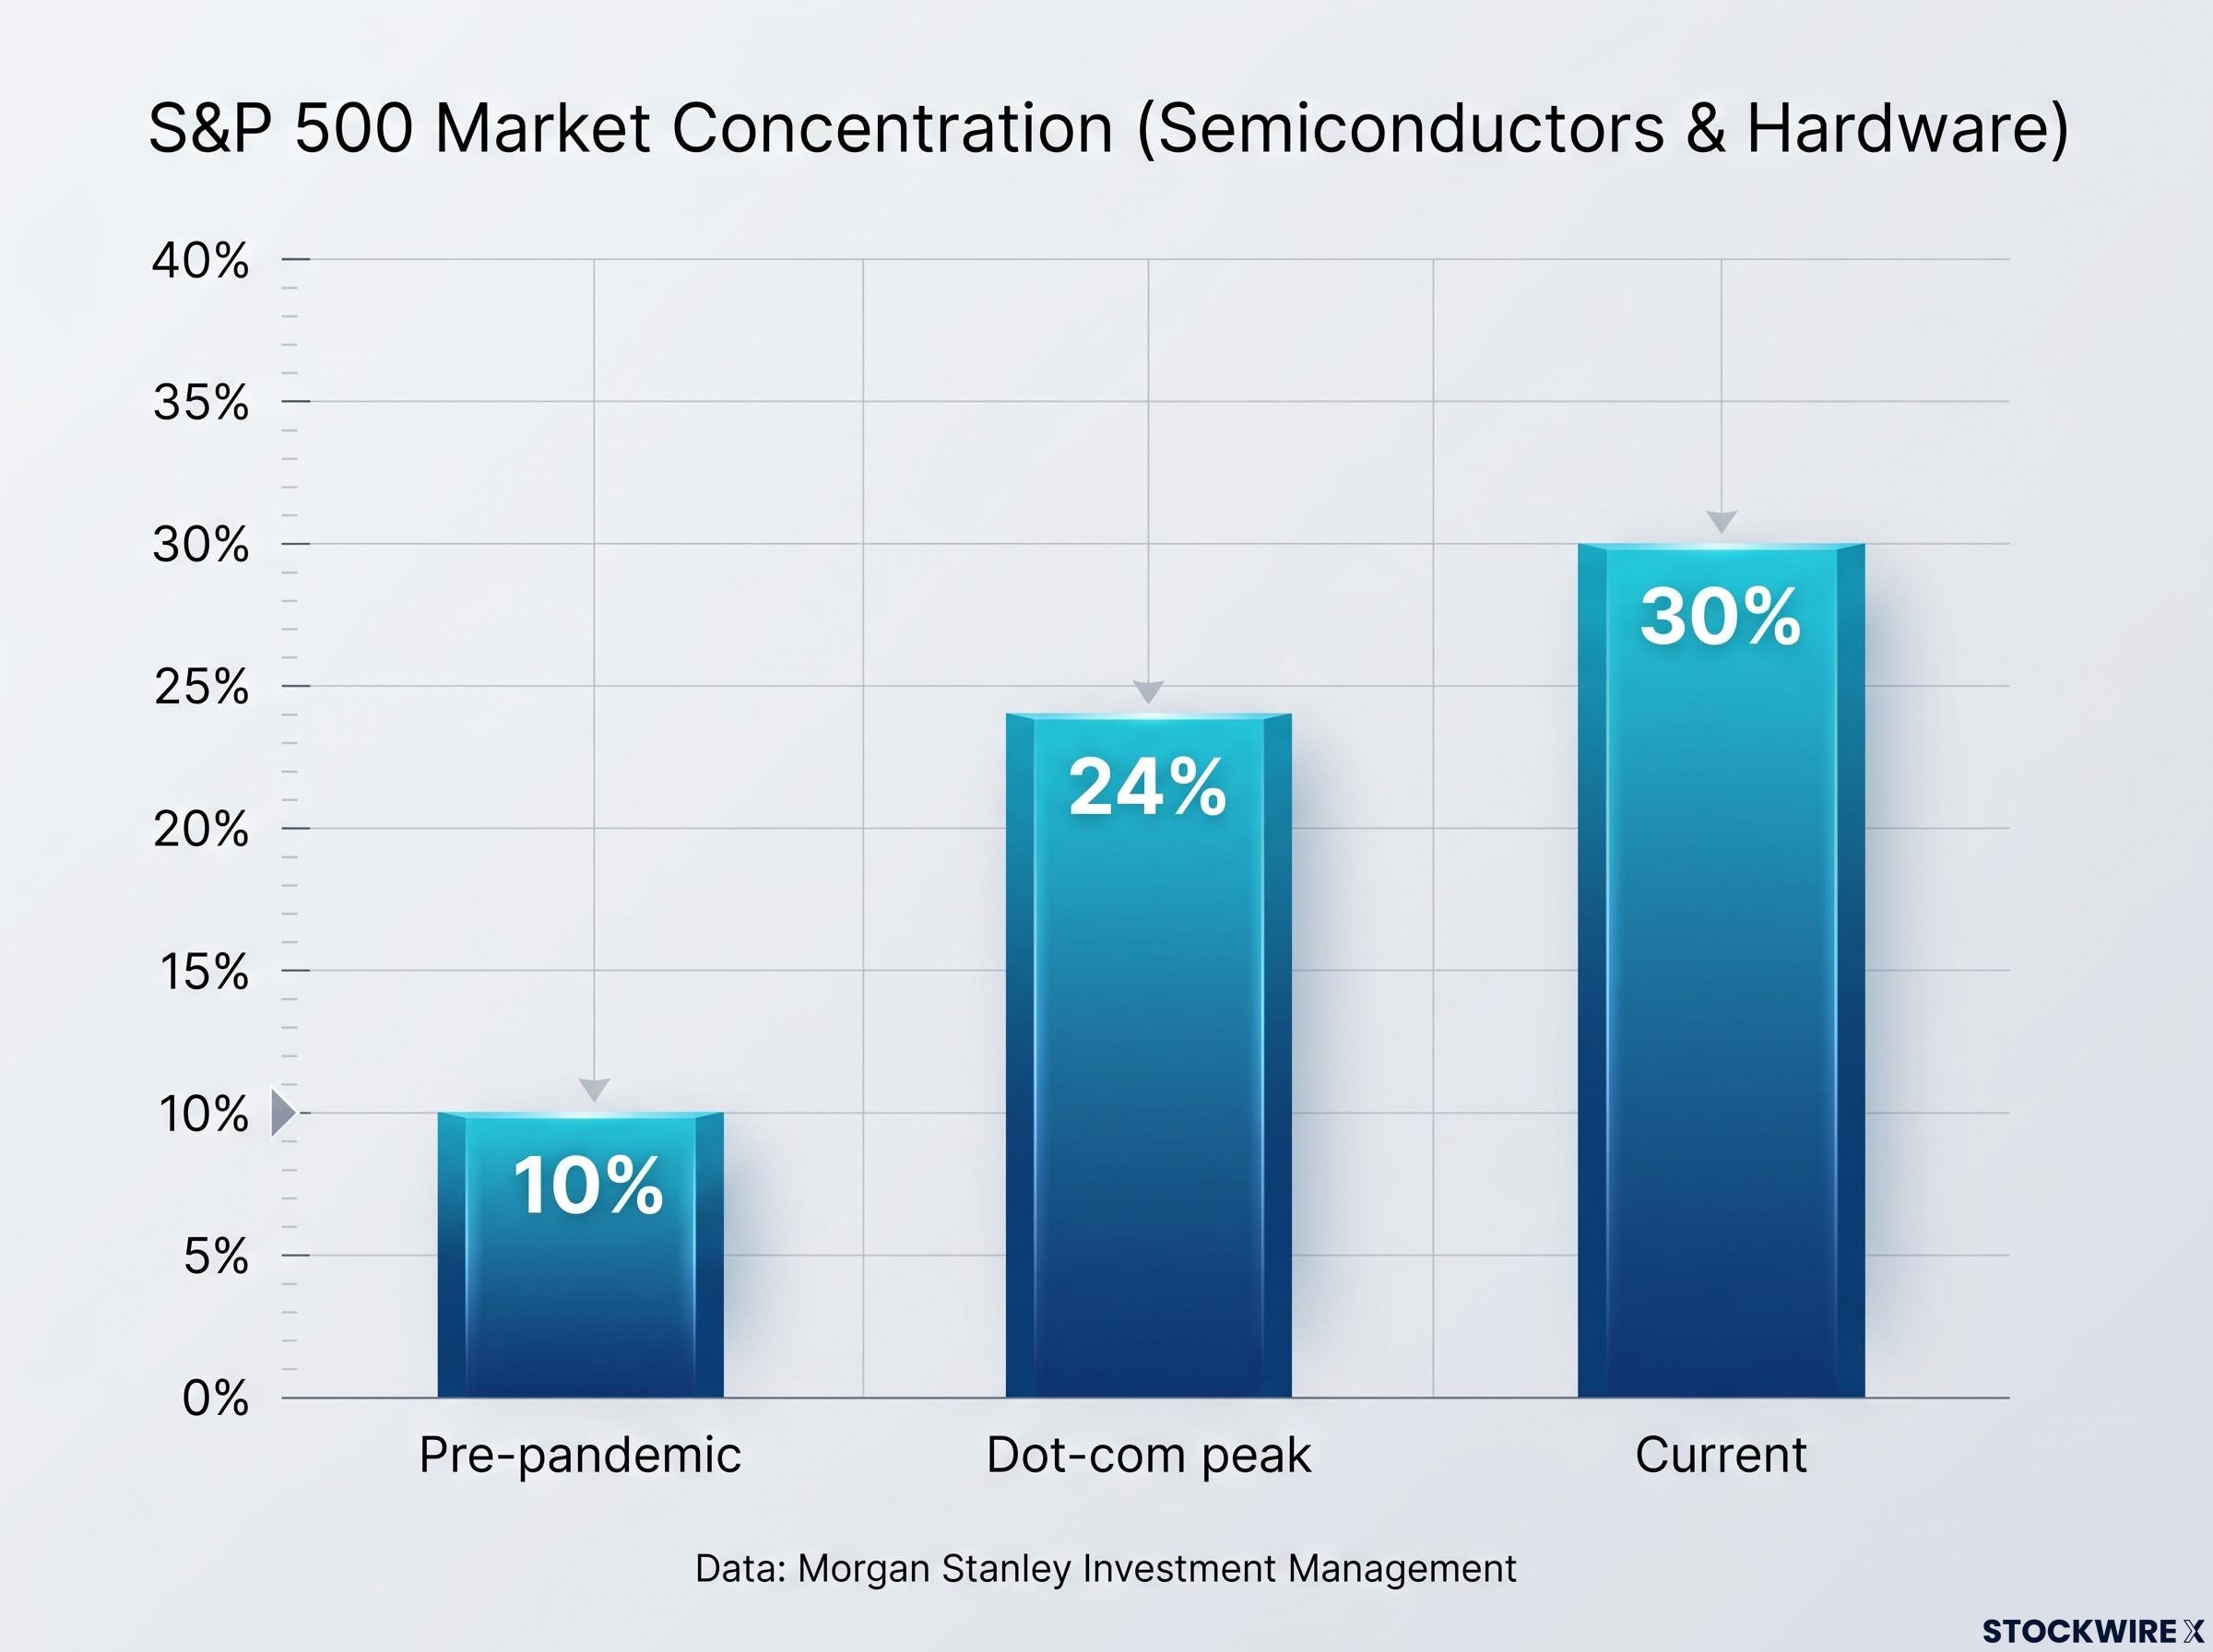
Concentration check Semiconductors and hardware now make up about 30% of S&P 500 market capitalisation, versus roughly 10% before the pandemic and 24% at the dot-com peak, according to Morgan Stanley Investment Management.
A record index tells you the biggest companies are rising. Breadth tells you whether your own typical holding is likely to share in it.
When big ASX news breaks, our subscribers know first
Is the rally broadening? What the latest breadth readings show
With that toolkit in hand, the recent numbers look encouraging at first glance.
Signs of repair
On the day the S&P 500 posted its first record close since August, advancers beat decliners by more than 2-to-1. The share of stocks at four-week highs reached its strongest level in roughly two months. The share above the 200-day average rebounded to 50% from 42% at the end of September.
LPL’s Adam Turnquist reads these signals as pointing to a possible broadening. Schwab Asset Management agrees that breadth and new highs are improving, if only slightly.
Signs of strain
Each improvement falls short of the benchmark that matters. In Q3, the cap-weighted S&P 500 gained about 2% while the equal-weight index lost about 2%, and the equal-weight ETF trailed by 4.6 percentage points in September alone. Goldman Sachs found the median S&P 500 stock sitting nearly 20% below its all-time high.
The 200-day figure also sits well below the 67% average seen at earlier records in this bull market. Sources differ on the precise reading (46.8% on 6 October per Investing.com, roughly 42% on 5 October per PrimeXBT), with 50% the most recent. UBS and Goldman both describe breadth as narrow.
| Measure | Latest reading | What it signals |
|---|---|---|
| Advance/decline | More than 2-to-1 on record-close day | Positive short-term impulse |
| Four-week highs | Highest in about two months | Improvement from a trough |
| Share above 200-day | 50%, up from 42% | Below the 67% prior-record average |
| Share above 50-day | 29.5% (6 October) | Short-term breadth weak |
| Equal-weight vs cap-weighted | About -2% vs +2% in Q3 | Gains concentrated in the largest names |
The 2 October session shows the pattern. The equal-weight fund rose 0.47% against 0.18% for the cap-weighted fund, with four of the seven largest stocks falling, according to Saxo Bank. It was a single day, not a trend.
Some reports have compared today’s gap to conditions near the 2000 peak, which illustrates concentration risk rather than forecasting a crash. Breadth is repairing from a weak base, so treat it as a reason to keep watching, not as proof the rally has become safe.
Rising yields and compressed valuations: how much room is left?
The rate backdrop helps explain why the typical stock is struggling.
The Fed raised its target range by 25 basis points in September to 3.75%-4.00%, its first hike since 2023. Minutes released on 7 October showed many officials see another increase by year-end as potentially appropriate, depending on the data. The 10-year yield stood at 5.22% on 8 October.
Yield milestone The 10-year Treasury yield touched about 5.35% intraday in early October, its highest level since 2002.
The mechanism is simple. A higher risk-free rate lowers the present value of future cash flows, which hits long-duration growth stocks hardest. Bank of America’s Michael Hartnett links tighter financial conditions directly to weaker breadth, because the median stock feels the squeeze first.
Yet stocks have coped, largely because valuations have already reset. Goldman reports the S&P 500 forward price-to-earnings (P/E) ratio, the price investors pay per dollar of expected profit, fell from 22x at the start of 2026 to about 19x. FactSet puts it at 19.1x, below the five-year average of 19.8x and level with the 10-year average.
Goldman’s equity risk premium proxy, the extra return stocks offer over inflation-adjusted bonds, sits around 270 basis points (a 5.2% earnings yield against a 2.6% real 10-year yield). That cushion is thinner than it looks. Three readings compete:
- Earnings-driven: Goldman found equities often rise during rising-rate periods unless increases are extreme, and roughly 30% Q3 growth can offset compression.
- Valuation-risk: a 5%-plus yield and a hiking Fed shrink the margin for error.
- Relative-valuation: multiples have already fallen, so further yield rises hurt less if earnings accelerate, but more if estimates drop.
Buchbinder sees valuation expansion as improbable, and State Street‘s Michael Arone suggests investors may want real yields to ease before embracing cyclical stocks. For you, that means further index gains have to come from earnings growth, not from the market paying more per dollar of profit.
Investors exploring valuation further can read our full explainer on whether the S&P 500 is expensive, which shows how the equity risk premium narrowed as Treasury yields rose.
Can Q3 earnings carry the rally if breadth stays thin?
That puts the spotlight on earnings, and the setup is strong.
- EPS growth: about 29.5% (FactSet), a third straight quarter above 25%; LSEG estimates 30.6%
- Revenue growth: 12.3%
- Guidance: 72 of 116 companies (62%) issued positive guidance
Two signals stand out. Analysts raised S&P 500 estimates by 1.4% during the quarter, against the usual pattern of trimming them. And Q2 earnings grew at their fastest pace since 2021, with over 80% of companies beating forecasts.
The harder question is how widely that growth is spread. On the broad side, all 11 sectors are expected to grow, and energy profits are forecast to more than double on higher oil prices. On the concentrated side, AI is expected to drive double-digit growth across tech, communications, materials and industrials, which keeps the story anchored to the same leaders.
Goldman warns that concentration raises sensitivity to any disappointment from those leaders. Morgan Stanley flagged on 27 May that recent margin strength may prove hard to sustain. In this setup, a headline beat is not enough.
Four things to watch this earnings season:
- Guidance tone: whether leaders raise or trim forward outlooks.
- Estimate revisions: whether the upward drift continues after results.
- Growth outside mega-cap tech: the signal that would turn improving breadth into confirmed breadth.
- Bank results: big banks report from the week of 13 October, with roughly 10% growth expected, giving an early read on the economy.
AI chipmakers: an earnings-driven theme tested by a flat quarter
Chip stocks offer the clearest test of the framework. They rallied in Q2, then stalled in Q3 despite strong results.
The Morningstar Global Semiconductors Index rose just 2% in Q3 while sitting nearly 60% higher year to date. Good news failed to lift shares, which suggests expectations were already running very high.
Even strong results can disappoint when AI stock valuations already price in perfection, as Broadcom’s roughly 15% drop on unchanged guidance showed earlier this year.
The durability case
Morningstar analysts Brian Colello and Tucker Hawthorne argue that AI chip demand and hyperscaler capital spending should last for years. They expect the ecosystem led by Nvidia to sell all it can produce in 2026 and 2027, possibly longer. The median chipmaker swung from 25% overvalued at the end of June to 17% undervalued in early September on their numbers.
Morningstar’s outlook Colello and Hawthorne expect strong near-term earnings, while anticipating that demand and profits slow later this decade.
| Company | Morningstar fair value | Price/fair value | Normalised P/E |
|---|---|---|---|
| Nvidia | $310 | 0.77 | 32.7x |
| Broadcom | $650 | 0.58 | 37.0x |
| Marvell | $360 | 0.79 | 83.4x |
What could dent it
Goldman estimates five major hyperscalers will spend just over $800 billion in 2026 and $1.1 trillion in 2027, but growth slows from nearly 100% to about 37%, as reported by Reuters. Depreciation on that spending will keep rising, potentially eroding later earnings benefits.
Valuation dispersion is wide. “Durable theme” and “cheap stock” are separate claims, so a chip holding needs both a demand case and a valuation case. Marvell at 83x normalised earnings shows how much downside exists if growth expectations slip. This is analysis of a theme, not personalised advice.
Reading breadth, rates and earnings together before the next leg
Put the three signals side by side and a single view emerges. Breadth is improving at the margin from a weak base. Valuations have compressed, leaving little room for expansion. Earnings estimates are strong but concentrated in AI-linked leaders.
Broadening would be confirmed by persistent equal-weight leadership, the 200-day share climbing back toward 67%, and a steady flow of new highs. Warning signs would include weak guidance from the leaders, further yield spikes, or slowing AI capex.
The coming weeks of earnings reports will decide which list fills up first, so the guidance and the breadth readings deserve as much attention as the headline index.
This article is for informational purposes only and should not be considered financial advice. Investors should conduct their own research and consult with financial professionals before making investment decisions. Past performance does not guarantee future results. Financial projections are subject to market conditions and various risk factors.