
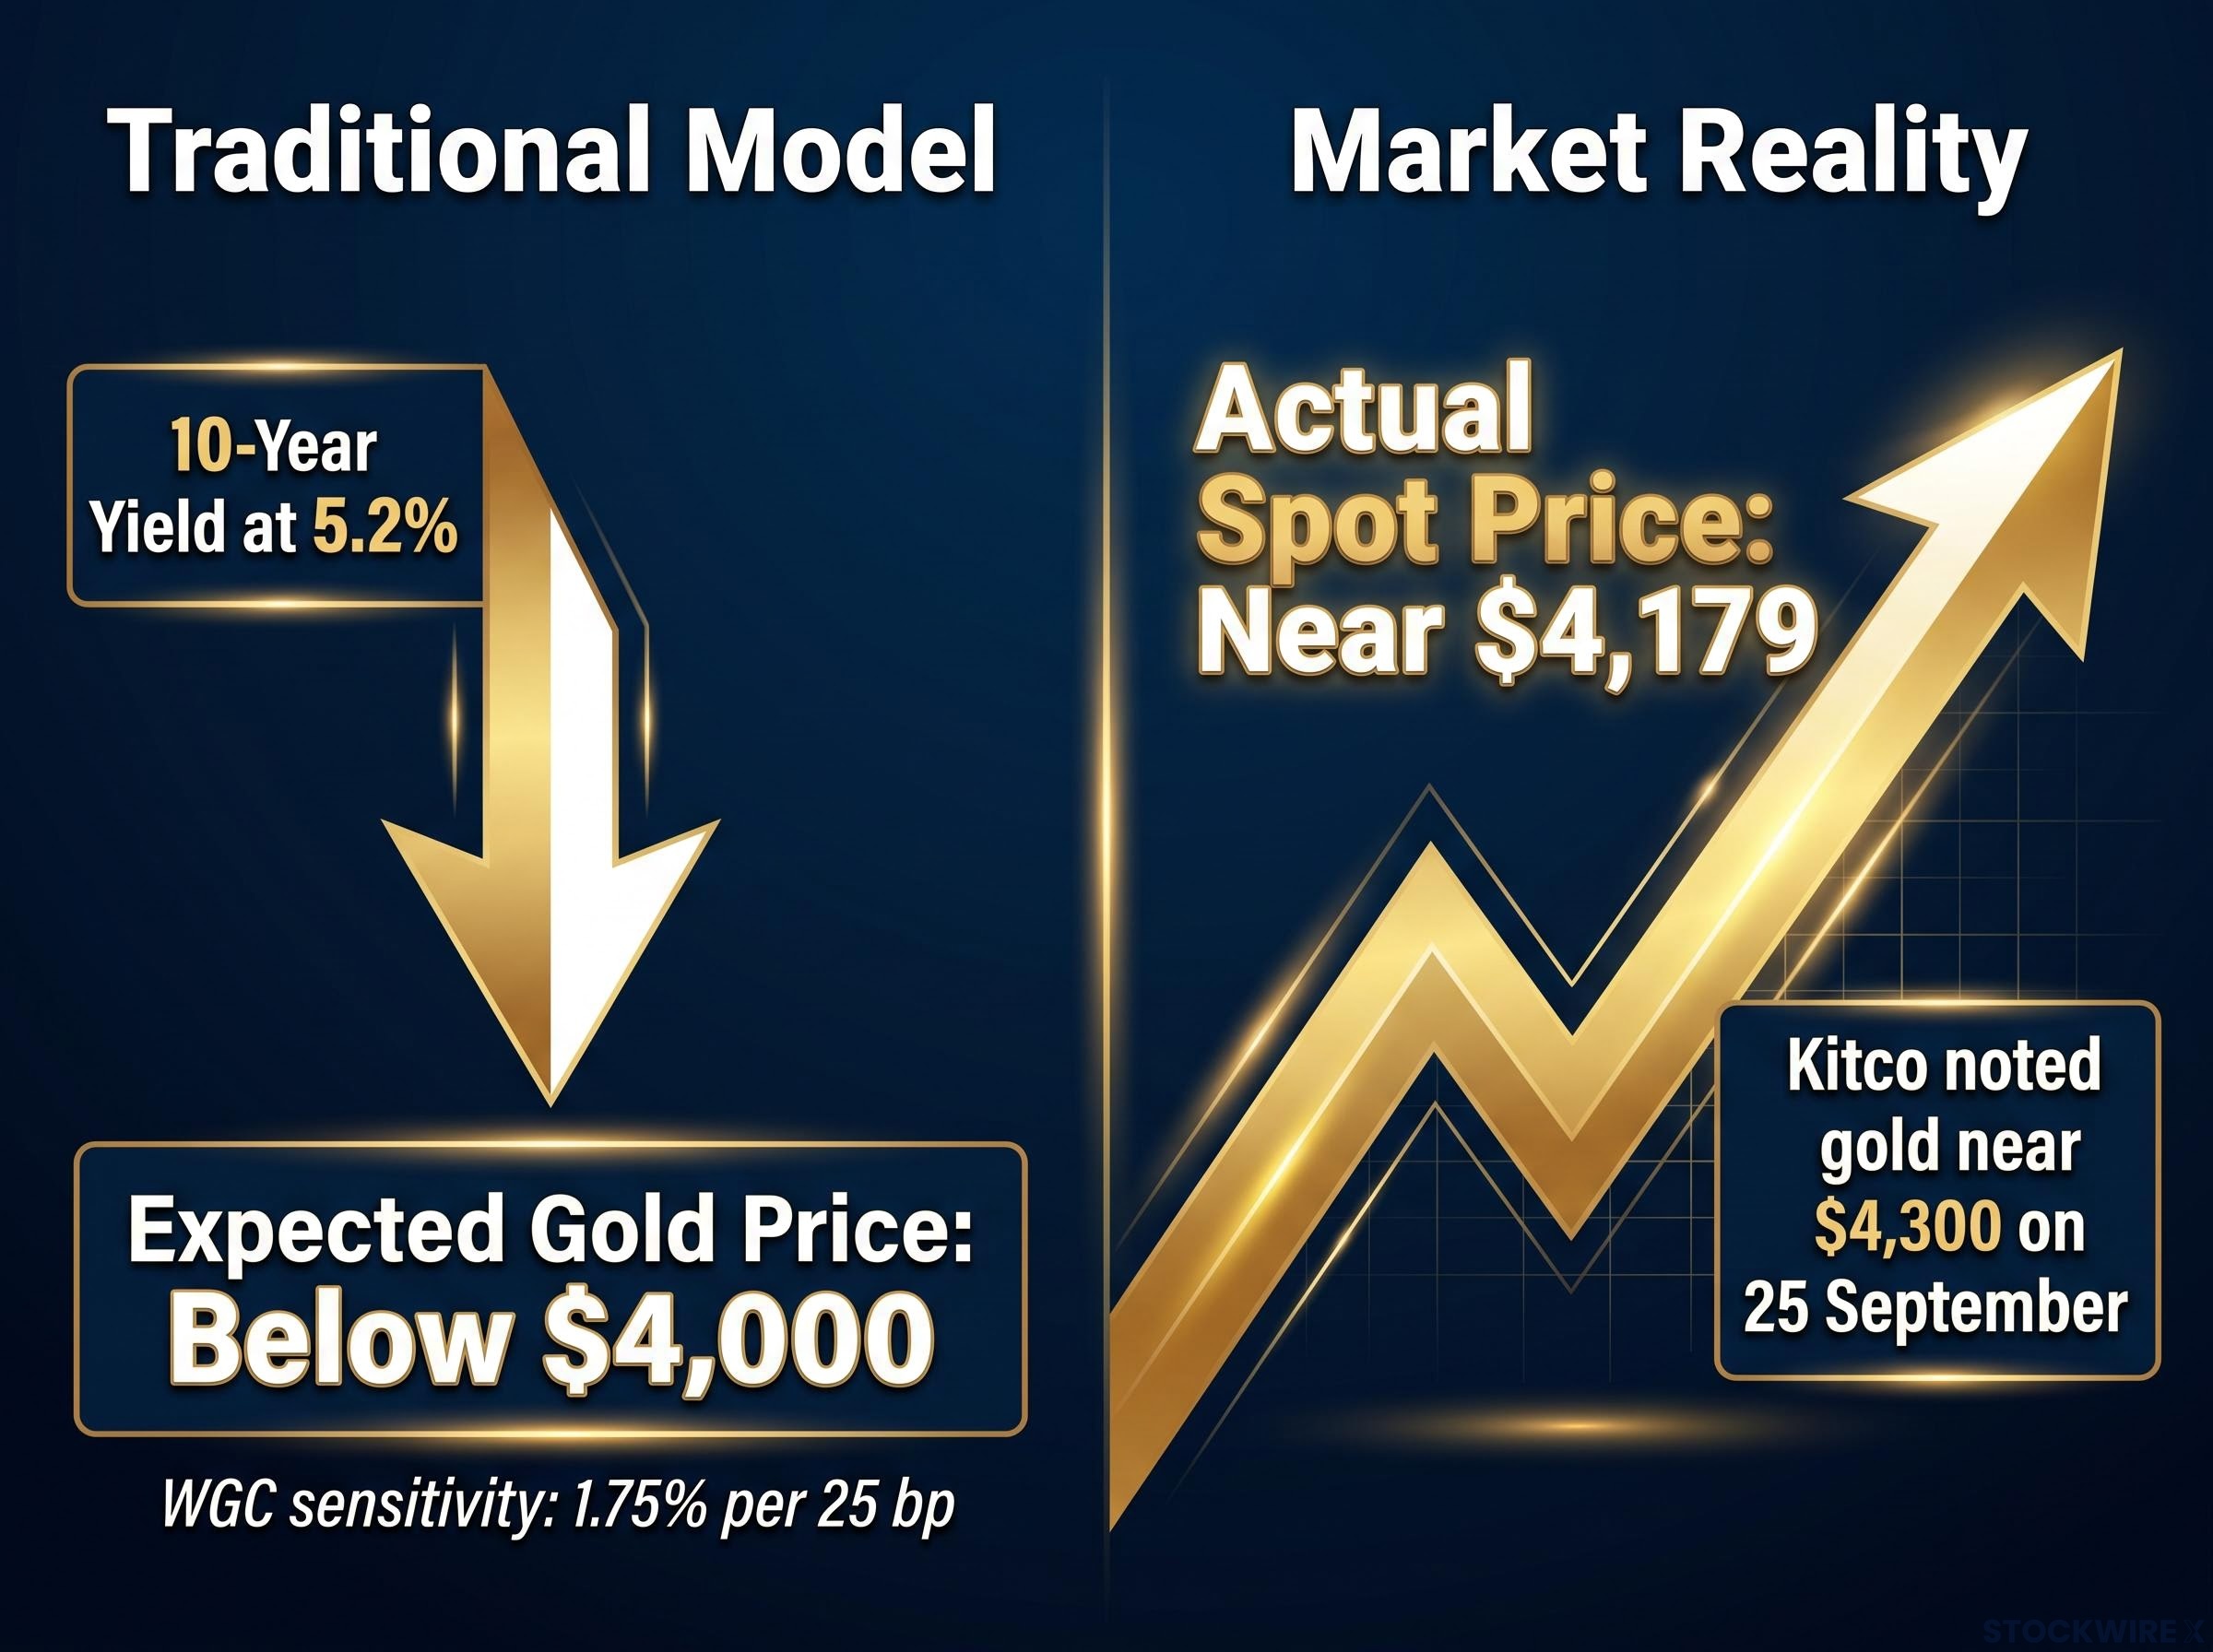
Under the traditional model linking gold to bond yields, gold should be trading below $4,000 an ounce. Instead, spot gold sits near $4,179, even as the US 10-year Treasury yield holds around 5.2%, its highest level in more than two decades.
That gap is easy to misread. Some investors see it as proof that gold is overdue for a fall. Others see it as evidence that the old rules no longer apply.
The more useful view is that rising yields, a firmer US dollar, gold and a narrowing equity market are all part of one connected story. Reading any of them alone can lead you to the wrong conclusion.
This piece gives you a cross-market framework: which price levels matter, where the signals agree or conflict, and how to limit the damage if a bearish call proves wrong. All data is current to 12 October 2026.
Why do rising yields and a strong dollar pressure gold, and why has the link loosened?
The traditional mechanism
Gold pays no interest. When bonds offer a higher return, holding gold costs you the income you could have earned elsewhere. This is called opportunity cost, and it rises as yields climb.
The opportunity cost that matters most is measured in real yields, meaning nominal Treasury returns minus inflation expectations, which explains why gold can hold firm when headline rates climb but inflation fears climb faster.
The dollar adds a second layer. Gold is priced in US dollars, so a stronger dollar makes it more expensive for buyers paying in euros, yen or rupees, which tends to dampen demand.
Both forces are running hot. The US Treasury’s daily curve put the 10-year yield at 5.24% and the 30-year at 5.60% on 9 October 2026, and CNBC reported the 10-year at its highest since 2002. The World Gold Council estimates that gold moves roughly 1.75% for every 25 basis point change in the 10-year yield, all else equal. A basis point is one hundredth of a percentage point.
Why the model keeps missing
Here the logic starts to fray.
Model versus market Kitco noted on 25 September that with the 10-year near 5.2% and the dollar strengthening, gold should have been below $4,000 on the traditional model. It was trading around $4,300.
CME Group described gold’s 2025 rally amid elevated real yields as a significant break from the historical pattern. The competing explanation is structural demand: central banks buying gold, investors hedging geopolitical risk, and concerns over government finances.
| View | Main driver | Effect on gold | Evidence |
|---|---|---|---|
| Traditional macro | Higher real yields, stronger dollar | Bearish | WGC sensitivity of about 1.75% per 25 bp |
| Structural demand | Central-bank buying, geopolitical and fiscal hedging | Supportive despite high yields | Gold near $4,300 when the model implied under $4,000 |
The World Gold Council’s own position is that yields and the dollar still matter but are no longer sufficient on their own. For you, that means a yield model gives a direction of pressure, not a price target. A bearish yield signal needs confirmation from price action and positioning before it is worth acting on.
When big ASX news breaks, our subscribers know first
Where does a trend follower draw the line on gold?
If price is the confirmation, the next question is which prices count. Jason Sen, founder of Day Trade Signals, trades gold as a trend follower and has worked the short side in recent weeks as gold drifted sideways with a downward tilt.
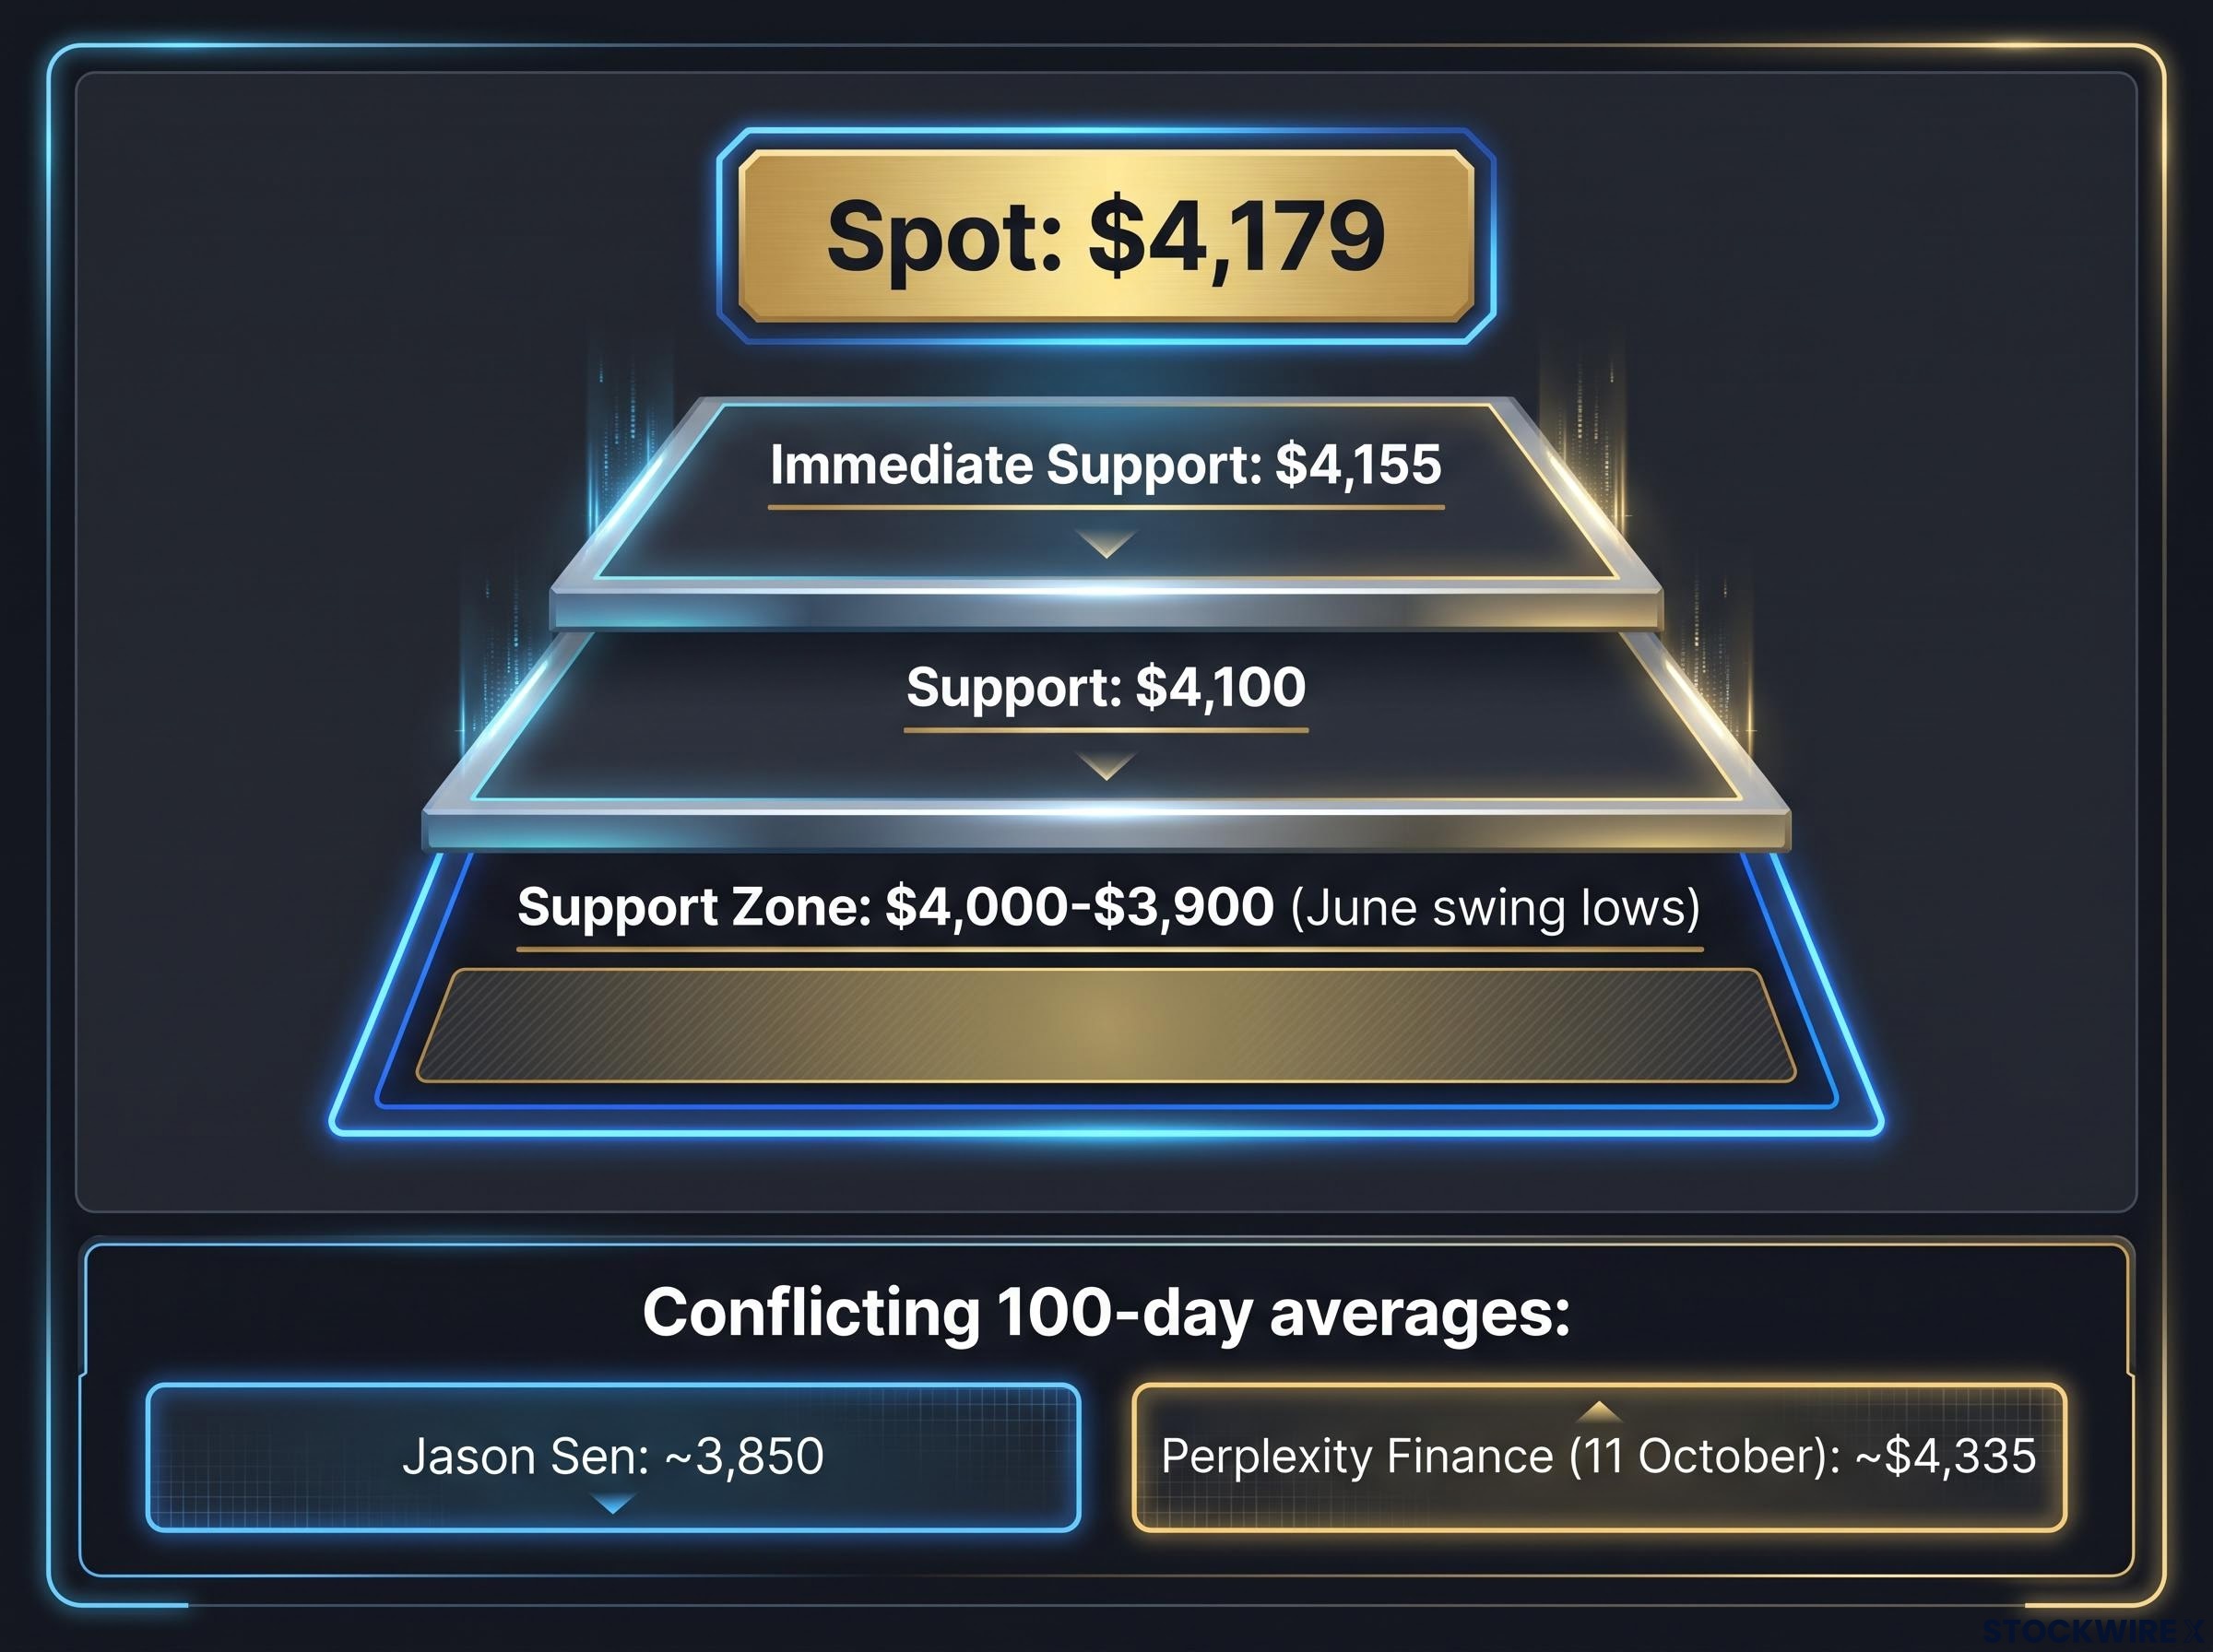
The nearest levels come first. With spot around $4,179, immediate support sits at $4,155, then about $4,100, according to FXEmpire. A close below $4,100 opens the $4,000-$3,900 zone.
Sen sees $4,000 as the more meaningful floor, where swing lows from June meet trend lines stretching back about two and a half years. Below that, he points to the 100-day moving average on the weekly chart, near 3,850, as his line in the sand. A moving average is the average closing price over a set number of periods, used to smooth out daily noise.
| Level | Type | Significance |
|---|---|---|
| $4,155 | Immediate support | First test below spot |
| $4,100 | Support | A close below exposes the lower zone |
| $4,000-$3,900 | Support zone | June swing lows and multi-year trend lines |
| About 3,850 | 100-day average (Sen, unconfirmed) | Sen’s line in the sand |
| About 3,800 | Earlier buying interest | Price bounced before reaching it |
Trend followers treat these breaks as risk rules, not forecasts. A daily or weekly close below a level carries more weight than an intraday dip, though sideways markets can still produce whipsaws, where price breaks a level and then snaps back. The value of any level lies in the action you attach to it in advance, so check the moving average on your own chart settings before relying on a quoted figure.
What does a bearish EUR/USD outlook add to the picture?
The dollar is the thread connecting yields to gold. If US yields pull capital into dollars, a weaker euro is one of the clearest places it shows up.
EUR/USD traded near 1.1232, with support at 1.1212, 1.1200 and 1.1100, and resistance at 1.1272, then 1.1325-1.1350, according to FXEmpire and StoneX. The US Dollar Index (DXY), which measures the dollar against a basket of major currencies, is testing resistance around 102.4-102.5.
Sen reads the euro’s rally of the past two to three years as a bounce inside a longer bear trend, now meeting strong resistance. He sees a possible head-and-shoulders pattern, a chart shape often read as a topping signal, though he concedes it is very large relative to the recent move. He also offers no fundamental reason for dollar strength. His view is chart-led.
That matters, because the long-horizon case is contested.
| Interpretation | Core argument | Source |
|---|---|---|
| Fundamental dollar-bullish | Multi-decade-high US yields, hawkish Fed expectations, European political stress | ABN AMRO, OANDA, DailyForex |
| Technical dollar-bullish | DXY testing resistance; EUR/USD below key averages | DailyForex, FXEmpire |
| Structural dollar-bearish | US deficits and gradual de-dollarisation weigh over a longer horizon | BNP Paribas Wealth Management |
| EUR-supportive | Aggressive Fed-hike pricing may not last; US midterm uncertainty | ABN AMRO, LiteFinance |
BNP Paribas captures the tension: dollar-positive in the short term, bearish over the coming year. The bearish euro call could unravel on:
- A reversal in US rate expectations
- Weaker US economic data
- Falling Treasury yields
- Stabilising French and European political risk
The read for gold is conditional. A dollar breakout confirms the yield headwind only if DXY holds above resistance, so a failed breakout would weaken the bearish gold argument rather than strengthen it.
Why are the indices rising while so many S&P 500 stocks fall?
High yields leave a mark on equities too, though the headline index hides it. Major indices keep climbing while household names such as Oracle, Netflix and Constellation Brands have fallen sharply.
Reading the breadth data
The S&P 500 is capitalisation-weighted, meaning the largest companies have the biggest influence on the index level. A handful of mega-cap technology and AI-linked names can carry the index while the typical stock goes nowhere. Breadth measures how many stocks are actually participating.
| Measure | Reading | Source |
|---|---|---|
| Stocks above 200-day average | 48% (9 October) | ChartRow |
| Stocks above 200-day average | 40.55% (30 September) | Yahoo Finance |
| Stocks above 200-day average | 46% (about 1 October) | BNN Bloomberg |
| Equal-weight vs cap-weight | Equal-weight lagged by 460 bp in September | Parallax |
The readings differ by date and method, but they point the same way. Goldman Sachs commentary described breadth as the weakest since the dot-com bubble, with the median S&P 500 stock nearly 20% below its all-time high. A chart cited in the interview claimed more than 134 S&P 500 stocks are down over 40% this year.
Macro pressure or company problems?
Rising long-term yields hurt companies with rich valuations, heavy borrowing or profits far in the future. Not every decline is macro, though:
- Oracle: heavy capital spending, rising debt and negative free cash flow
- Netflix: weaker growth expectations and the collapse of its bid for Warner Bros. Discovery
- Constellation Brands: soft consumer demand and margin pressure from aluminium tariffs
Narrow leadership is not automatically a sell signal, since it can persist. It is a concentration warning: an index-level holding depends on a few companies’ earnings and is more exposed to a yield spike than the headline level suggests.
For readers wanting the full picture on narrow leadership, our detailed coverage of market breadth examines why breadth warnings have repeatedly failed as timing tools.
How can a put spread define the risk on a bearish gold call?
Faced with gold, bonds and equities that could not all keep rising together, the interview’s host found it inconsistent to be long all three. He chose a bearish gold position, expressed through a put spread on gold futures expiring within the week.
A bear put spread means buying a put option at a higher strike price and selling one at a lower strike, paying a net premium. A put gives the holder the right to sell at a set price. Your maximum loss is the premium paid, and your maximum profit is the gap between the strikes minus that premium.
The structure removes the open-ended risk of shorting futures outright. It can still lose:
- Time decay accelerates near expiry, which bites hardest on a spread with days left
- Falling implied volatility can erode value even if gold edges lower
- The short put caps profit below its strike
- Futures-option margin and contract specifications add complexity
- A gap or central-bank announcement can move gold through several levels at once
Support levels are not guarantees. A geopolitical shock can make any chart level irrelevant overnight.
The practical synthesis has three parts:
- Act on a daily or weekly closing price, not an intraday break.
- Size the position to account for gold’s volatility, so a false break causes no unacceptable damage.
- Keep the premium small enough that losing all of it is affordable.
A defined-risk spread caps your loss but does nothing to raise the odds of being right. Position size matters more than strike selection. This is educational analysis, not personal advice.
What the cross-market read says, and what would change it
The common thread is yields. At current levels they pressure gold, lift the dollar and strain expensive equities, while a few mega-caps mask the damage underneath.
The checklist is short:
- Gold: $4,155, $4,100, $4,000, $3,900
- EUR/USD: 1.1200 and 1.1100
- DXY: about 102.4-102.5
- US 10-year yield: near 5.2%
The bearish gold case weakens if yields fall, the dollar breakout fails, or central-bank buying keeps absorbing supply. Your decision is less about predicting direction than about deciding in advance which closes would change your positioning, and how much you are prepared to lose finding out.
Central-bank buying running near 1,000 tonnes a year is largely price-insensitive, since sovereigns are diversifying reserves rather than chasing returns, which is why it can absorb supply during yield-driven dips.
Past performance does not guarantee future results. Financial projections are subject to market conditions and various risk factors. This article is for informational purposes only and should not be considered financial advice. Investors should conduct their own research and consult with financial professionals before making investment decisions.