Gold slid on Monday, 12 October 2026, after failing to hold the $4,200 area. Spot traded around $4,155-$4,163 an ounce, leaving the gold price today below a level it held earlier in the month. The size of the drop depends on the snapshot: the original reading showed roughly 1.5%, while other outlets reported smaller or larger moves at different points in the session.
A firmer US dollar, elevated Treasury yields and energy-driven inflation worries are strengthening bets that the Federal Reserve will raise interest rates. The metal is heading for a second straight weekly decline.
Here is why gold is falling while Middle East conflict escalates, which price levels decide its next move, and how two inflation reports this week could set its direction.
Why is gold falling when Middle East conflict is escalating?
On paper, gold should be rallying. Houthi-linked attacks have reached Saudi Arabia, Iranian strikes have hit ships near Hormuz, a proposed Iran settlement to reopen the strait collapsed, and Ukrainian strikes on Russian oil facilities have continued.
Gold fell anyway.
The answer lies in how the conflict reaches markets. It arrives through oil first. Even after President Trump announced a ceasefire on attacks against energy sites between Russia and Ukraine, oil kept rising. The chain runs like this:
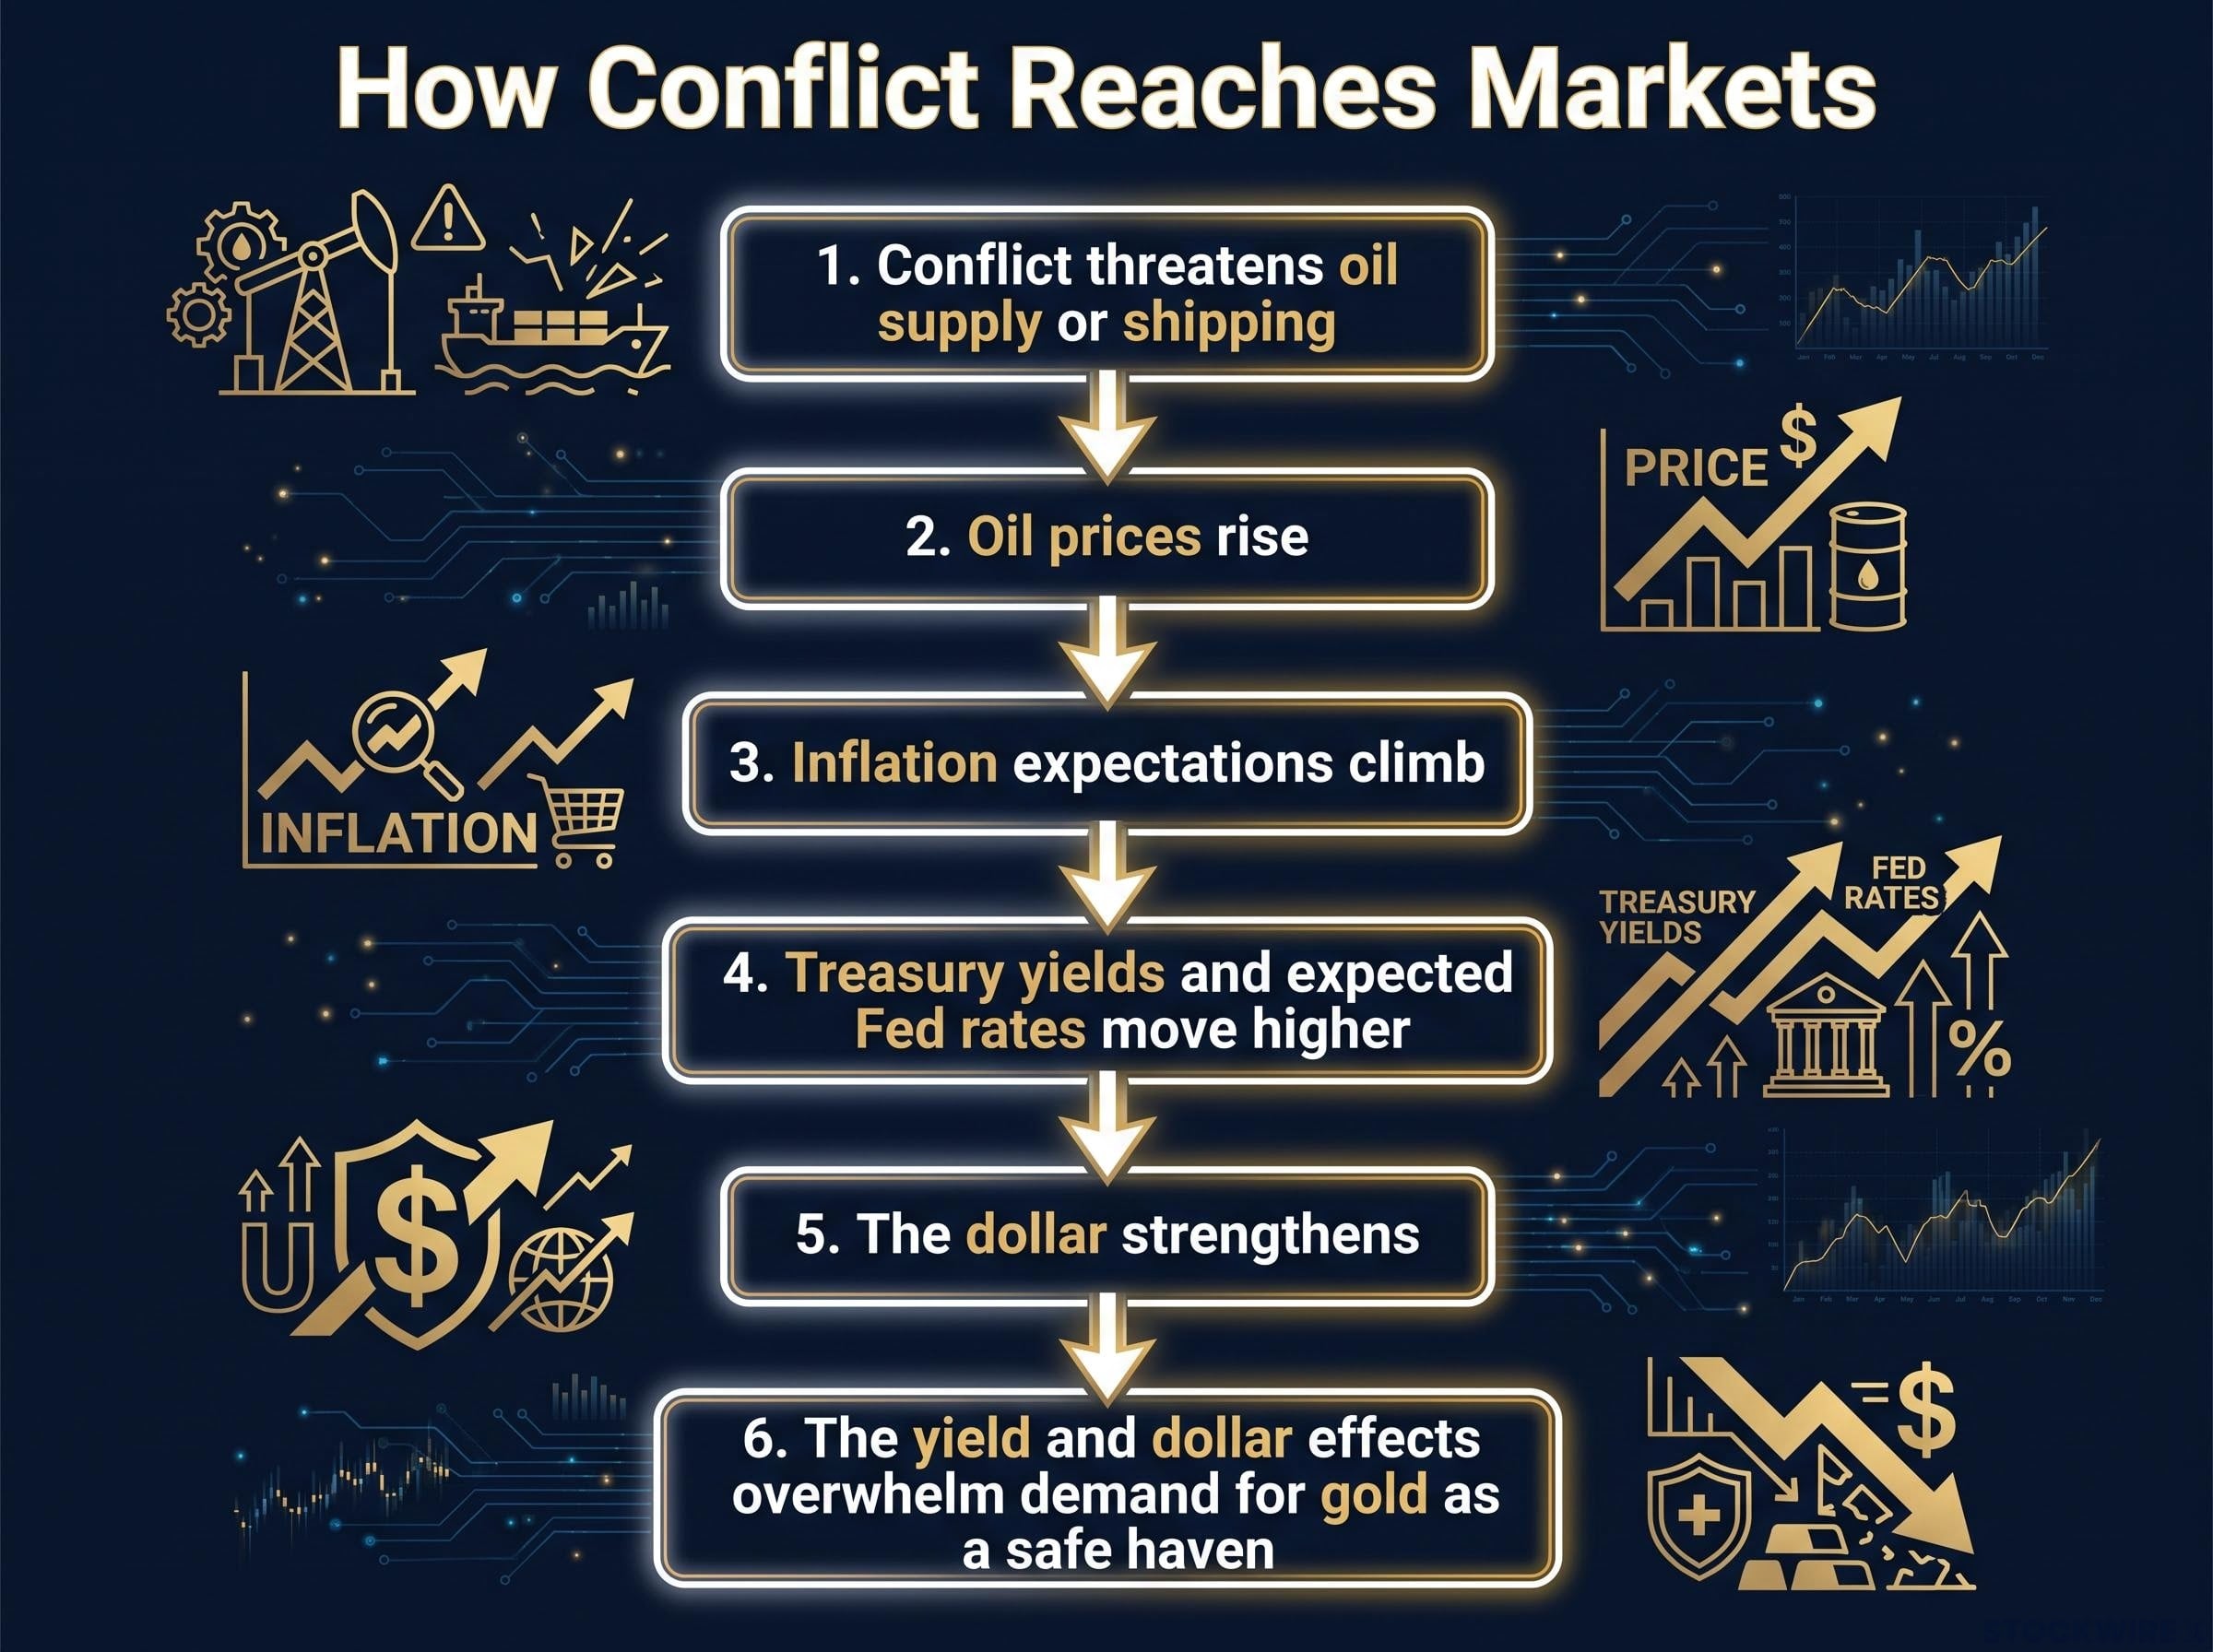
- Conflict threatens oil supply or shipping.
- Oil prices rise.
- Inflation expectations climb.
- Treasury yields and expected Fed rates move higher.
- The dollar strengthens.
- The yield and dollar effects overwhelm demand for gold as a safe haven.
The Fed is the transmission point. Beth Hammack of the Cleveland Fed said a restrictive stance is appropriate and that she prefers smaller adjustments made relatively quickly, though she did not explicitly endorse an October hike. Fed Chair Kevin Warsh favours a “quieter” Fed and has made no commitment.
| Measure | Reading | Why it matters |
|---|---|---|
| US Dollar Index | 102.12-102.56 | A stronger dollar makes gold dearer abroad |
| 10-year Treasury yield | 5.23-5.24% | Raises the cost of holding a non-yielding asset |
| WTI crude | $92.44-$93.69/bbl | Feeds inflation expectations |
| Fed hike odds | 17-20% October; above 75% December | Higher rates pressure gold |
Readings vary because sources captured them at different times. CNBC, updated on 12 October, put December hike odds above 75%, while one provider showed nearly 90%.
The pattern has history. On 22 April 2024, gold fell more than 2% as Middle East tensions eased. Earlier in 2026, an escalation produced a drop of nearly 4% when markets shifted from expected cuts to a possible hike.
For you, conflict headlines alone cannot tell you gold’s direction. What matters is whether the conflict pushes oil, yields and the dollar higher.
Gold’s drivers extend beyond headlines, and real interest rates, the dollar and central bank buying together explain why the metal can fall even as geopolitical risk climbs.
Why gold moves against the dollar and real yields
Gold is priced in US dollars. When the dollar strengthens, buyers using other currencies pay more for each ounce, which can reduce demand.
Gold also pays no interest or dividend. Real yields are bond returns after inflation, and when they rise, holding gold means giving up more income elsewhere. UBS and the World Gold Council both point to this opportunity cost.
That is why a geopolitical premium can be overwhelmed.
Where are the key levels, and what could break them?
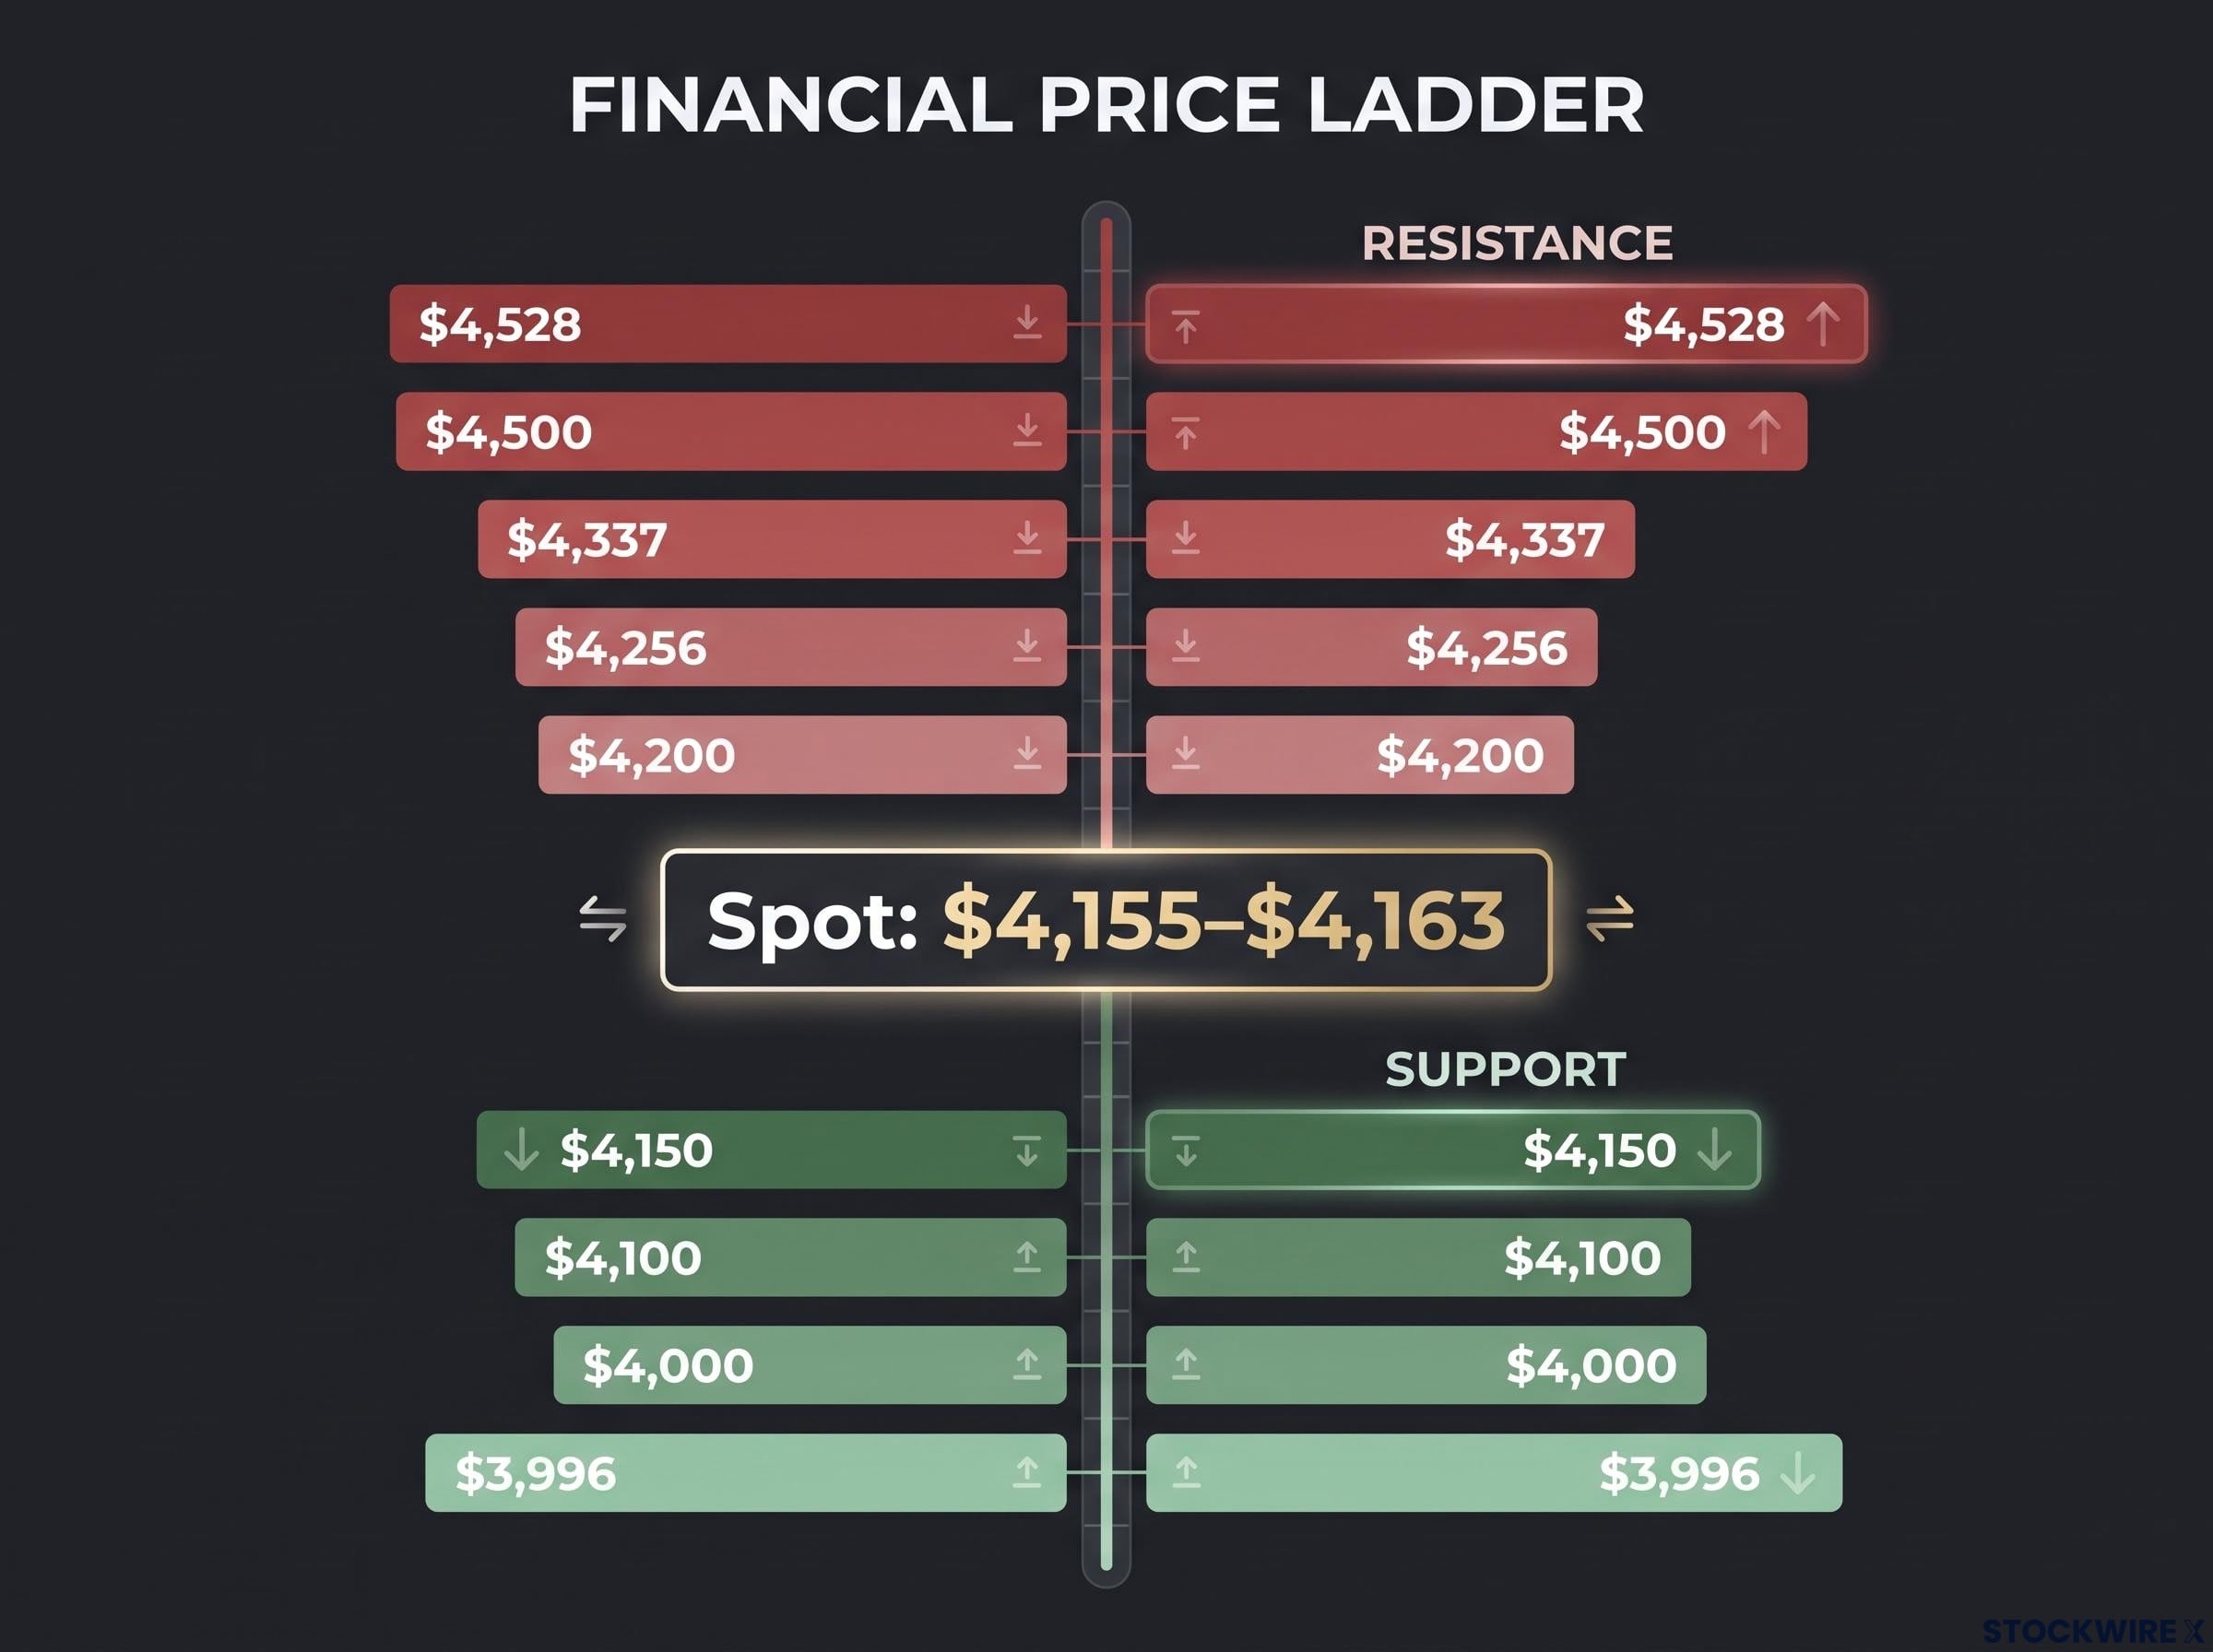
That macro pressure is visible on the chart. Gold remains in a downtrend of lower highs and lower lows, with spot near $4,155-$4,163 after a recent high between $4,203.61 and $4,217, depending on the source.
| Level | Type | Significance |
|---|---|---|
| $4,528 | Resistance | 200-day SMA |
| $4,500 | Resistance | Further ceiling |
| $4,337 | Resistance | 50-day SMA |
| $4,256 | Resistance | 100-day SMA |
| $4,200 | Resistance | Reclaim weakens bearish setup |
| $4,150 | Support | Immediate line |
| $4,100 | Support | Next level down |
| $4,000 | Support | Psychological and institutional-demand zone |
| $3,996 | Support | 29 July cycle low |
A simple moving average (SMA) is the average closing price over a set number of days. The relative strength index (RSI), a momentum gauge, is rising but still below 50, so momentum has improved slightly without confirming a reversal.
The chart now splits two ways:
- Bearish path: A drop under $4,150 opens $4,100, then the $3,996 cycle low and the $4,000 zone. Bank of America sees possible downside toward $3,750, and another technical forecast targets about $3,920 before consolidation.
- Bullish path: Reclaiming $4,200 weakens the bearish setup, with $4,256 and $4,337 as the next hurdles.
Key level: A sustained close below $4,000 would favour the bearish scenario.
This tells you $4,150 is the first test of whether sellers are in control. A daily close, not an intraday dip, gives any break its weight.
For readers wanting to apply these levels, our dedicated guide to reading gold support and resistance explains how confirmed daily closes separate real breakouts from noise.
What do CPI, PPI and the analysts say about the $4,000 floor?
The data calendar could decide which path plays out. The consumer price index (CPI) measures consumer prices, while the producer price index (PPI) tracks prices businesses receive.
| Release | Date | Consensus | Prior |
|---|---|---|---|
| Headline CPI | Wednesday 14 October | +0.6% m/m; 3.6% y/y | 3.4% y/y |
| Core CPI | Wednesday 14 October | +0.2% m/m; 2.5% y/y | Not available |
| Final-demand PPI | Thursday 15 October | +0.6% m/m; 5.4% y/y | Not available |
| Core PPI | Thursday 15 October | +0.3% m/m | +0.2% m/m |
The PPI figures come from a Wells Fargo preview, and one CPI preview sits at 3.7%. Either way, consensus implies inflation accelerating from 3.4%.
Hot prints would reinforce hike repricing and lift real yields and the dollar. Soft prints could reverse that. A ceasefire cuts both ways, removing the safe-haven premium while reducing expected Fed tightening.
For you, a hot inflation print is the most direct threat to $4,000 this week, and a soft one is the cleanest route to relief.
How the bank forecasts differ
- UBS: Giovanni Staunovo sees $4,000 as likely support, with a recovery toward $4,600 by December 2026.
- Goldman Sachs: Cut its 2026 average forecast from $4,560 to $4,490, and in September trimmed its year-end estimate from $4,900 to about $4,650 (some coverage still cites $4,900).
- Bank of America: Expects a Q4 average around $4,000, with downside toward $3,750; its stress case has oil near $150.
The spread between UBS, Goldman and Bank of America reflects how hard gold price prediction is, given that the metal has no cash flows or valuation anchor to pin a forecast to.
The counterweight is structural demand. The World Gold Council reports central-bank buying has averaged roughly 1,000 tonnes a year since 2022, with 244 tonnes in Q1 2026, while exchange-traded funds (ETFs) drew a record $31 billion in Q3 2026, taking holdings to 4,256 tonnes.
What to watch before gold’s next move
The selloff reflects geopolitical risk travelling through oil, yields, hike odds and the dollar. The decisive tests are this week’s inflation data, the $4,150 line and the $4,000-$3,996 zone.
- Wednesday’s CPI release
- Thursday’s PPI release
- Whether gold closes above or below $4,150
- Fed commentary, including from Warsh
The 27-28 October Fed meeting will show how far this week’s data has moved policymakers.
This article is for informational purposes only and should not be considered financial advice. Investors should conduct their own research and consult with financial professionals before making investment decisions. Past performance does not guarantee future results. Financial projections are subject to market conditions and various risk factors.