
The S&P 500 is trading around 7,400-7,600, close to record territory, yet one of Wall Street’s most-watched sentiment gauges reads 8.1, above the 8.0 line that marks a contrarian sell. Underneath the index, a net 50% of global equity indexes now trade below both their 50-day and 200-day moving averages, the weakest breadth since April 2025. That gap between the headline and the internals sits at the centre of the midterms stock market outlook.
According to published coverage of Bank of America’s (BofA) Flow Show and fund-flow reports, the strategy team led by Michael Hartnett links the warning to 54 central bank rate hikes so far in 2026, a 30-year Treasury yield near 5.7%, and a US midterm election it sees as the likeliest trigger for a 10% equity move into 2027.
None of this is a forecast. It is a sentiment signal, and it needs to be read as one.
Here is what the signal measures, where it has failed before, and which of BofA’s positioning calls hold up if the midterms do bring volatility.
Why is a market near record territory flashing a sell signal?
On the surface, equities look resilient. The S&P 500 sat near 7,624 on 1 October and around 7,400 by 5 October, a pullback that still leaves it elevated.
The internals tell a different story. BofA’s Bull & Bear Indicator fell to 8.1 from 8.8, after an earlier reading of 9.3. Two forces drove the decline: weaker breadth and wider spreads on high-yield bonds and subordinated bank debt, which is junior debt that gets repaid after other creditors if a bank fails.
The pressure extends to policy. Fed funds futures price a 17% chance of an October rate hike and 81% for December, while the 30-year Treasury touched 5.73% intraday, a 24-year high, according to Saxo. Investors have also been adding hedges against a sharp decline. One caveat: the 54-hike count is relayed through Futunn’s coverage of BofA’s fund-flows report, and no breakdown by central bank was found.
| Metric | Latest value | Reference point | What it signals |
|---|---|---|---|
| Bull & Bear Indicator | 8.1 | Sell above 8.0; prior 8.8, 9.3 | Sentiment still stretched |
| Breadth | Net 50% below both MAs | Weakest since April 2025 | Narrow leadership |
| Fed hike odds | 17% Oct, 81% Dec | 54 global hikes in 2026 | Restrictive policy persists |
| 30-year Treasury | About 5.67-5.68% | Intraday high 5.73% | Pressure on equity valuations |
The breadth figure is a concentration story. Money has crowded into a narrow set of AI and technology names while the broader market gets left behind. A strong index with weak participation tells you that returns depend on a handful of crowded stocks, so your portfolio’s risk may be more concentrated than the headline level suggests.
Narrow market breadth is a condition to monitor rather than a timing tool, because earnings and balance sheets decide whether concentration proves fragile or durable.
Breadth and the 88% threshold
BofA’s contrarian buy signal triggers only when a net 88% of global indexes sit below both moving averages. At 50%, the market is a long way from that kind of capitulation.
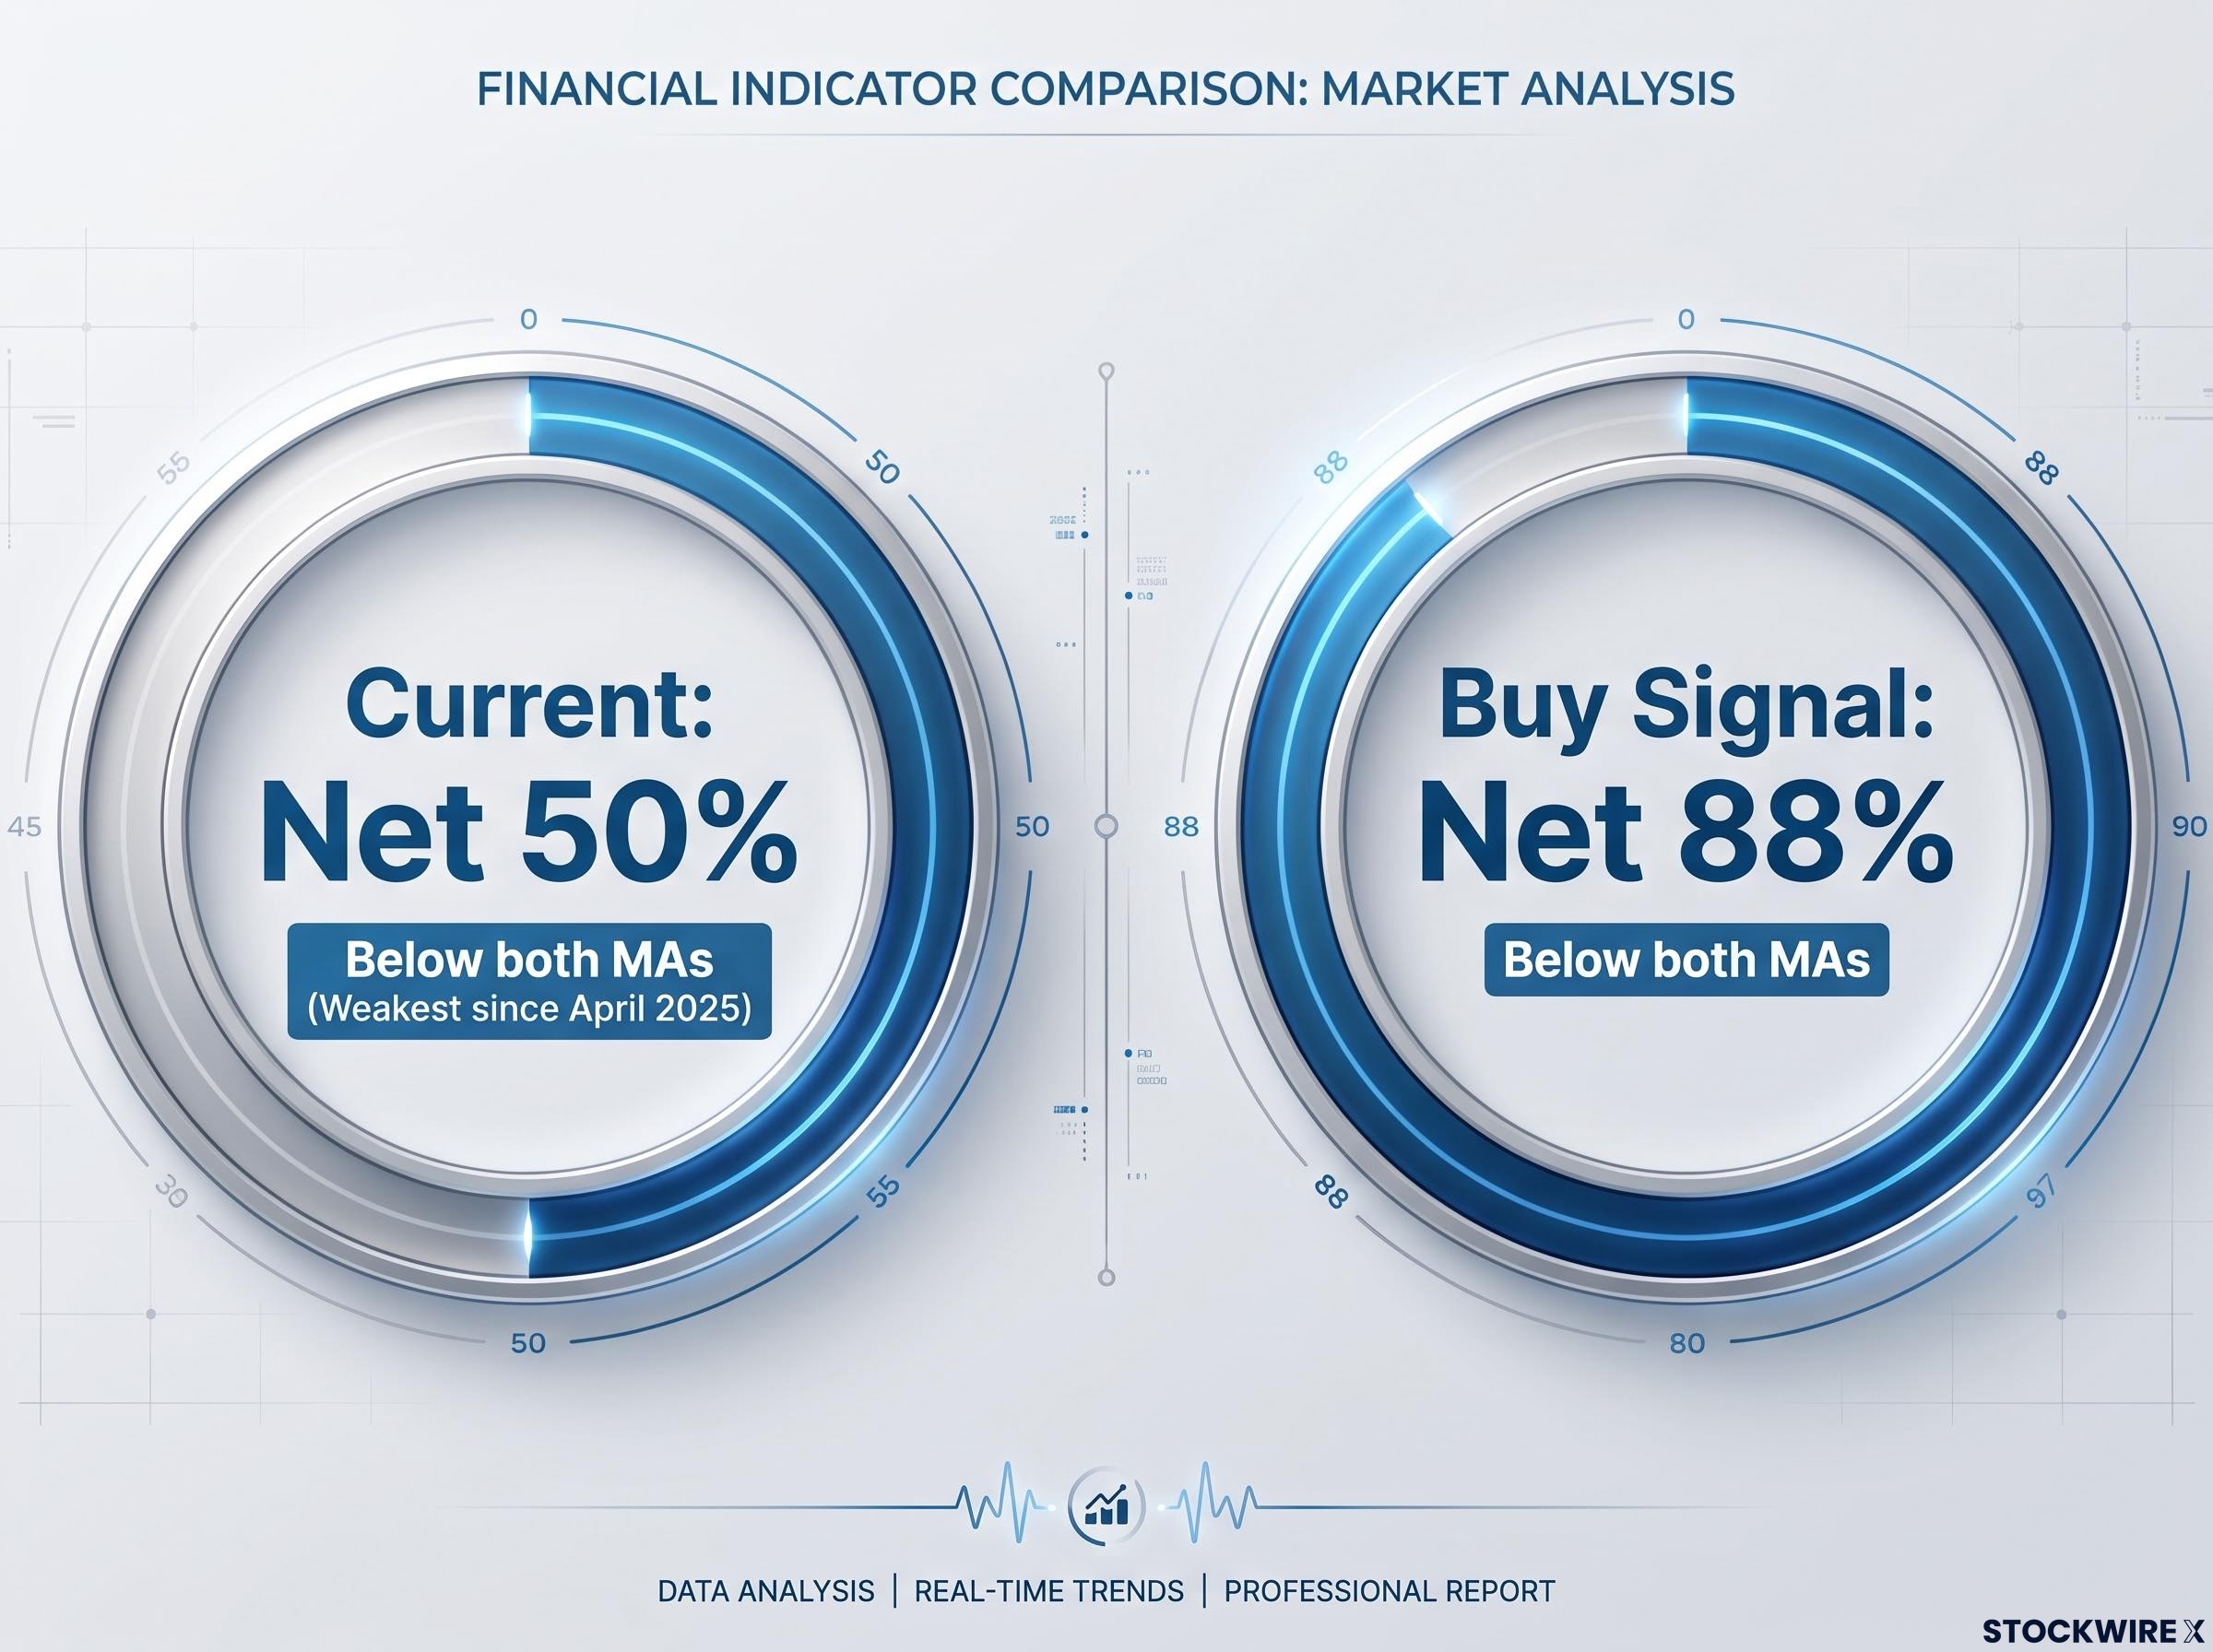
Closing the gap would take a fast reversal in the tech-heavy US, Taiwan and Korea indexes. That is why BofA sees no buy signal on the horizon.
When big ASX news breaks, our subscribers know first
How the Bull & Bear Indicator works, and where it misleads
What the 0-10 scale measures
Think of the indicator as a dial running from 0 to 10. A reading near 0 means panic and capitulation, which BofA treats as a contrarian buy. Readings above 8.0 mean euphoria and crowding, a contrarian sell.
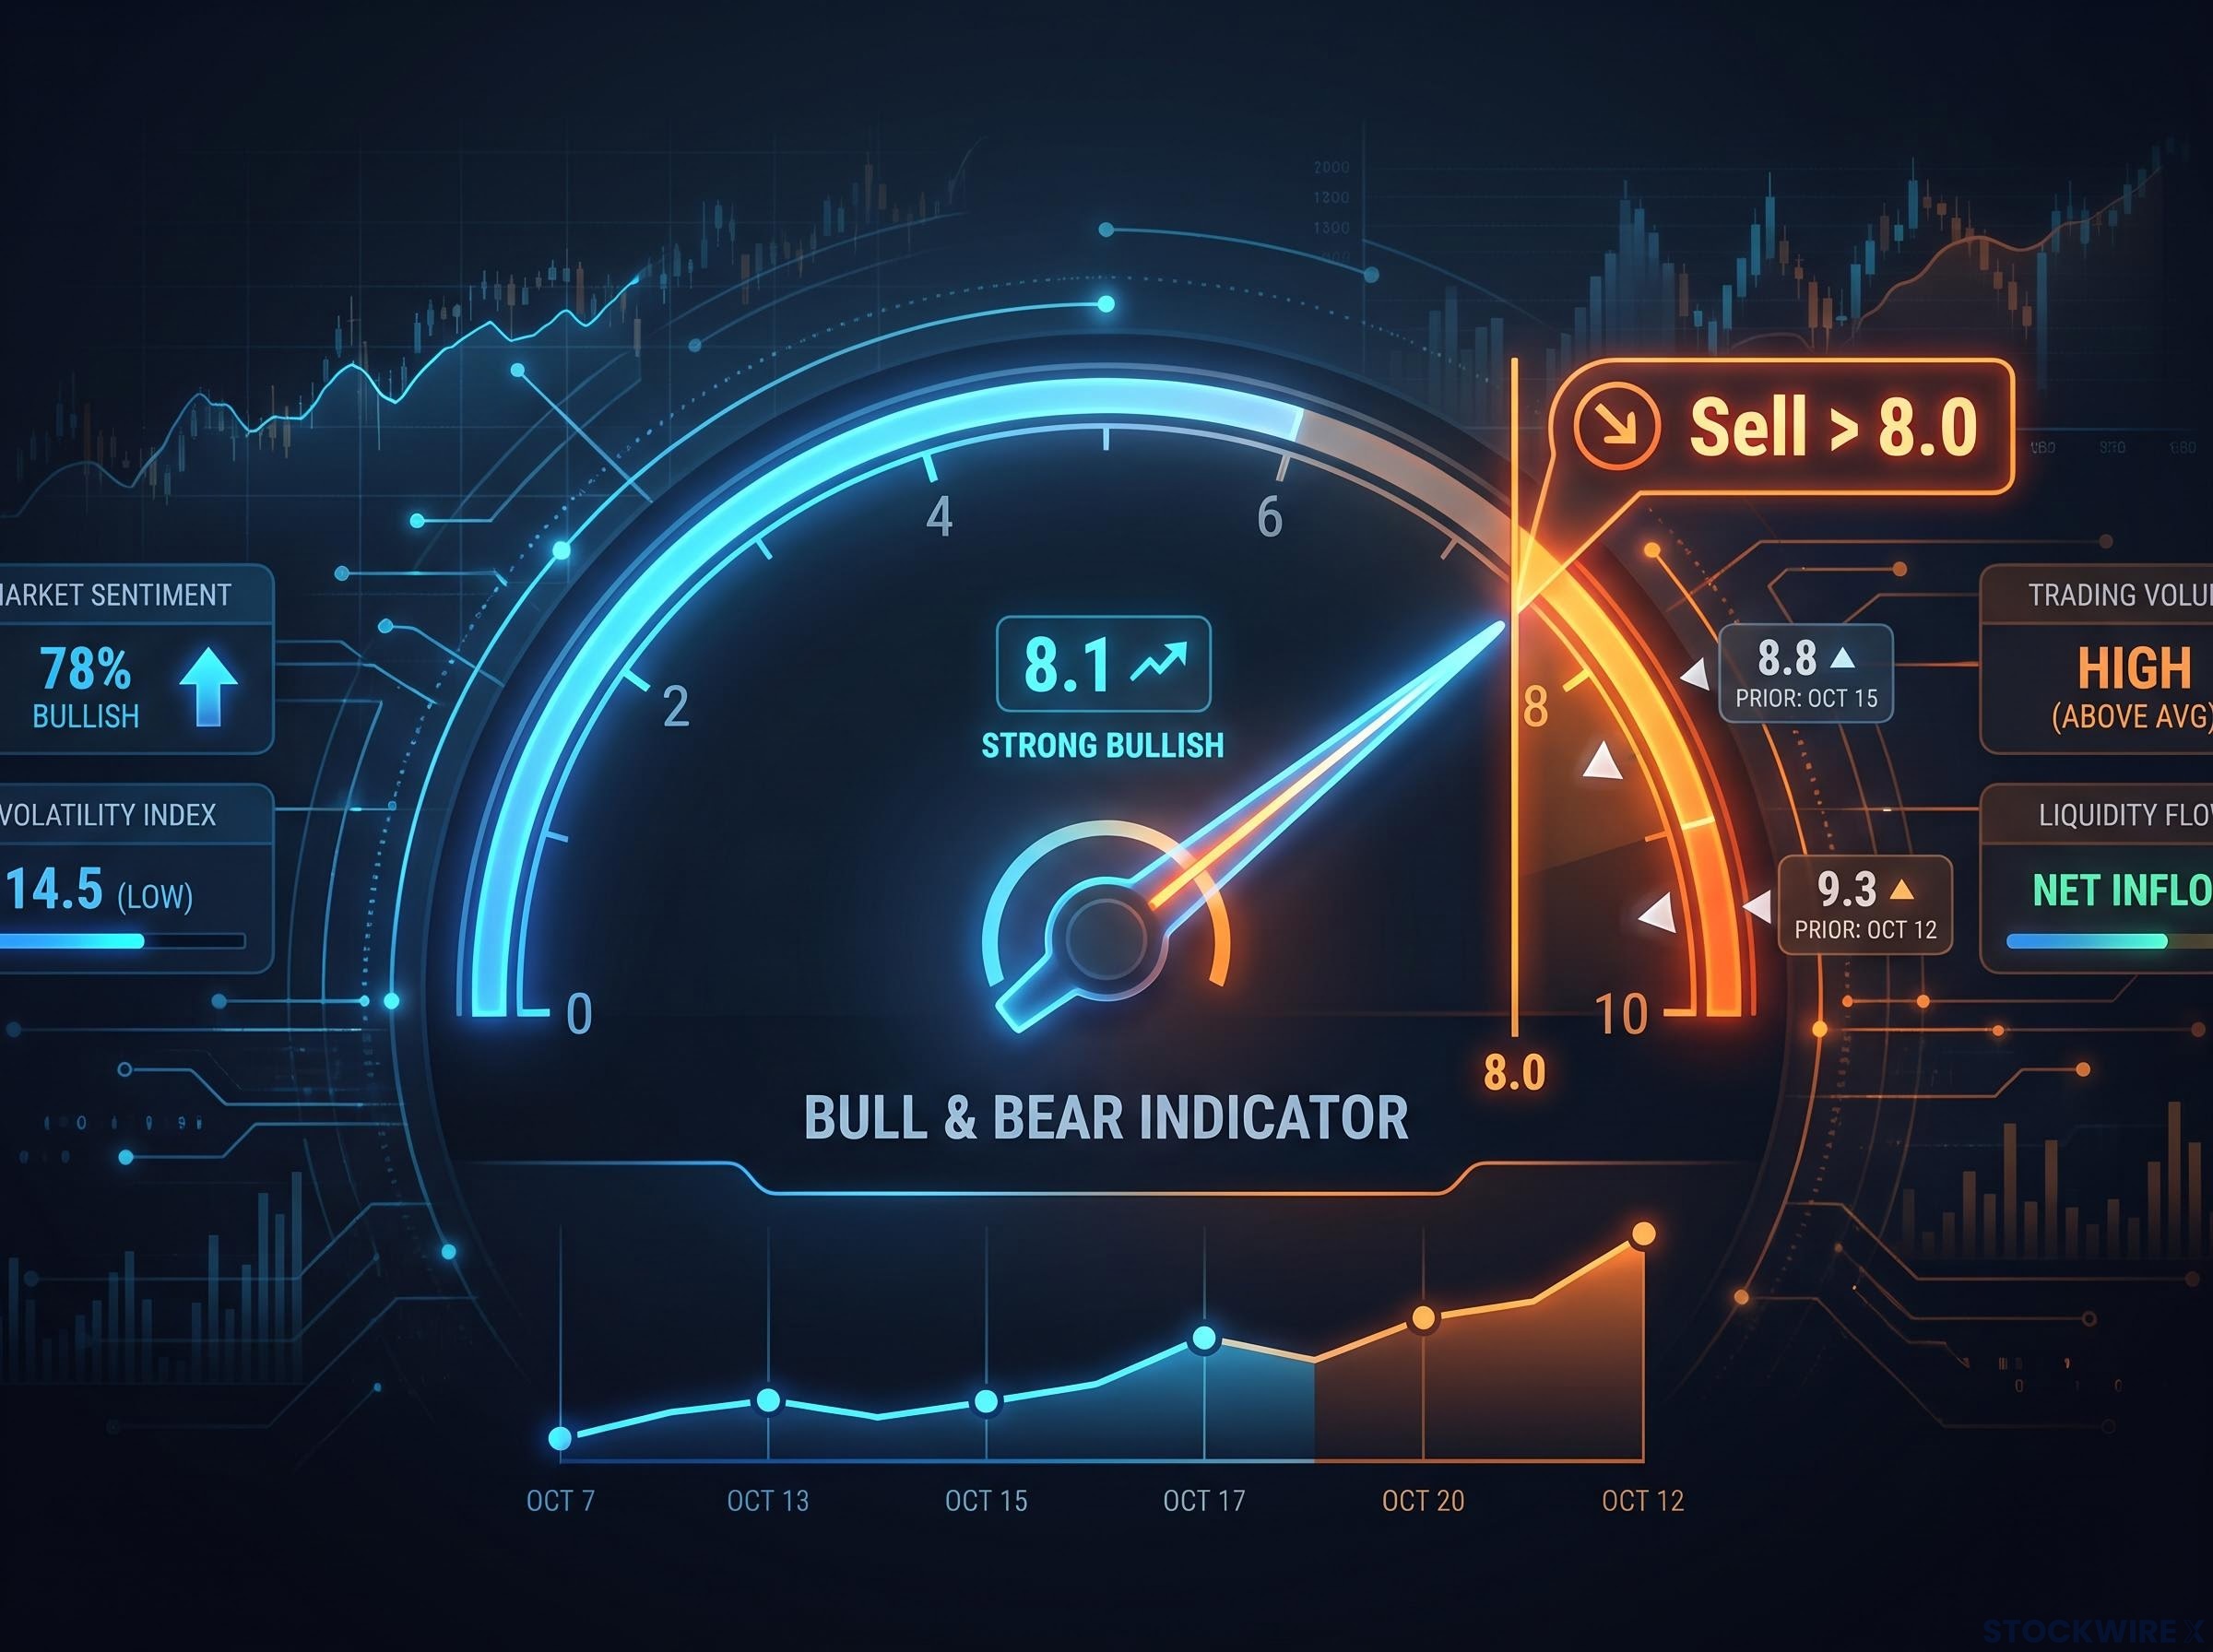
The composite typically includes flows into equities, bonds and cash; investor positioning from futures, options and surveys; credit spreads across high-yield, emerging market and bank debt; and volatility and safe-haven flows. A credit spread is the extra yield investors demand to hold riskier debt over government bonds, so wider spreads mean lenders are growing nervous.
The track record explains why markets pay attention. Max-bearish readings in the 2008-09 crisis and March 2020 came before strong multi-year rallies. High readings in early 2018 and late 2021 to early 2022 lined up with, or slightly preceded, sharp corrections in growth and tech stocks.
A contrarian sell signal of this kind has fired only 18 times since 2002, and past readings were followed by average global equity declines of 2-3% within three months.
The signal still has real weaknesses:
- Timing risk: stretched readings can last months before markets turn.
- Regime dependence: structural shifts such as inflation changes or major policy pivots can break the usual relationship.
- Flow distortions: passive funds, systematic strategies and large sovereign flows can muddy the link between sentiment and turning points.
- Credit lag: spreads sometimes widen only after equities have already fallen, cutting lead time.
Timing caveat Extremes can persist for months before a turn.
A sell reading tells you sentiment is stretched, not that a fall is imminent. Treat it as a prompt to check your risk rather than a date to act on.
Three credit canaries to watch
BofA flags three market signals that tend to crack before broader stress shows up:
- AUD/JPY: the Australian dollar tracks growth, commodities and China, while the yen is a funding currency. A falling rate signals fading risk appetite or funding strain.
- Risk parity funds: these use leverage across bonds and equities based on volatility and correlation assumptions. If yields spike and stocks and bonds start falling together, forced selling can follow.
- Tech credit default swaps (CDS): a CDS is insurance against a borrower defaulting. Widening tech CDS while tech shares stay buoyant would point to credit stress in a sector seen as cash-rich.
Why BofA sees the midterms as the likeliest trigger for a 10% move
Those canaries matter more because of the calendar. US midterms can shift the balance of power in Congress, affecting fiscal policy, regulation and oversight. They also resolve political uncertainty once results are in, and they offer a read on voter mood before the next presidential race.
BofA’s call Hartnett’s strategy team sees the midterms as the likeliest trigger for a 10% equity move into 2027, and the primary directional catalyst into year-end.
BofA leans risk-off ahead of the vote, effectively betting that any drawdown arrives before the election rather than after it.
History complicates that bet. S&P 500 data since the 1950s, as analysed by LPL Research and CFRA, points to two patterns:
| Pattern | Typical range | Source | Caveat |
|---|---|---|---|
| Intra-year drawdown in midterm years | Often about 15-20% | S&P 500 data since 1950s | Approximate; varies by cycle |
| Return from midterm-year low to 12 months after the vote | High teens to low 30% range | LPL Research, CFRA | Held across unified and split government |
LPL Research in 2018 and CFRA in 2022 argued that markets care more about the economic cycle and earnings than about which party wins, and that post-election gridlock can lower legislative risk. Three readings of the pattern compete:
- Macro-cycle view: the pattern reflects economic and earnings cycles, not the election itself.
- Policy-risk view: less legislative risk after the vote lowers the premium investors demand to hold stocks.
- Small-sample caveat: there are few midterm cycles, and some broke the pattern when wars, crises or inflation spikes took over.
No named strategist was found publicly disputing Hartnett’s call. Still, the record suggests a pre-election drawdown has often become a buying opportunity afterwards, so you should separate the near-term risk BofA flags from the longer-term return history.
The post-midterm rally has appeared in the 12 months after all 19 midterm elections since 1950, which suggests uncertainty resolution matters more than which party wins.
What BofA’s allocation calls assume, and how they could fail
The calls
BofA’s positioning follows from its risk-off lean. It avoids adding tech exposure because investors are already heavily long, though it still expects the Magnificent Seven to beat semiconductors into the midterms. It is nibbling at “peak yield” assets: 30-year Treasuries, small caps, REITs and Hong Kong property. It sees China tech as an interesting contrarian trade and stays long gold, commodities and emerging markets.
The backdrop is record money-market fund inflows. BofA argues cash and long-duration Treasuries beat equities until central banks stop hiking, while most investors say they are waiting for 6% yields before buying Treasuries, against roughly 5.7% today.
Where they could break
| Call | BofA’s logic | Main risk | Historical precedent |
|---|---|---|---|
| Avoid adding tech | Positioning already crowded | Momentum keeps running if AI earnings deliver | Growth led 2013-2021 despite crowding |
| Nibble at peak yield | Rates near cycle highs | Inflation or fiscal worries push yields higher | Early buyers lost in 2013-2014 and late 2022 |
| Long gold and commodities | Hedge against stress | Strong dollar, rising real yields, slower growth | Gold bear market after 2011; 2014-2015 slump |
| Long emerging markets | Diversification away from crowded US tech | US rate spikes and dollar strength | 2013 taper tantrum; 2018 Fed tightening |
Gold shows how quickly a hedge can wobble. It trades around $4,100-4,200, only modestly above a seven-week low near $4,110, as higher yields weigh on a metal that pays no income.
The broadest counterargument targets BofA’s credit focus. If corporate balance sheets are strong, debt maturities are manageable and household savings hold up, credit cracks may stay contained and equities could grind higher anyway. Every call here is a timing bet in a market where extremes persist, so treat these as scenarios to size carefully, not instructions to follow in full.
Investors weighing the 30-year yield pressure can read our detailed coverage of Treasury yield and volatility warning signs, which covers the equity risk premium at just 0.19%.
What the signal changes, and what it does not
The evidence supports caution. A sell reading, narrow breadth, rising long-term yields and ongoing rate hikes all point the same way. But the Bull & Bear Indicator measures sentiment, not timing, and midterm history shows drawdowns have often been followed by recoveries.
Three variables will tell you whether the warning is firming or fading:
- The indicator’s position relative to the 8.0 sell line.
- Breadth against the net 88% buy trigger.
- The credit canaries: AUD/JPY, risk parity fund stress and tech CDS.
If those deteriorate together, BofA’s case strengthens. If they hold, the more useful question becomes how concentrated your own exposure is, and whether you are prepared to add on weakness after the vote.
This article is for informational purposes only and should not be considered financial advice. Investors should conduct their own research and consult with financial professionals before making investment decisions. Past performance does not guarantee future results.