
$166.4 billion flowed into money market funds in a single week, the biggest weekly inflow since April 2020. A common market assumption treats every dollar of that cash as ammunition that will rush into shares the moment sentiment improves. The evidence suggests otherwise, and the gap between the assumption and the data matters for how you read the market.
According to the Investment Company Institute (ICI), US money market fund assets rose to $7.96355 trillion for the week ended 7 October 2026. That is up from roughly $5 trillion in 2023. All figures are in US dollars, and most of the data here is US-centred.
Michael Hartnett, chief investment strategist at Bank of America (BofA), argues this cash will stay put until the US Federal Reserve (the Fed, America’s central bank) delivers a sustained run of rate cuts.
Here is why this pile of cash is stickier than the headlines suggest, and which signals would actually move it.
What the latest weekly flows actually show
Start with the headline. BofA strategists, citing fund-tracking data from EPFR, reported the $166.4 billion cash inflow for the week to 7 October 2026. That surge reversed an outflow from the week before.
The more telling detail is what happened elsewhere at the same time.
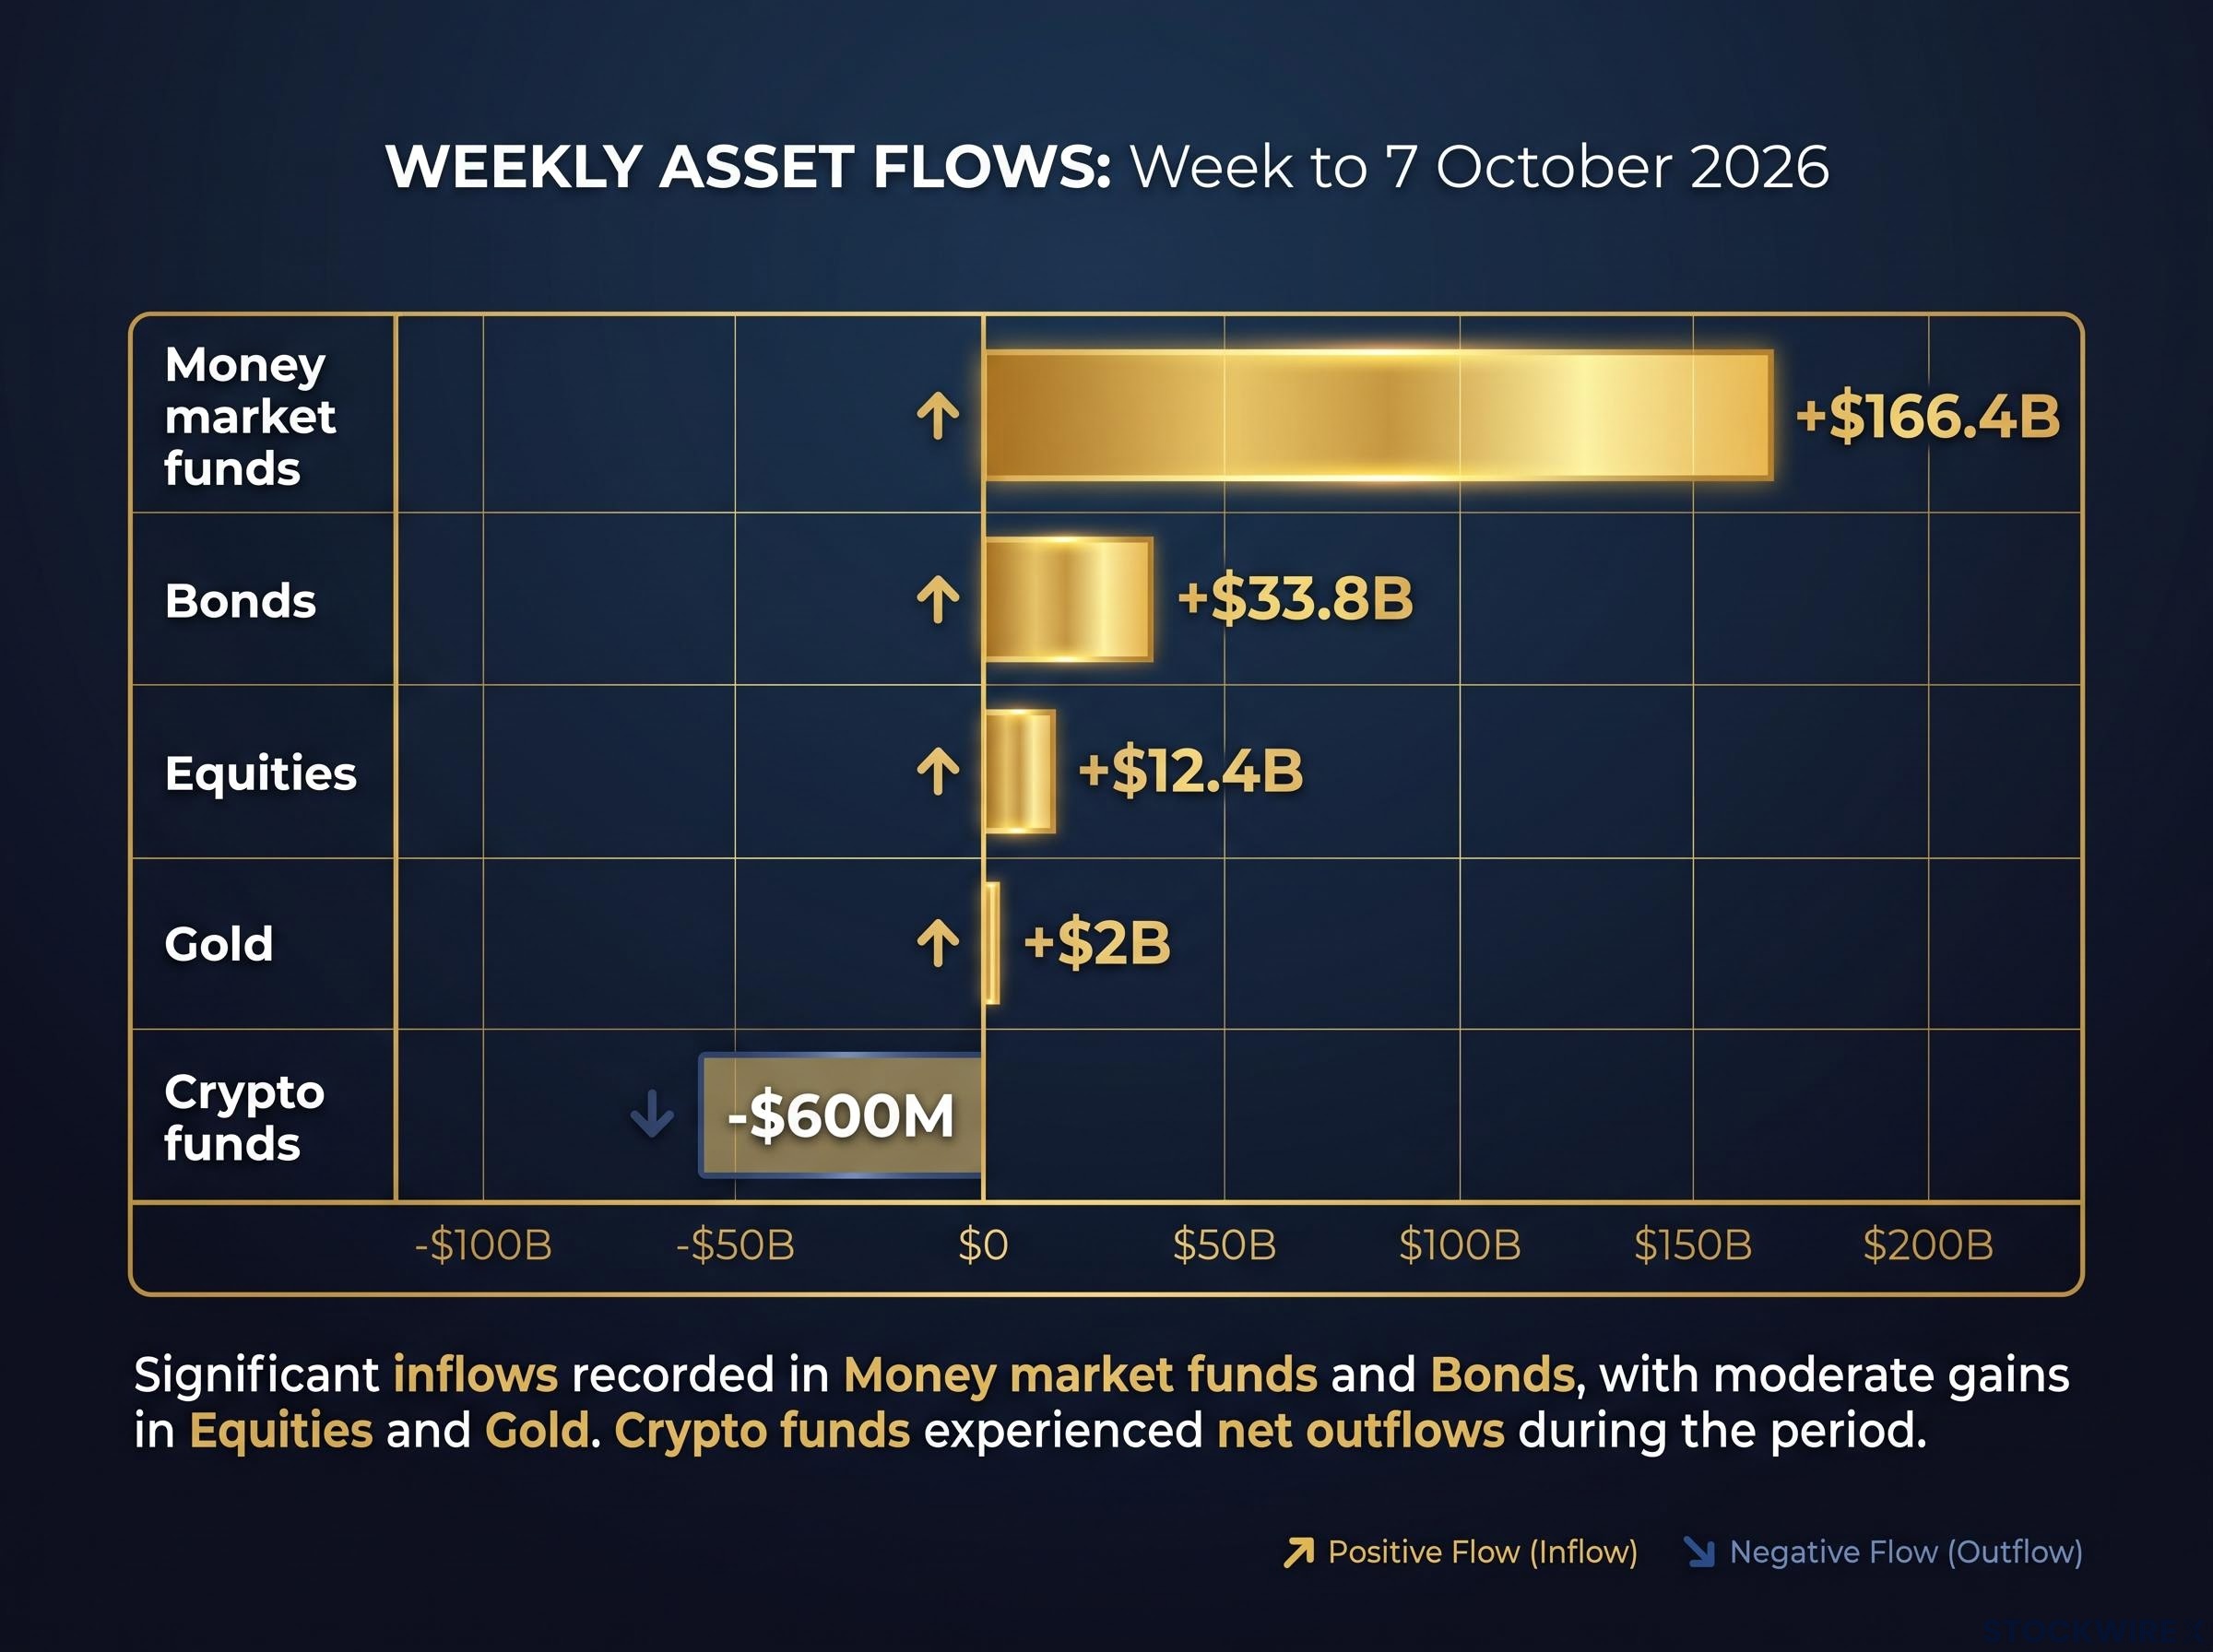
| Category | Weekly flow | Note |
|---|---|---|
| Money market funds | +$166.4B | Largest since April 2020; reversed prior week’s outflow |
| Bonds | +$33.8B | Defensive demand alongside cash |
| Equities | +$12.4B | Modest, with mixed detail underneath |
| Gold | +$2B | Safe-haven inflow |
| Crypto funds | -$600M | Outflows |
Cash, bonds and gold all drew money in the same week, while crypto lost it. Those are the moves of investors buying protection, not reaching for risk.
One technical point: the ICI figure measures total US money market assets, which rose $72.27 billion that week. The EPFR data tracks global fund flows, and the source commentary keeps the two separate, so you should too.
Where the equity money went
The $12.4 billion equity inflow looks constructive until you break it down.
- Tech funds: +$3.5B, the largest inflow in six weeks
- Financials: -$3B, the largest outflow since March
- US equities: +$3.3B, the first inflow in three weeks
- Emerging-market equities: +$2.1B, a second straight week of inflows
- Europe: +$200M, also a second straight week
- Japan: -$3.3B, the biggest outflow since May
Money moved between regions and sectors rather than piling into stocks as a whole. For you, the takeaway is simple: one big cash week is a reading of caution, not a stockpile about to be spent.
Money moving between regions and sectors is the essence of sector rotation, where institutional capital repositions ahead of economic shifts and leadership changes often precede official data.
When big ASX news breaks, our subscribers know first
Why the cash stays parked: the $330 billion incentive and the structural base
If that caution feels irrational, consider what the cash is earning. Before going further, a quick definition: a money market fund is a pooled fund that holds short-term, high-quality debt, such as US Treasury bills (T-bills, which are government IOUs maturing within a year).
With T-bill yields around 4.2%, these funds pay a meaningful return for very little day-to-day price movement.
The $330 billion pay cheque BofA estimates money market funds earn roughly $330 billion a year in interest. That figure comes from applying yields near 4.2% to roughly $8 trillion in assets, so it is an approximation tied to today’s balances and rates.

The cyclical pull
- Yield versus risk: around 4.2% with low volatility looks attractive when growth, earnings and geopolitics feel uncertain.
- Rate-path risk: investors hesitate to lock money into longer-dated bonds or shares before the Fed clearly changes direction.
That second point is why Hartnett stresses “sustained” cuts. One or two cuts barely dent the yield on cash, so they give you little reason to move.
The Fed rate path is itself uncertain, with major banks forecasting terminal rates anywhere from 3.00% to 3.50%, which is one reason a sustained cutting cycle is hard to pencil in.
The structural base
Now widen the lens, because a large share of this money was never waiting to rotate.
- Institutional mandates: corporate treasurers, pension funds and insurers use money funds under internal policies and regulations that limit how far they can shift.
- Brokerage sweep accounts: these automatically park uninvested cash in money funds, so much retail money is operational plumbing rather than a market bet.
- Post-crisis regulation: liquidity rules and money fund reforms pushed some institutions towards government money funds instead of bank deposits.
Broader research points the same way. Morningstar has cautioned that much of the balance reflects emergency savings, corporate liquidity and short-term parking, while ICI emphasises the role of these funds in institutional cash management.
For you as an investor, the headline $8 trillion overstates what could realistically flow into shares. A meaningful slice is working cash that stays regardless of sentiment.
What is a money market fund, and why “cash on the sidelines” is a misleading phrase
If you are newer to this, it helps to see what these funds actually hold. A money market fund invests in short-term debt designed to keep its value stable and let you withdraw quickly.
Typical holdings include:
- US Treasury bills and other short-term government debt
- Repurchase agreements, which are very short-term loans secured by government bonds
- High-quality short-term corporate debt, mainly in non-government funds
That is why people treat these funds as cash-like. They are not the same as a bank deposit, though, because you own units in an investment fund rather than holding a deposit with a bank.
The SEC money market fund reforms adopted in 2023 raised minimum daily and weekly liquid asset requirements and removed redemption gates, which is why you can treat these funds as cash-like for liquidity purposes.
According to ICI, government and institutional funds make up the majority of assets, and institutional funds rose strongly in the latest week. That mix tells you much of the money belongs to organisations managing their day-to-day liquidity.
Now to the phrase you hear constantly.
The myth: Trillions in cash are waiting on the sidelines to pour into the market. The correction: When you buy a share with cash, the seller receives that cash. The money changes hands; it does not disappear from the system.
Because every purchase simply hands cash to someone else, aggregate cash cannot charge into the market all at once. Large balances reflect what people prefer to hold and how much liquidity they need, not a coiled spring of buying power.
So a rising cash figure is not a forecast of a rally. It describes how many people want to hold safe assets today.
Do easing cycles really empty the cash pile?
If cash only moves when preferences change, the obvious question is whether Fed rate cuts change them. History gives a mixed answer.
- Early 2000s: after sharp cuts following the tech bust, some cash rotated into shares, but money fund assets stayed substantial because of high liquidity buffers.
- 2007-2009: aggressive easing eventually drew investors into shares and credit. Yet money fund balances surged at stress points and normalised only gradually, never returning to pre-crisis lows.
- 2019-2020: flows showed both safe-haven demand and bursts of rotation when policy support was clear. The pandemic proved these funds act as emergency liquidity, not just a waiting room for equities.
- 2024 to now: investors have kept sizable cash and ultra-short allocations even as cuts were anticipated or delivered.
The pattern is consistent. Risk assets rallied in easing cycles, but money fund balances did not simply collapse; rotation came partially, in stages, and on conditions.
Broader research from Goldman Sachs and JPMorgan suggests rotation also depends on better growth visibility and narrower credit spreads (the extra yield riskier borrowers pay over governments), not rate cuts alone. Vanguard and other managers describe money funds as permanent “liquidity sleeves” within long-term portfolios.
What would change the picture
Against that record, Hartnett’s view reads as grounded in precedent. His team frames the cash as “parked” and expects only modest inflows to shares and other risk assets until three things line up:
- Several Fed rate cuts, forming a sustained cycle rather than a one-off
- A peak in the US dollar
- Clearer macroeconomic visibility
Even then, caveats apply. Weak economic data, earnings disappointments or stretched valuations could keep cash high after cuts begin.
Not everyone treats large balances as harmless, and UBS cash allocation data showing investors holding about 22% of assets in cash argues that chronic underallocation to growth assets is the bigger long-term risk.
There is also an income trade-off. Multiple cuts would shrink that roughly $330 billion annual interest stream, leaving income-focused savers to choose between lower yields and more risk at possibly less attractive prices.
What this means for you is that a first Fed cut is unlikely to spark a buying wave. Watching for a sustained cycle, a dollar peak and improving visibility is a better guide than reacting to any single rate decision.
Past performance does not guarantee future results. Forward-looking views cited here are speculative and subject to change based on market developments.
What this record inflow does and does not tell you about the next move
The $166.4 billion surge reflects caution, a roughly 4.2% yield worth holding and a large structural base of operational cash. It does not describe a stockpile about to flood into markets.
The signals that would shift that reading are specific: a sustained Fed cutting cycle, a peak in the US dollar and clearer economic visibility. History suggests that when rotation does come, it arrives in stages.
Your decision point is how you use the data. Treat cash balances as context rather than a trading signal, and weigh the income your cash earns today against the cost of waiting.
Whether waiting for cuts makes sense for you depends heavily on your portfolio stage, because a young accumulator and a near-retiree face very different costs from sitting in cash.
This article is for informational purposes only and should not be considered financial advice. Investors should conduct their own research and consult with financial professionals before making investment decisions.