The Dow Jones Industrial Average finished slightly higher and small caps slipped less than 0.2%. Underneath that calm, the PHLX Semiconductor Index (SOX) fell about 4% and Nasdaq futures dropped roughly 500 points. That gap is easy to miss. Index-level calm can hide real damage in the group that carries the market.
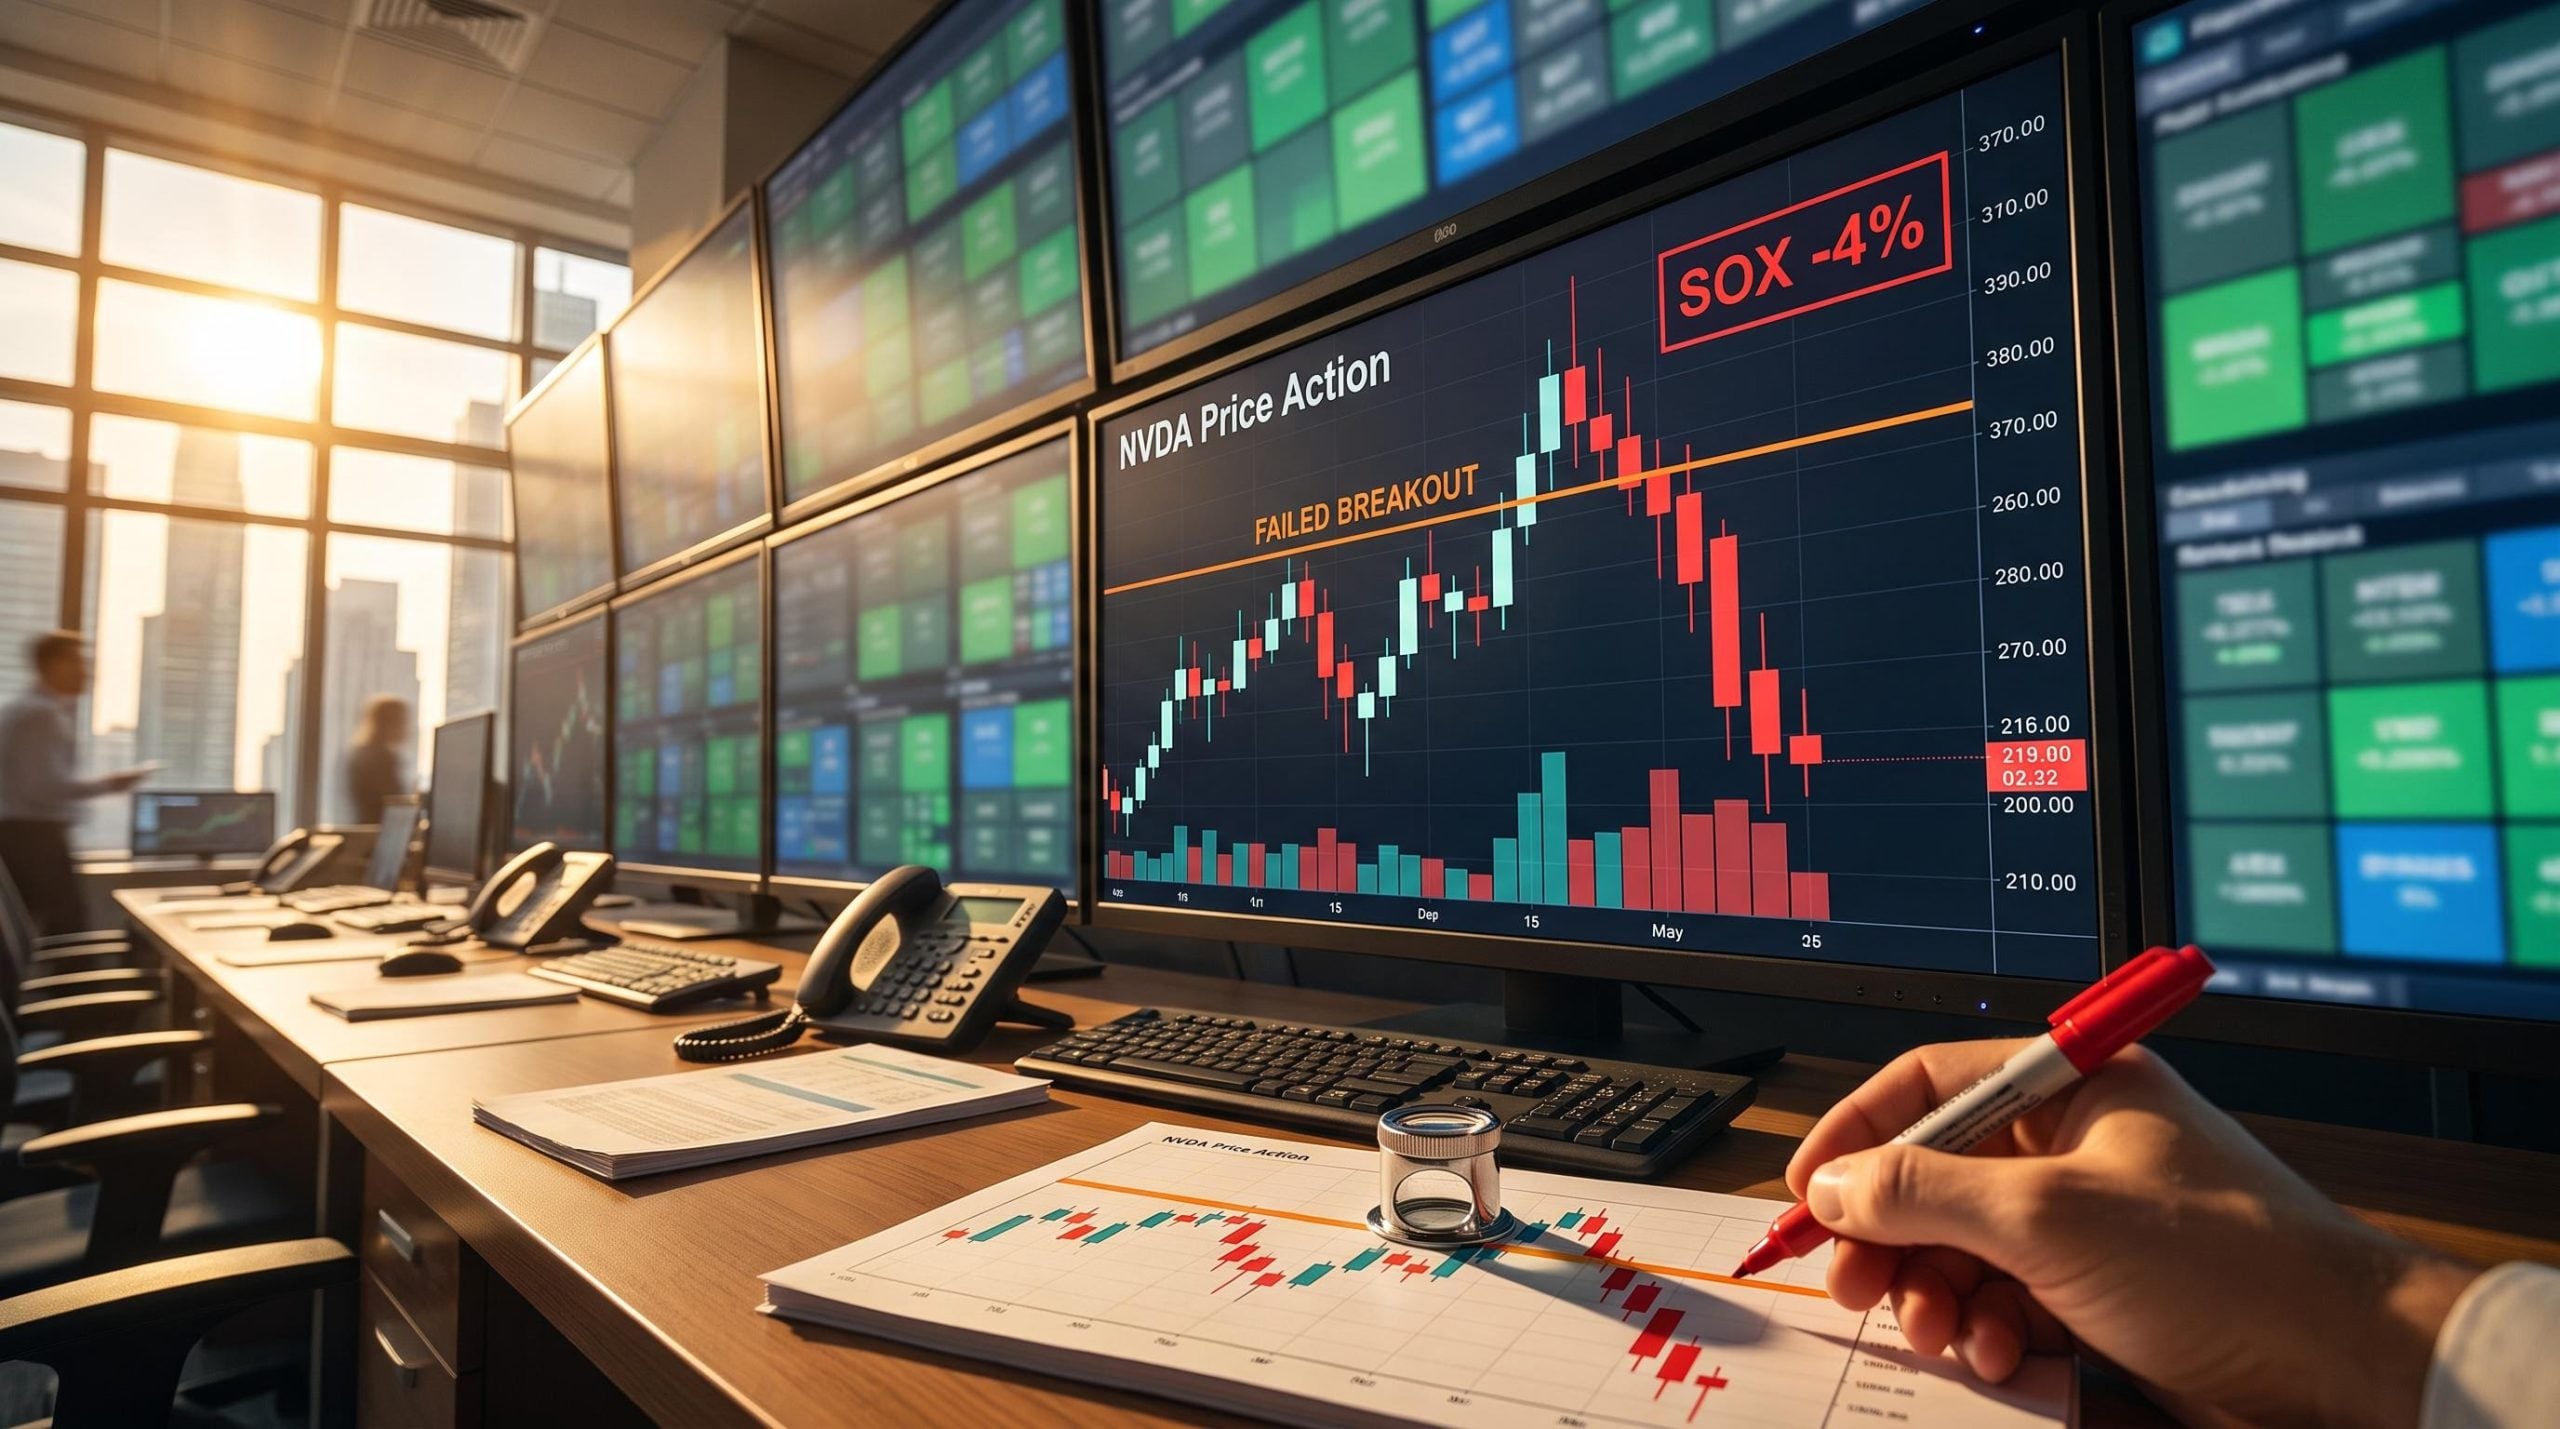
The damage showed up on the charts. SPY, QQQ, XLK and Nvidia all posted failed breakouts in the same session. Veteran short seller Tim Knight called it one of his best days of the year.
One session is evidence, not proof. This analysis was written on 8 October 2026, while the move is still fresh and unconfirmed.
Here is how to tell a genuine failed breakout from noise, why the market’s reliance on artificial intelligence (AI) makes it so jumpy, and what one great day for a bearish book does and does not prove.
What did the semiconductor-led reversal actually look like?
At the headline level, the scoreboard looked mild. The Dow edged up, likely because money rotated out of tech, and IWM was only slightly weak despite a bond rally. EFA, the developed-markets ETF, fell only fractionally.
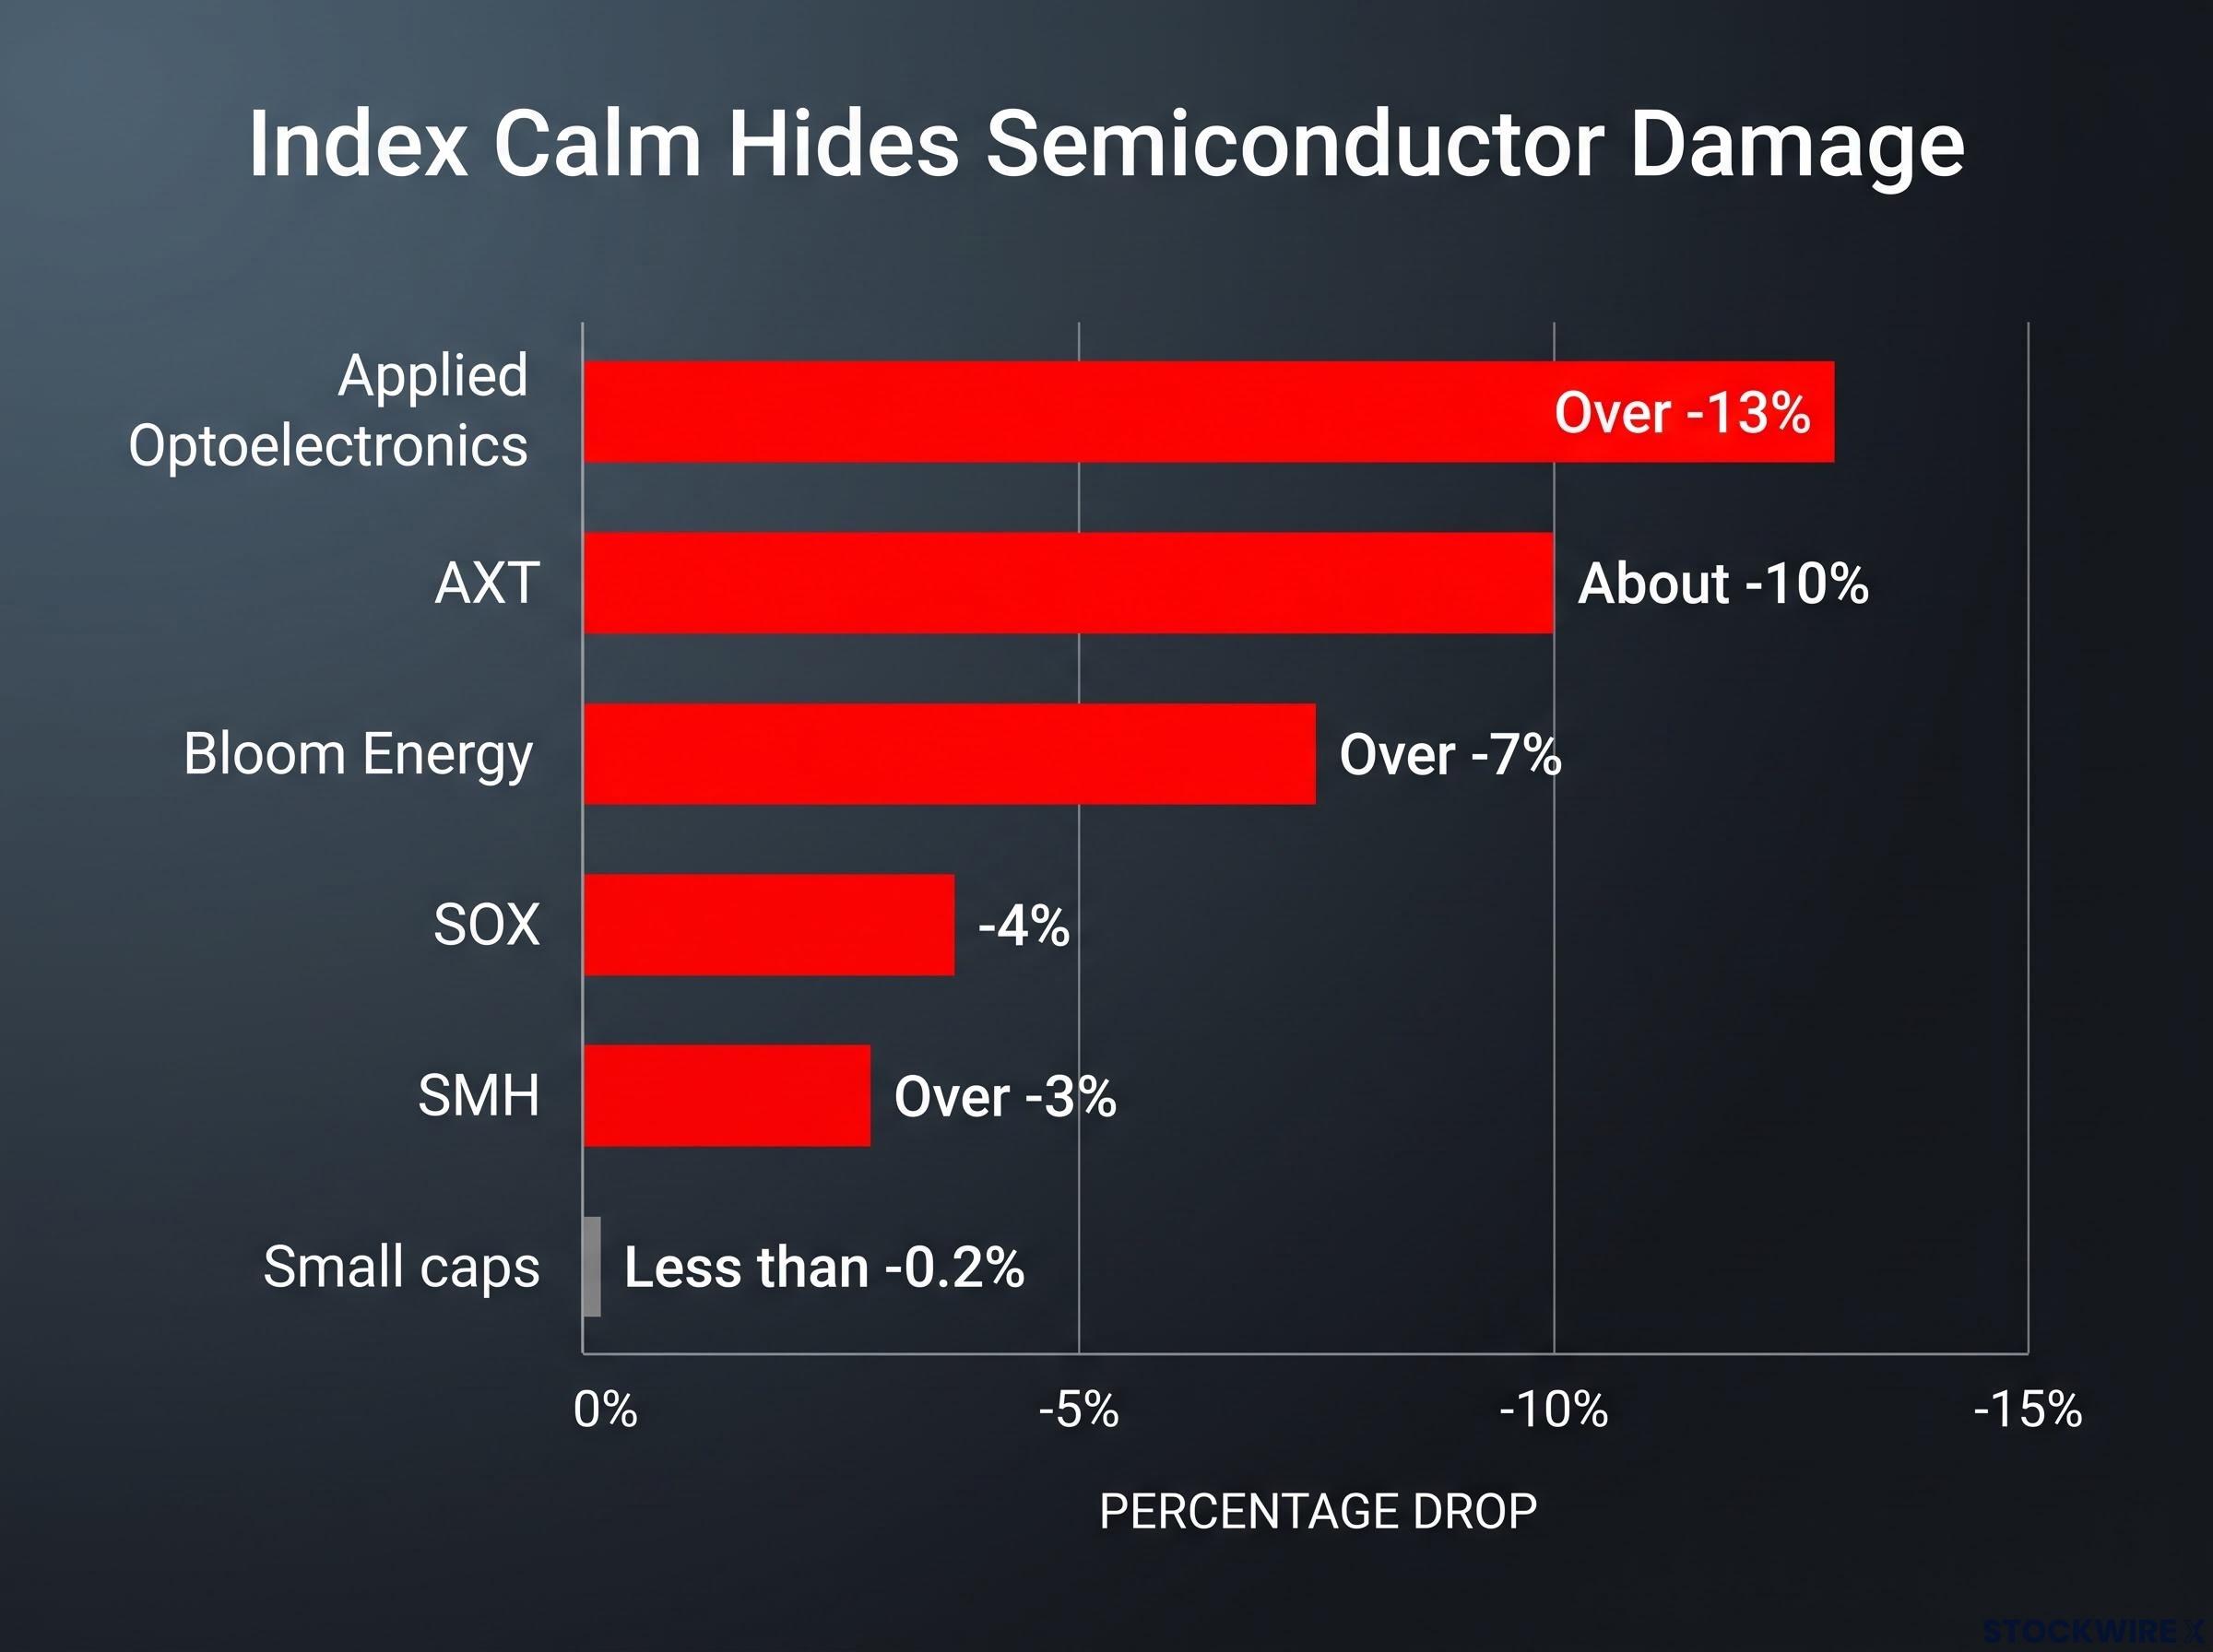
The losses were concentrated elsewhere. The SOX lost about 4%, SMH over 3%, Nvidia about 3% and emerging markets over 2%. The selling clustered in chips, memory and names tied to hyperscalers, the giant cloud operators building AI data centres.
The single-stock losses were steeper still.
| Instrument or stock | Approximate move | Category |
|---|---|---|
| SOX | -4% | Index/ETF |
| SMH | Over -3% | Index/ETF |
| Applied Optoelectronics | Over -13% | AI-linked |
| AXT | About -10% | Semiconductor |
| Bloom Energy | Over -7% | AI-linked |
| Micron | Almost -5% | Semiconductor |
| Applied Materials | About -2.67% | Semiconductor |
| IonQ, Oklo, D-Wave | About -4% to -5% | Quantum |
Premarket reports on 7 October pointed the same way. Intel was reportedly down about 7%, AMD about 6% and the iShares Semiconductor ETF about 6%, though those exact figures were not independently confirmed. Coverage blamed “AI slowdown fears” after chief executive commentary hinted at cooling demand. Complete same-day closing figures for the S&P 500 and Nasdaq were not available.
A calm S&P 500 tells you rotation can mask concentrated selling. If your portfolio leans on tech, the semiconductor and AI-linked names matter more than the headline index.
How this compares with earlier 2026 selloffs
This has happened before. On 7 July, the SOX fell roughly 4.65-5.7% while the S&P 500 closed at 7,503.85 and the Nasdaq Composite at 25,818.69. By mid-July, according to The Globe and Mail, the SOX had logged its steepest weekly loss in over a year and fell more than 18% for the month. The pattern is now a repeating one, not a one-off.
When big ASX news breaks, our subscribers know first
How do you read failed breakouts, island reversals and trendline breaks?
The charts from this session work as a teaching set. Each pattern appeared on a real ticker.
Failed breakouts
A failed breakout happens when price pushes above resistance, a level where selling has previously capped gains, and then falls back into its prior range. SPY and the S&P 500 futures contract (ES) pushed higher on Tuesday with no follow-through, and those gains were erased. Nasdaq futures (ENQ) lagged by a day, then failed too.
Nvidia matters most. Knight treats it as the linchpin of AI infrastructure, so its failed bullish breakout carries extra weight. Thomas Bulkowski’s pattern research is a reminder that these “bull traps” are common, which is why technicians lean on confirmation.
Island reversals
An island reversal is a cluster of price bars separated from the rest of the chart by gaps on both sides, often read as a sign that a move has exhausted itself. Knight had flagged them earlier on XLK and QQQ, and XLK has now given back several days of gains. The caveat: these signals throw off false readings at a meaningful rate in strong bull markets, where dip-buyers step in fast.
Island reversals on SPY, ES, XLK and QQQ followed a record S&P 500 close, and the Russell 2000 slide beneath that headline high shows how the pattern can expose weak breadth before the large-cap index reacts.
Trendline breaks
Emerging markets broke their uptrend, Viasat fell roughly 6% below its symmetrical triangle (a narrowing price pattern), and the SOX was rejected at the midline Knight had highlighted. Knight uses regular-hours daily bars, though critics argue that including after-hours data would remove the gaps.
The presenter’s own caveat Knight notes that emerging markets need a follow-through down day to confirm the break, and that a similar break before turned into a buying opportunity.
A practical confirmation checklist:
- The breakout fails and price returns to its prior range.
- A follow-through down day arrives.
- Breadth, the number of stocks rising versus falling, deteriorates.
- Volume expands on the decline.
A failed breakout tells you buyers lost a test, not that the trend is over. Wait for follow-through or weakening breadth before treating one day as a turning point.
Why does the AI narrative make the market so fragile?
The fragility starts with concentration. Nvidia, AMD, the major cloud platforms and leading chipmakers have contributed outsized shares of S&P 500 and Nasdaq gains. When they wobble, the indexes wobble with them.
Record market concentration explains the sensitivity: five mega-cap companies hold roughly 30% of U.S. equity value, so a wobble in a few AI names reaches passive index holders by default, whatever their holdings count suggests.
The more uncomfortable point is that news about private companies now moves public stocks. Anthropic’s run rate, its current revenue pace annualised, reportedly climbed from about $9 billion at the end of 2025 to about $30 billion by late March or early April 2026.
Then OpenAI pushed back.
The gross-versus-net dispute In an internal memo, OpenAI chief revenue officer Denise Dresser argued that Anthropic’s figure was overstated by roughly $8 billion because it counted gross sales made through AWS and Google Cloud. Netting out those partners’ share, she put the comparable number near $22 billion.
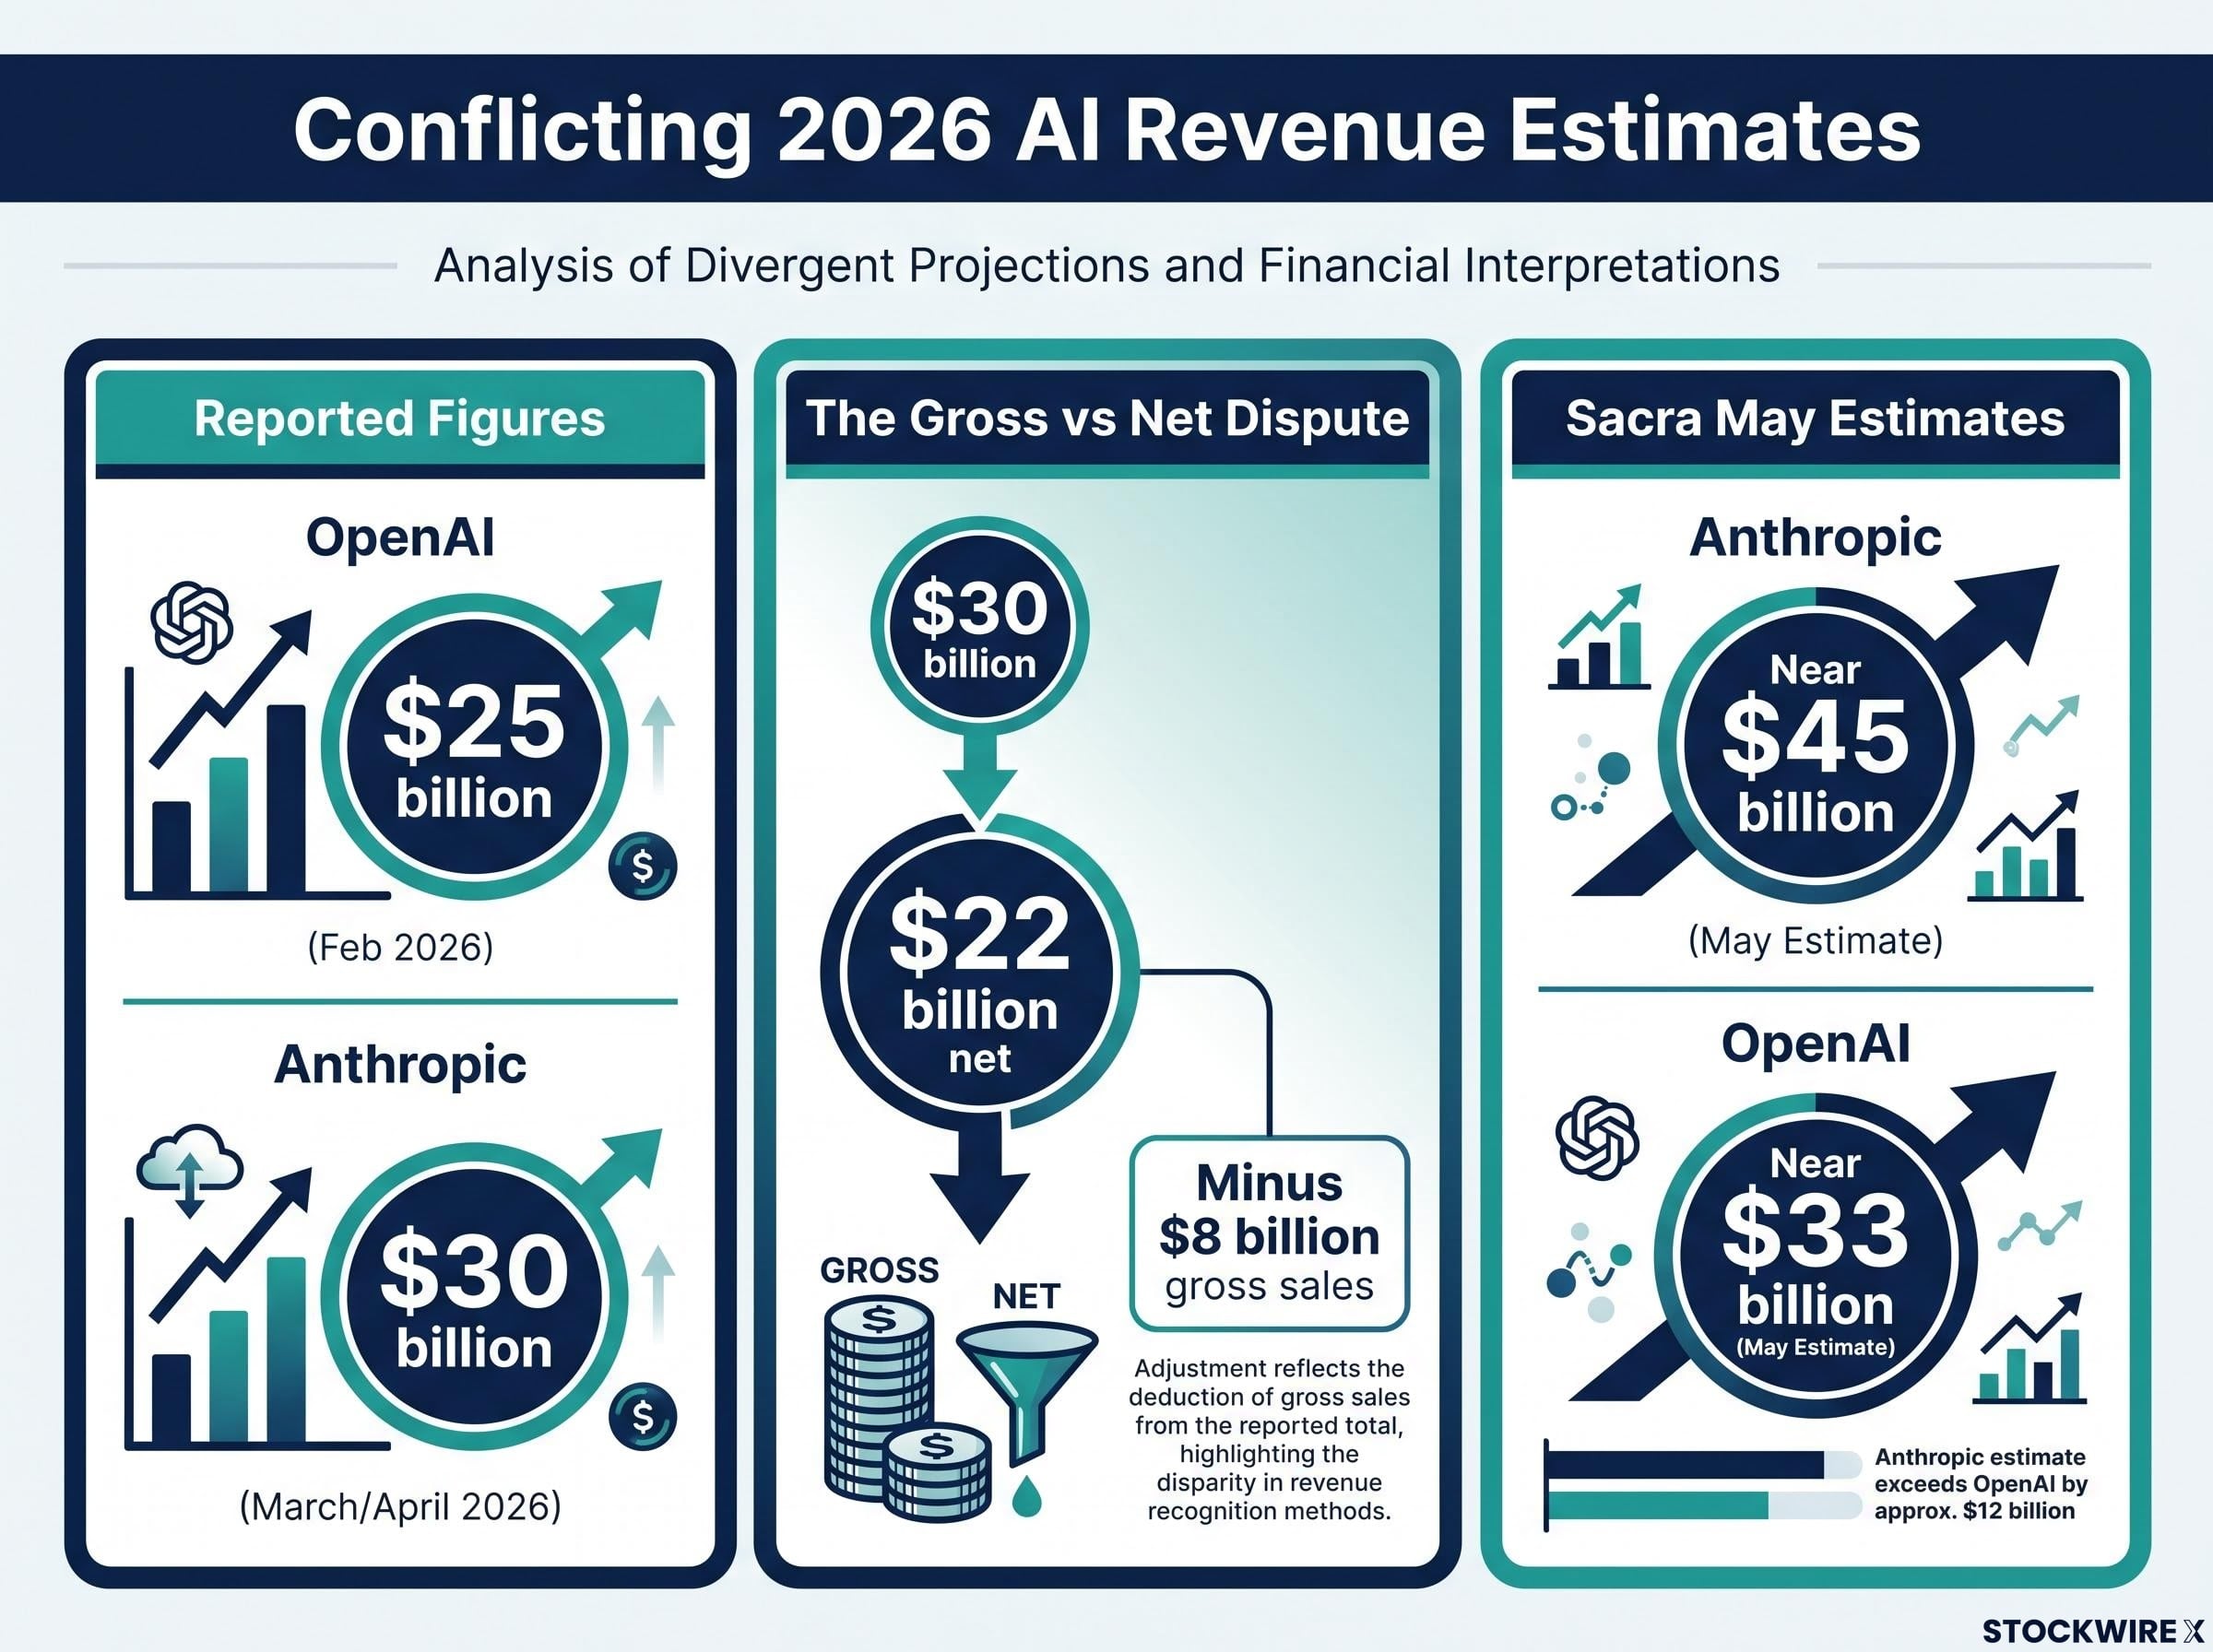
For scale, OpenAI reported about $25 billion in annualised revenue by February 2026. Sacra estimated in May that Anthropic was near $45 billion and OpenAI near $33 billion. Knight attributes a different critique to Ed Zitron, that a single strong day was multiplied by 365, but the verified dispute in the research centres on accounting method rather than demand. Knight’s broader view that AI firms are poor businesses is his opinion.
| Bull argument | Bear argument |
|---|---|
| PC, internet and mobile cycles left lasting earnings power despite overinvestment | Debt-funded capex risks multiple compression if returns disappoint |
| Even grossed-up figures reflect large, real demand | Run-rate inflation suggests not all demand is durable |
| Semiconductor drawdowns of roughly 20-40% in 2018 and 2022 recovered | The 2000 tech bubble showed a cracked narrative can mean a deep, prolonged reversal |
If you own index funds weighted toward a handful of AI beneficiaries, you carry more exposure to one narrative than your holdings count suggests. Even an accounting headline can move your returns.
What does a short seller’s best day, and the cross-asset tape, really tell you?
What the short book shows
Knight’s book delivered. About 28 of his roughly 30 positions fell, which he called one of his best days of the year despite a modest market decline.
His positioning explains it: a short in MSTR with a tight stop, a sizable utilities short through XLU, and shorts in Tesla and SpaceX-linked names, with no Nvidia position. Tesla slipped about 1.25%, MSTR about 1.13%, and SpaceX-linked exposure drifted toward major support near 150. None of his Tesla or SpaceX stops triggered.
The risks still stand. Short squeezes can erupt when sentiment flips, and stretched valuations persisted for years in late-1990s tech and 2020-21 growth stocks. Big one-day moves also tend to arrive in volatility clusters rather than as clean trend breaks.
What the other asset classes are saying
Major outlets did not tie these moves to the chip selloff, so treat them as Knight’s observations:
- Bonds: rallied, yet XLU still fell.
- Gold: up about $12, with GLD up about 0.67% and GDX about 1.2%.
- Silver: down, but still above a descending trendline.
- Crude: Knight guesses, without conviction, that it tops mid-September highs within six weeks.
- Bitcoin: fell from nearly $87,000 to under $82,000 over four trading days.
Strong breadth can also coexist with sector stress, although specific breadth figures cited in the research were unverified. One great day shows how bearish positioning behaves when leadership cracks. Treat it as an illustration of risk-managed positioning, not a signal to copy.
What one down day changes, and what it does not
Failed breakouts across SPY, QQQ, XLK and Nvidia, plus a 4% SOX drop, are a real warning. They are not yet a regime change, because confirmation and breadth have not arrived.
Three variables decide the next chapter: whether emerging markets get their follow-through down day, whether Nvidia reclaims its breakout level, and whether fresh headlines emerge on private AI-firm revenue.
For your own portfolio, the useful question is how much of your return depends on one AI narrative, and what risk controls you would rely on if that narrative cracked.
Using beta-weighted position sizing, you can see that a 50/50 dollar split between a high-beta tech ETF and a utilities ETF can carry a 90/10 risk split, which is exactly the hidden exposure a chip selloff reveals.
This article is for informational purposes only and should not be considered financial advice. Investors should conduct their own research and consult with financial professionals before making investment decisions. Past performance does not guarantee future results, and forward-looking views cited here are speculative and subject to change.