
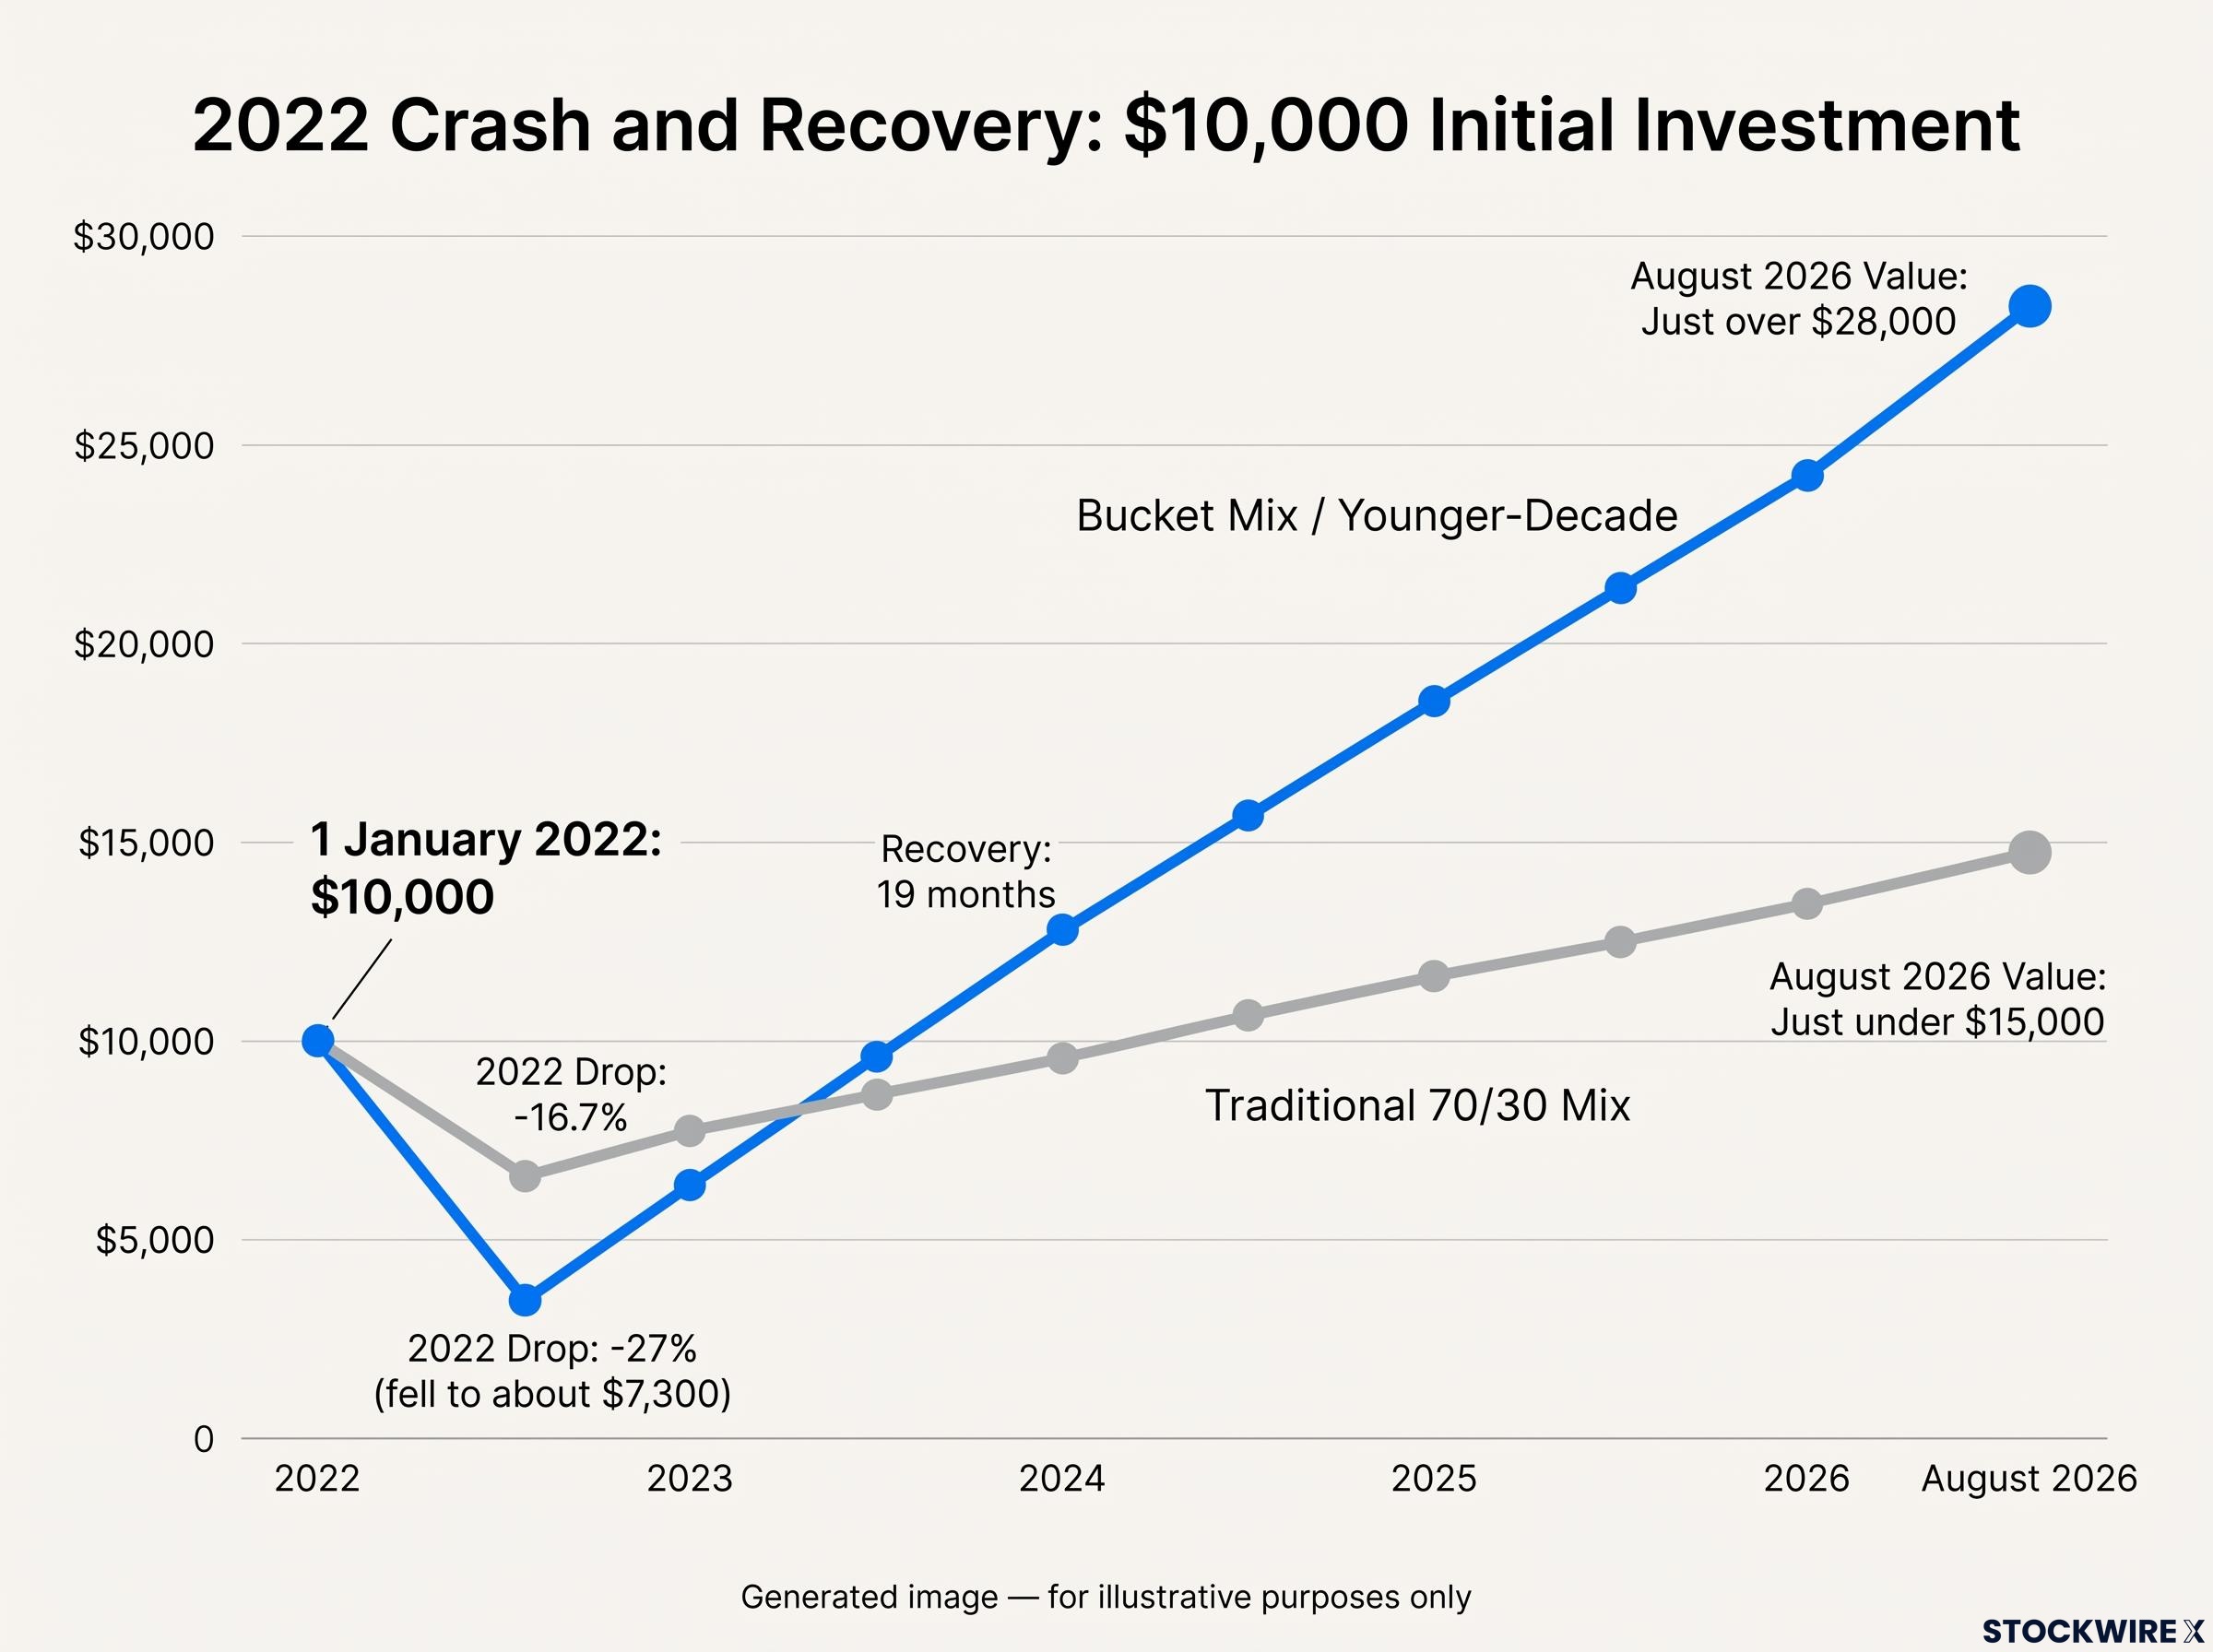
Most retirement advice treats a 60/40 split, or “100 minus your age” in stocks, as the safe default. One early retiree’s backtests suggest otherwise: his heavy-equity mix for investors in their 20s and 30s averaged 23.9% a year since 2012, against 11.3% for a traditional 70/30 portfolio. The cost showed up in 2022, when his mix fell 27% while the traditional blend dropped 16.7%.
That trade-off matters because 58% of working Americans feel behind on retirement savings, according to a 2025 Bankrate survey. Any framework that promises faster growth will attract attention from people trying to catch up.
The timing adds another layer. The 10-year Treasury yield stood at 5.27% on 6 October 2026, which revives a question many investors had stopped asking: do bonds deserve more room in a portfolio again?
This piece explains how the four-bucket ETF portfolio works, what its backtests do and do not prove, and where bonds still earn their place. It is educational analysis, not personalised advice.
What is a four-bucket ETF portfolio and how does it shift by decade?
The structure is simple. Money goes into four buckets: growth, market index, dividends and bonds, with an exchange-traded fund (ETF) filling each one. An ETF is a fund that trades on an exchange like a share and holds a basket of investments.
The retiree behind the framework, who says he is not a financial adviser, uses the VanEck Semiconductor ETF (SMH) for growth, VOO or VTI for the market index and the Schwab U.S. Dividend Equity ETF (SCHD) for dividends. Through most decades the bond bucket stays empty. That runs directly against the age-based rule, under which bonds rise steadily as you get older.
| Bucket | Example ETF | Role | Trend with age |
|---|---|---|---|
| Growth | SMH | Semiconductor upside | Falls from 60% to 40% (40s) and 30% (50s) |
| Market index | VOO or VTI | Broad U.S. anchor | Stays at 40% or more |
| Dividends | SCHD | Defensive income | Rises |
| Bonds | None in most decades | Stability | Exception suggested in the 60s |
The retiree describes the allocation as a dial rather than a set of fixed steps, so you would use the decade closest to your age.
How the buckets overlap
The labels suggest four sources of diversification. The holdings tell a different story. The 20s and 30s mix is about 60% chips, and Nvidia makes up about 19-23% of SMH, against roughly 9-10% of SOXX, which caps single-company weights.
The listed alternatives, SOXX, VGT and QQQM, share many of the same names. Holdings and return figures for SMH rest on the original source alone. Whatever the four labels imply, your real exposure under this design is concentrated in one sector.
Because SMH, SOXX and their rivals differ sharply on single-stock caps, fees and weighting, a careful semiconductor ETF comparison shows that the choice of chip fund changes how concentrated your growth bucket really is.
When big ASX news breaks, our subscribers know first
How did it perform against 60/40, and what did 2022 reveal?
The headline numbers are striking. According to the retiree’s backtests, the bucket mix beat traditional allocations by more than 10 percentage points a year in every decade tested since 2012.
| Decade | Bucket mix (avg annual since 2012) | Traditional mix (avg annual since 2012) | 2022 return: bucket vs traditional |
|---|---|---|---|
| 20s/30s | 23.9% | 11.3% (70/30) | -27% vs -16.7% |
| 40s | About 21% | Over 10 points lower | Not provided |
| 50s | About 19% | Over 10 points lower | Not provided |
Then came 2022. A $10,000 stake in the younger-decade mix on 1 January 2022 fell to about $7,300 and needed 19 months to recover. By the retiree’s own account, it had grown to just over $28,000 by August 2026, compared with just under $15,000 for the traditional 70/30.
The broader market was not kind that year either. The S&P 500 lost about 18.11% on a total-return basis, while SCHD held up far better at -3.26% and the Bloomberg U.S. Aggregate Bond Index fell about 13.0%.
The window itself deserves scrutiny. The backtest period overlaps with an exceptional semiconductor run driven by smartphones, cloud computing and early AI, plus a long bull market in growth stocks.
Chips do not always pay Chip industry sales grew about 50% between 2000 and 2011, yet semiconductor stocks lost money over that stretch.
That contrast is the key caution here. A backtest built in one favourable window says little about the next 15 years. The more useful question for you is whether you could sit through a 27% fall without selling.
Why do experts still defend 60/40, and where do age rules fall short?
To judge any alternative, it helps to understand what it is reacting against. A bond is a loan to a government or company that pays you interest. Bonds tend to rise less than stocks in good years and fall less in bad ones.
When interest rates rise, existing bond prices fall. Older bonds paying lower interest become less attractive than new ones, so their prices drop until their yields compete.
The “100 minus your age” rule turns this into a formula. A 40-year-old would hold 60% in stocks and 40% in bonds, with the bond share growing each year.
What changed after 2022
2022 tested that logic hard. Stocks and bonds fell together, a rare event, and the Aggregate index posted its worst calendar year on record at about -13.0%.
The 60/40 assumptions that broke in 2022 came down to a positive stock-bond correlation during an inflation shock, a regime-specific flaw rather than proof that bonds have stopped diversifying.
Yet the major firms did not abandon 60/40. Vanguard argued that higher yields strengthened the long-term case for the split. Morningstar described it as “on the mend”, blaming a rapid rate shock rather than a failure of diversification, while Schwab called it viable but dependent on goals and risk tolerance.
Researchers have complicated the age rules further. Bill Bengen, creator of the 4% rule, has suggested somewhat higher equity shares can still support safe withdrawals for disciplined investors who rebalance. Wade Pfau stresses that valuations and bond yields matter, and treats 60/40 as a starting point rather than a universal answer.
Age-based rules also leave out much of your financial picture:
- Pensions
- Social Security
- Spending needs
- Health
The takeaway applies to every rule of thumb, including the four-bucket approach. Treat it as a draft, then adjust it to your own guaranteed income and spending needs.
Do Treasuries yielding above 5% change the math for your 60s?
Here is the surprise. A retiree who skips bonds for decades makes an exception once you reach your 60s.
His reasoning starts with yields. The 10-year Treasury yield was 5.27% on 6 October 2026, according to the Federal Reserve’s H.15 release, and Treasury.gov showed a 5.24% par yield on 1 October. CNBC reported the yield touching 5.35% yesterday, a 24-year high, while the inflation-protected 10-year real yield stood at 2.91%.
Those yields sit above the 4% withdrawal rate, the rule of thumb designed to make savings last at least 30 years. Individual Treasuries held to maturity also avoid price swings, because you receive your full principal back at the end.
The deeper reason is sequence-of-returns risk. This is the danger that large losses early in retirement, combined with withdrawals, permanently shrink your savings. Bonds give you something stable to draw from while stocks recover.
2008 versus 2022 for the 60s mix In 2022, the bucket mix for investors in their 60s fell about 16% versus about 5% for a traditional mix. In 2008, the gap widened sharply: about -37% for the bucket mix against about -11% traditional.
The bucket mix still grew faster over time, about 18% a year against about 7% for a 40/60 traditional mix. For you as a pre-retiree, though, the 2008 figures show that a stock-heavy mix can become the larger risk once withdrawals begin. Bonds matter most in crashes like 2008, not in rate shocks like 2022.
| Feature | Individual Treasuries | Bond funds |
|---|---|---|
| Maturity | Fixed date | No maturity date |
| Price swings | Avoided if held to maturity | Carry mark-to-market risk |
| Cash flows | Known in advance | Vary with holdings |
| Flexibility | Lower | Higher, more diversified |
You can buy Treasuries through TreasuryDirect or most brokerages. Whether higher yields justify withdrawing more than 4% remains disputed: Bengen is open to modestly higher rates, while Pfau warns that 4% remains a rough upper bound for many retirees.
What do adviser fees, conflicts, and the savings gap mean for you?
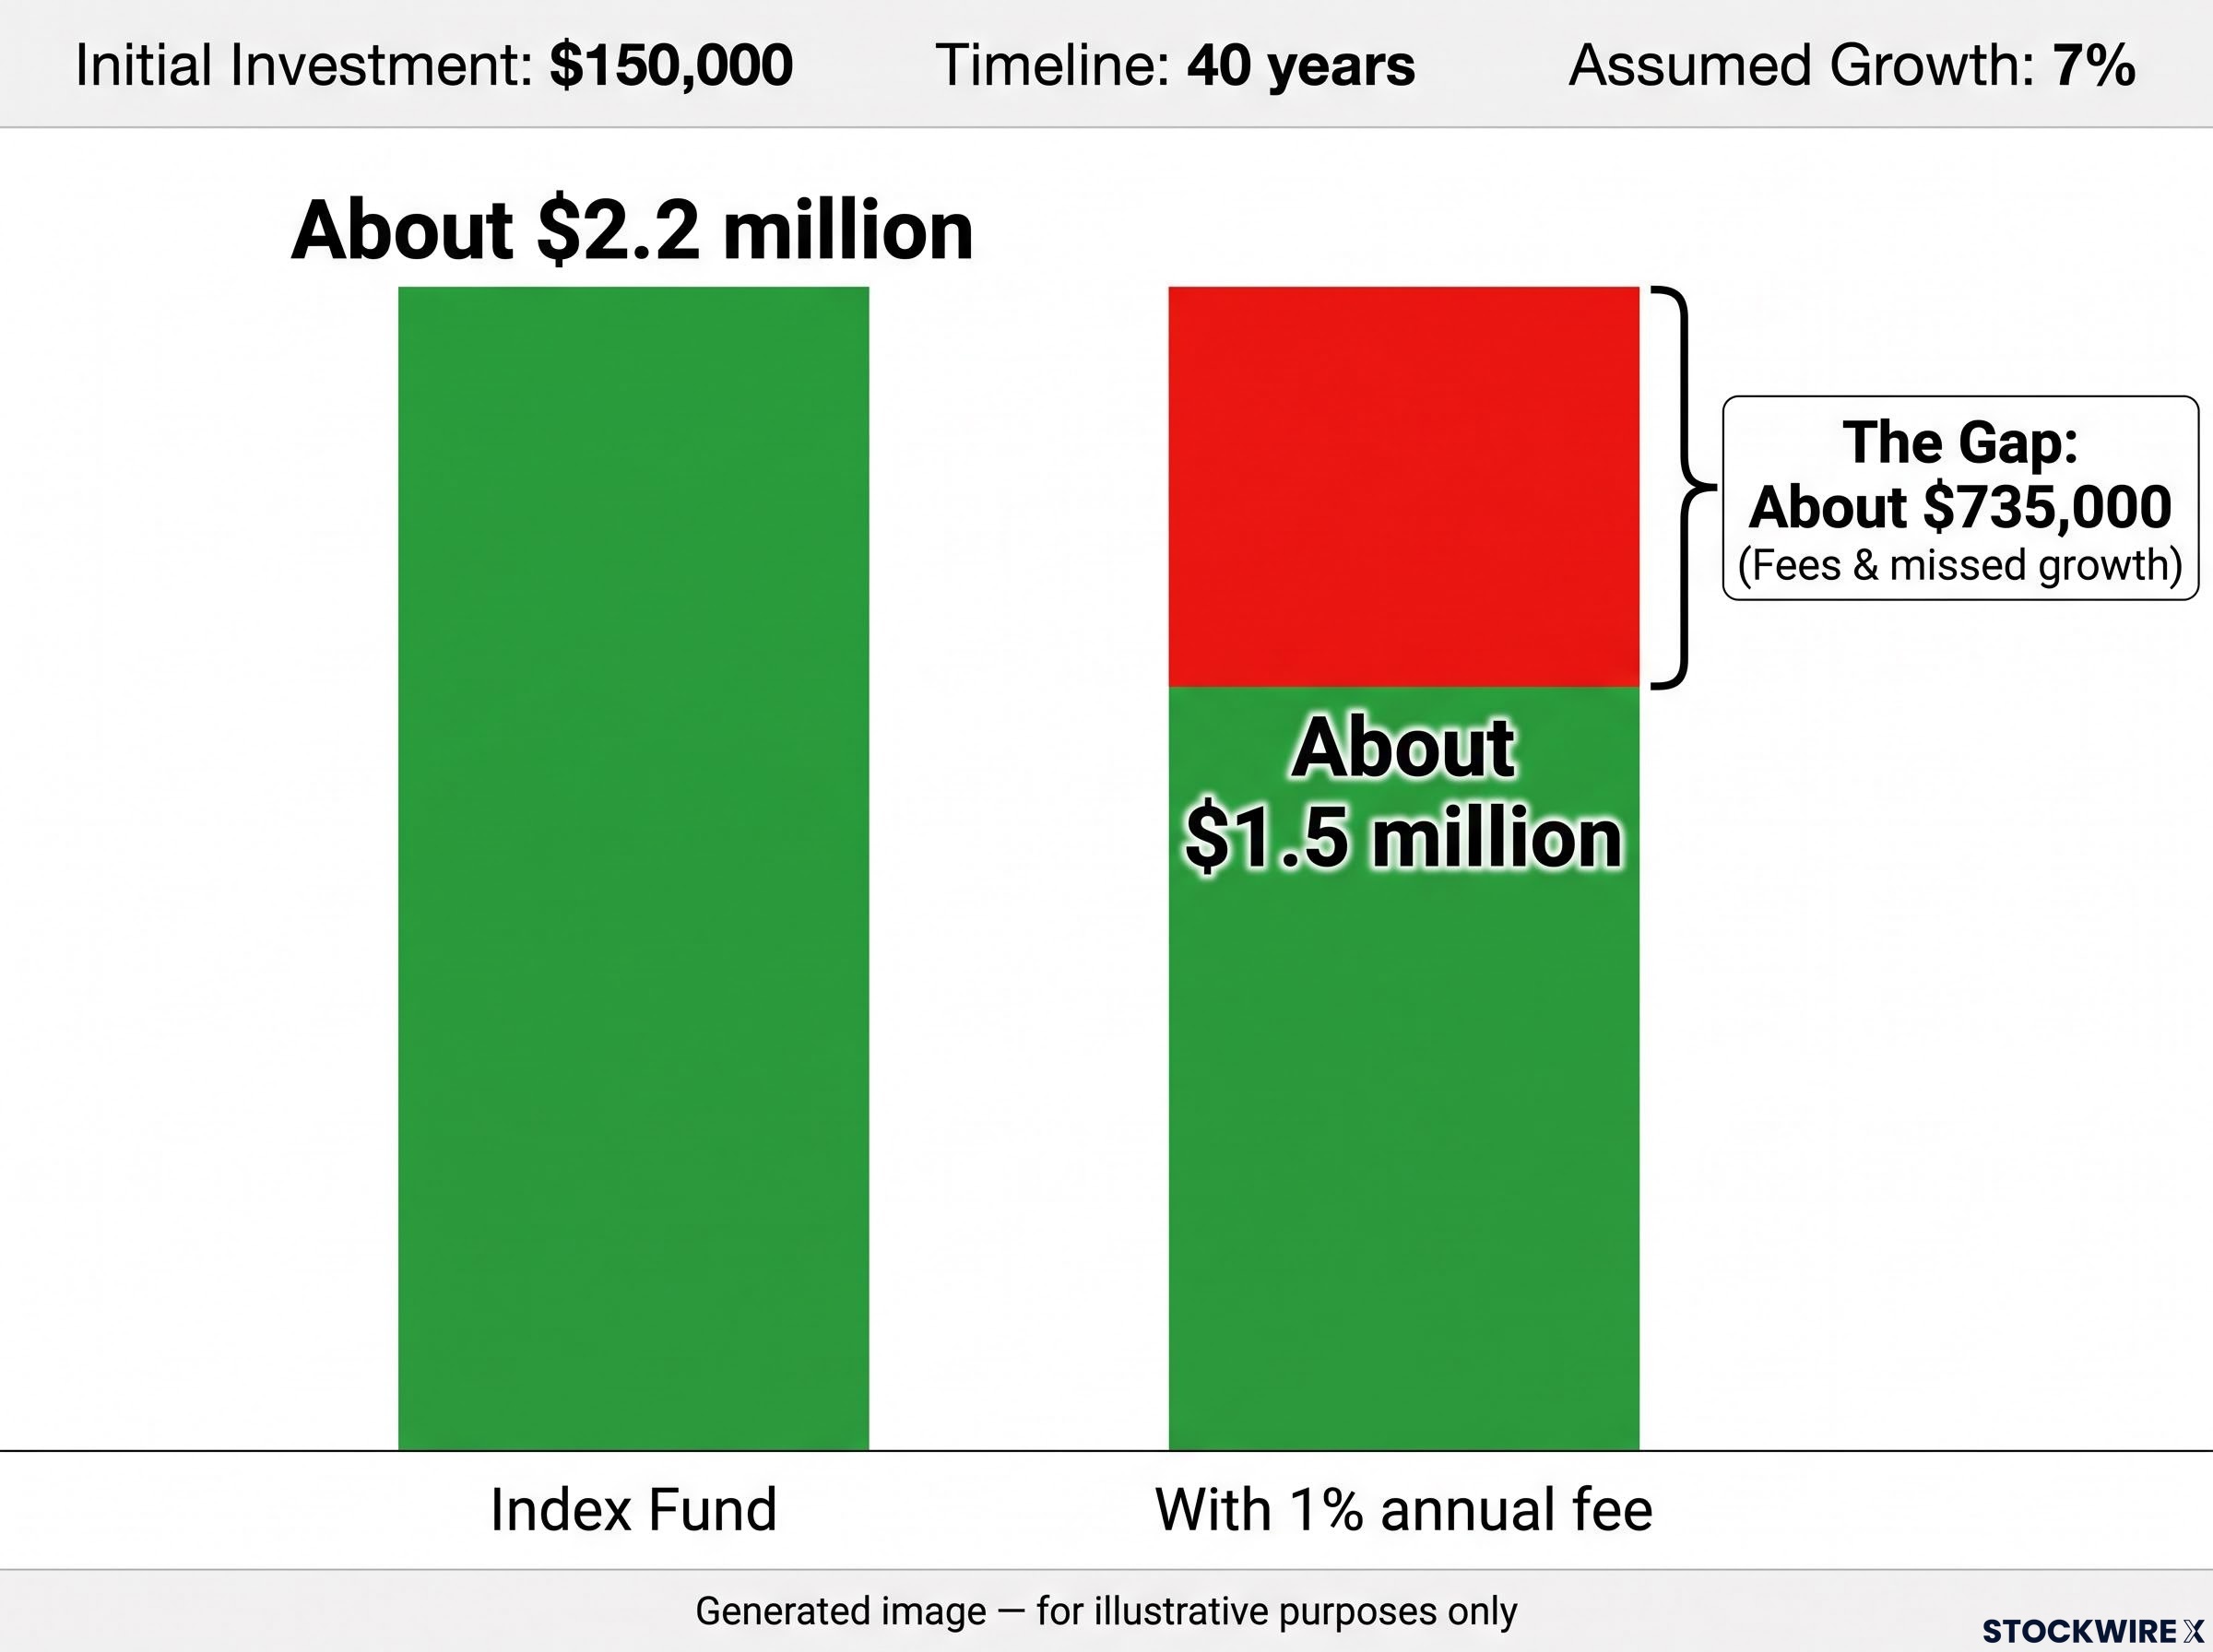
A 1% fee sounds small. Over time, it is not.
In the retiree’s example, $150,000 invested for 40 years at 7% grows to about $2.2 million in an index fund, but about $1.5 million with a 1% annual fee. The gap is roughly $735,000, made up of fees and the growth those fees would have produced.
Research shows fund fees matter even more than many investors assume, with the cheapest-quintile multisector funds achieving far higher success rates than the most expensive, which reinforces the cost of a 1% annual charge.
Conflicts compound the problem. The retiree stopped using advisers after interviewing two who focused on life insurance and could not compare their results with the S&P 500. First-year insurance commissions can reach 40-90% of premiums, which creates a clear incentive to sell those products.
Regulators watch for this. The SEC’s Regulation Best Interest targets steering clients towards high-commission products, FINRA warns about commission-heavy complex products, and the CFP Board requires its certified planners to act as fiduciaries and disclose material conflicts. Before hiring anyone, ask:
- Are you a fiduciary at all times?
- What are my total costs, including fund expenses, advisory fees and product charges?
- How has your performance compared with the index?
The second lever is time. The retiree’s figures, assuming 7% growth from zero, show how quickly the required monthly amount for $1 million climbs.
| Start age | Monthly amount for $1M at 7% |
|---|---|
| 30 | About $580 |
| 40 | About $1,300 |
| 50 | About $3,200 |
| 50 with $250,000 invested | About $1,000 |
Illustrations vary with assumptions, so treat these as rough guides. For context, median 401(k) balances are about $47,000 for ages 35-44 and about $107,000 for ages 55-64. SPIVA scorecards consistently show most active U.S. large-cap funds trailing the S&P 500 over 10 years, though the latest exact figure was not verified. Cost and starting age are the levers you control most, and the first question for any adviser is how they get paid.
Weighing the framework against your own risk capacity
The four-bucket approach produced strong backtests, but with deeper drawdowns and a heavy reliance on one sector. Its own bond exception for the 60s concedes the core point of diversification: protection matters most when you can least afford a crash.
Those results also came from an exceptional chip run that may not repeat. Past performance does not guarantee future results, and projections depend on market conditions and various risk factors.
Investors who still want chip exposure can limit the damage through core-satellite sizing, capping the sector at a small slice of the total portfolio so a 40-60% sector drawdown does not dominate overall results.
Before borrowing any part of this framework, consider your time horizon, when you will need withdrawals, and whether you could genuinely hold through a 27% fall.
This article is for informational purposes only and should not be considered financial advice. Investors should conduct their own research and consult with financial professionals before making investment decisions.