
Unemployment is rising, and many investors expect that to stop the Reserve Bank of Australia (RBA). It has not. The cash rate now sits at 4.60%, effective 30 September 2026, even though the jobless rate climbed to 4.6% in August.
The signal most investors are missing is the reason unemployment is rising. Its cause matters more than its direction, and that difference shapes how an RBA rate hike flows through Australian assets.
The latest move was the RBA’s fourth hike of the cycle and took the cash rate to roughly a 15-year high. The 10-year government bond yield sits around 5.35-5.38%, and the best one-year term deposits pay 5.50%. You can now earn a risk-free return above 5%, which means a return with almost no chance of losing your capital.
Many portfolios were built when that hurdle sat far lower, and they are still adjusting. Here is one framework that connects a higher risk-free rate to bonds, equities, listed property, cash and credit, along with the data point that decides what happens next.
Why would the RBA hike into a rising jobless rate?
On the surface, the decision looks contradictory. The RBA lifted the cash rate by 25 basis points to 4.60% within days of an Australian Bureau of Statistics (ABS) release showing unemployment at its highest level since late 2021. A basis point is one-hundredth of a percentage point.
The Bank’s own language removes the contradiction. MacroBusiness reported that the policy statement framed inflation as the problem, not jobs:
RBA Statement “The Statement made it clear inflation remains too high, reflecting both domestic capacity pressures alongside global shocks from the Middle East conflict and the AI boom.”
Three signals explain the Bank’s reasoning:
- Capacity pressures: The economy and labour market are running hot enough to keep inflation above target.
- Subdued demand required: The RBA said demand growth must stay subdued for a time to ease those pressures.
- A tolerance band: Governor Michele Bullock has suggested unemployment of 4.5-5% could help moderate inflation.
The August Statement on Monetary Policy (SMP), released on 11 August 2026, described conditions as “restrictive enough to keep growth below potential and for the labour market to ease gradually”. It projected unemployment reaching about 4.8% by the end of 2028. Trimmed-mean inflation, a measure that strips out the most extreme price moves to show the underlying trend, sits around 3.6% year-on-year, according to Janus Henderson.
Because trimmed mean inflation strips out volatile items such as fuel, it gives you a cleaner read on persistent price pressure, which is why the RBA leans on it more heavily than the headline CPI figure.
The RBA says it wants to lower inflation “in a way that keeps the level of employment as high as possible.” That aim gives it room to accept a higher jobless rate. The SMP’s market-implied path, roughly 10 basis points higher over 2026 before falling toward 4.4%, also predates the latest hike.
A 4.6% jobless rate sits inside the range the RBA treats as acceptable. You should not read it as a sign that rate cuts are close.
When big ASX news breaks, our subscribers know first
Is this jobless rise supply-driven rather than demand-driven?
The August labour force figures show why the Bank is unmoved. Unemployment rose from 4.5% in July to 4.6%, yet employment grew by 39,500, above expectations. Employers were still hiring.
The July jobs data had shown employment falling 15,800 and briefly pushed September hike odds lower, which makes the August rebound in hiring, and the RBA’s subsequent move, a sharp reversal of that dovish read.
The labour force, meaning everyone working or looking for work, expanded by about 67,700 people. Of those, 28,200 did not find a job. The participation rate, the share of working-age people in the labour force, reached 67.1%, just shy of the 67.2% record.
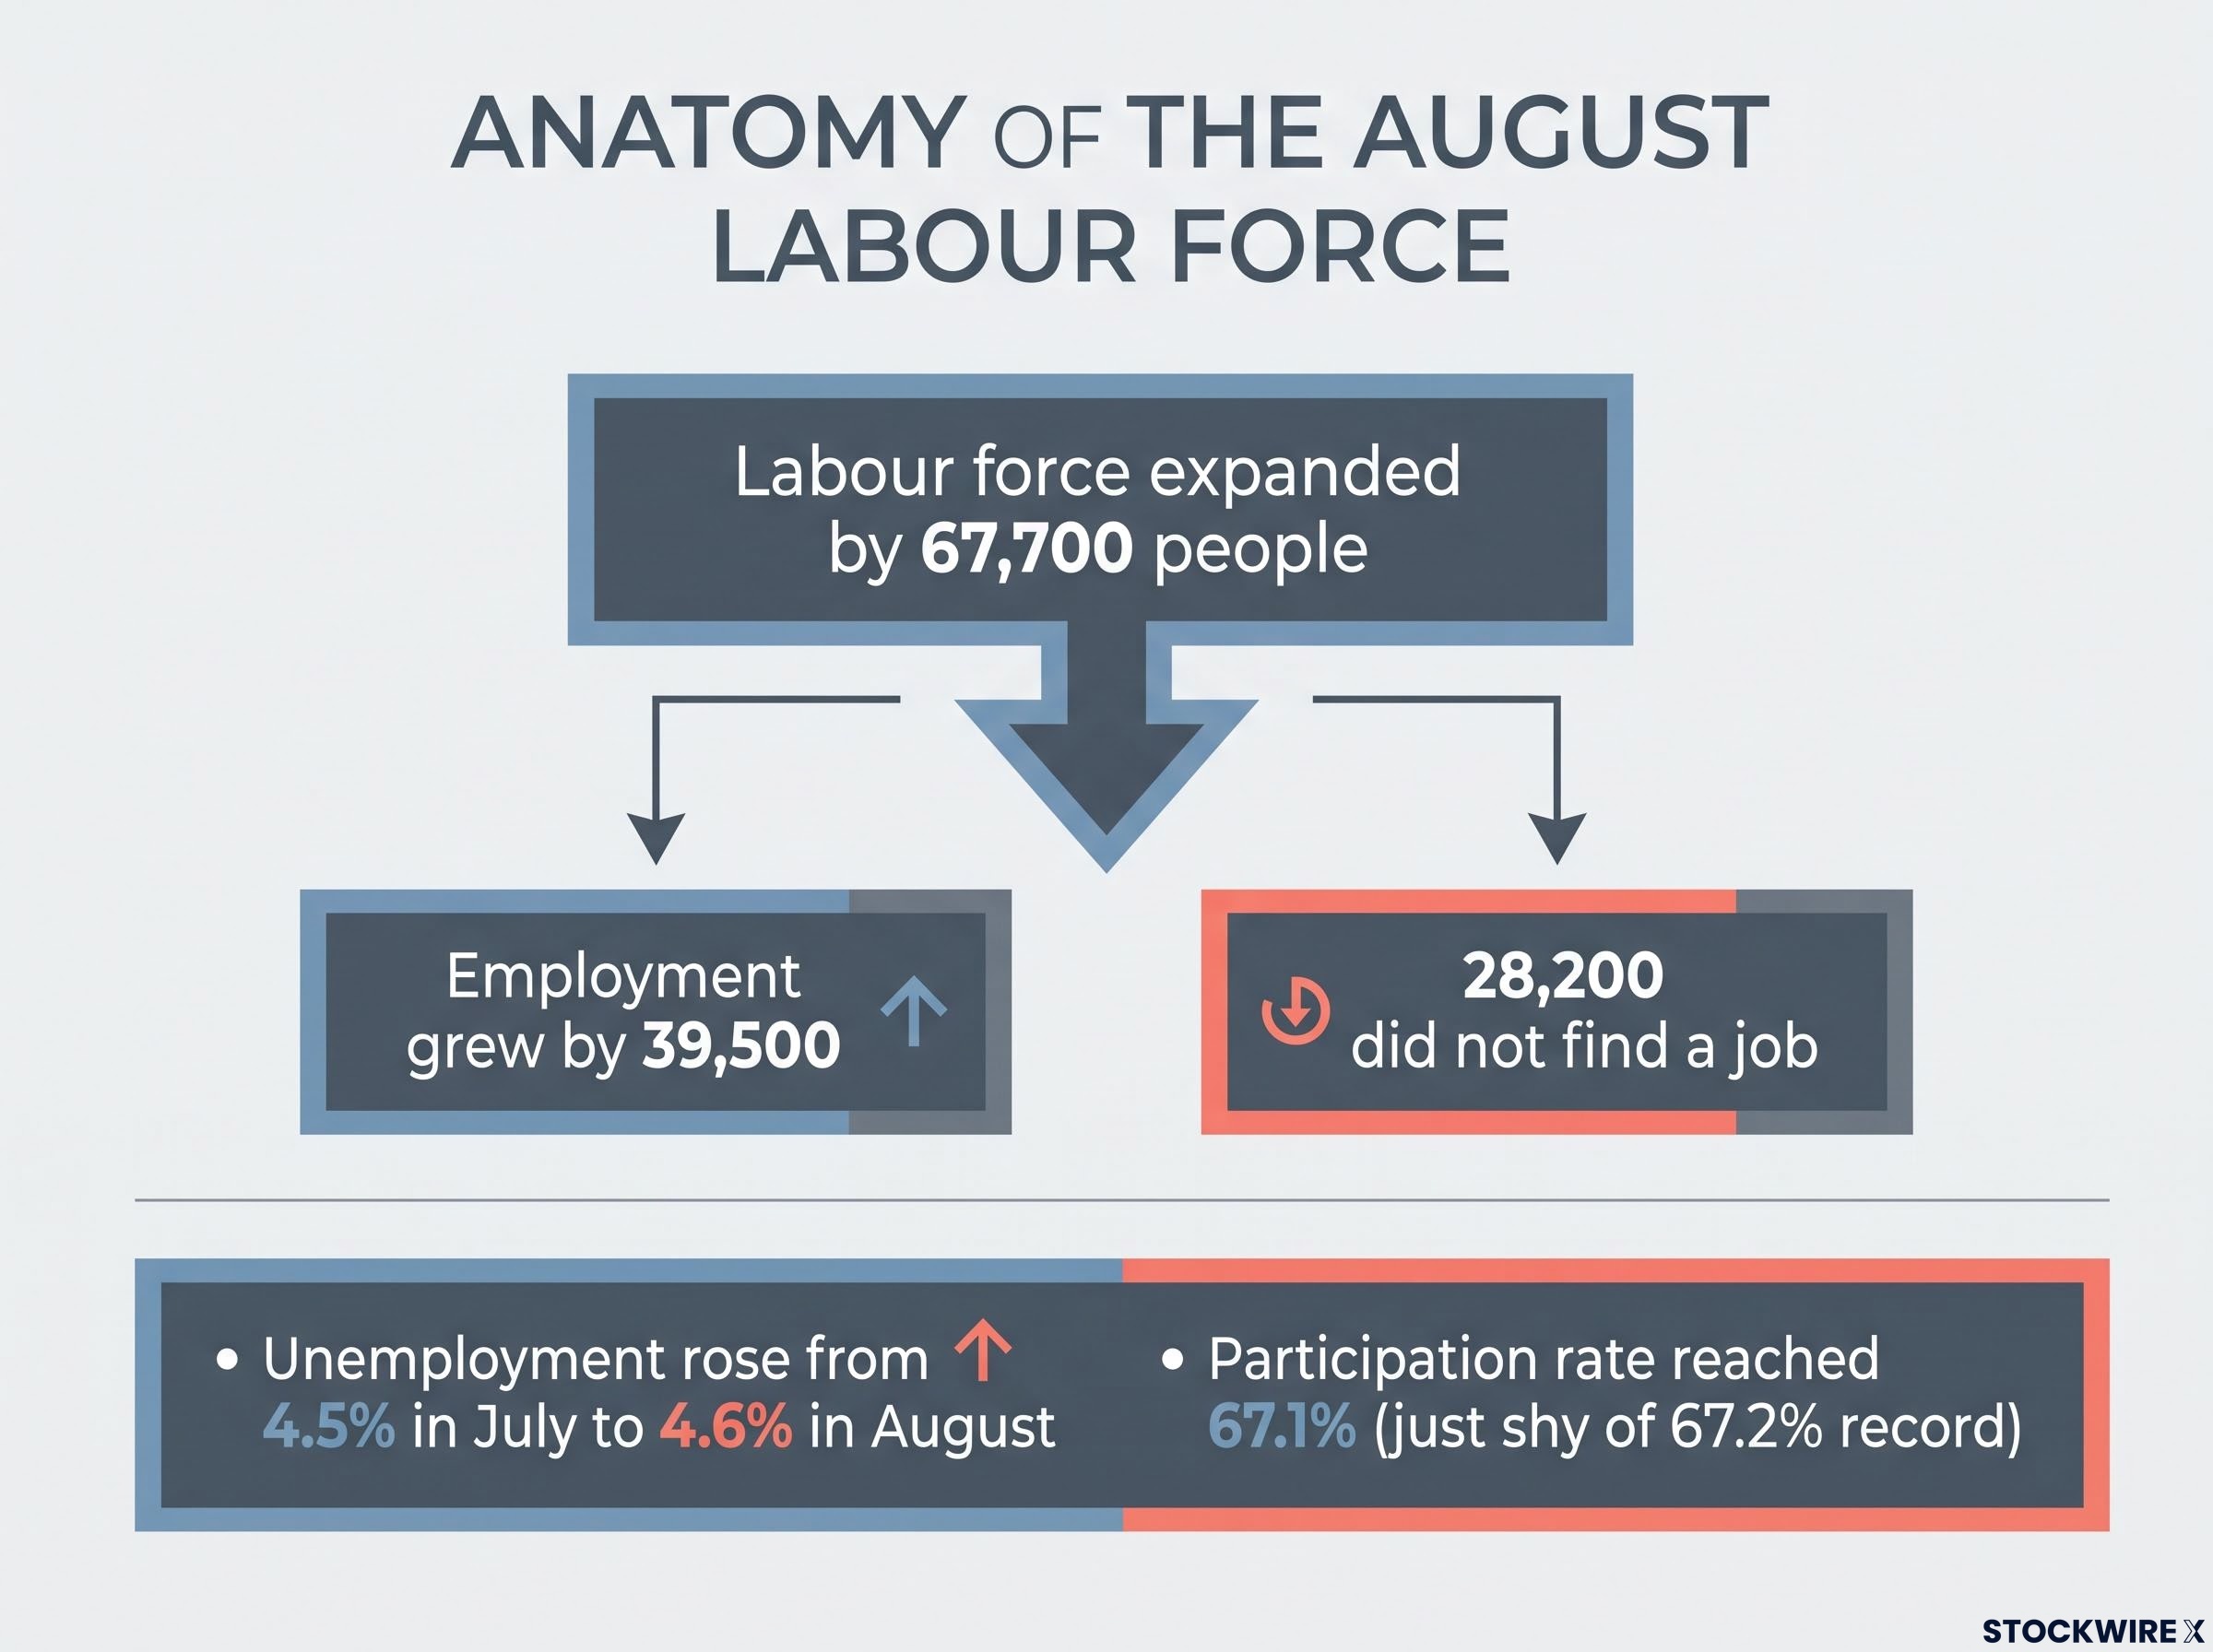
The mechanism follows directly from those figures. More people entered the labour market, employment grew but not fast enough to absorb them all, and the unemployment rate ticked higher. The ABS noted that an unusually large share of the newly unemployed came from outside the labour force.
This is supply-driven unemployment.
Demand-driven unemployment happens when employers cut jobs because spending is falling, and it cools inflation quickly. Supply-driven unemployment does little to slow price growth. YieldReport links the participation rise to cost-of-living strain, with people taking on work to cover mortgage costs or make up for real wage losses. Full-time jobs fell 6,300 while part-time jobs rose 45,800, and the multiple job holding rate hit a record 6.9% in the June quarter.
| Indicator | August 2026 reading | Supply-driven reading | Demand-driven reading |
|---|---|---|---|
| Employment | +39,500 | Still growing | Would be falling |
| Participation | 67.1% | Near record | Would be falling as workers give up |
| New unemployed | Large share from outside the labour force | New entrants searching | Would be mostly job losers |
| Vacancies | -1.4% year-on-year | Modest softening | Would be falling sharply |
The Australian Institute of Company Directors (AICD) cautioned that changes to the ABS Supplementary Survey methodology may have added variability. One month should not carry too much weight.
What the vacancy data adds
Vacancies fell only 0.9% over the quarter and 1.4% over the year, to about 325,000, according to MacroBusiness. Private-sector vacancies fell 2%, while public-sector vacancies rose 7.8%. Demand is softening, but only gradually.
YieldReport describes slack building beneath a tight surface, slowly enough for the RBA to keep tightening. When unemployment rises because more people are looking for work rather than because employers are shedding staff, you should expect rates to stay higher for longer.
What does a 5% risk-free rate do to bond yields and the hurdle for everything else?
If the cash rate is staying high, the bond market is where that view gets priced first. Yields across the curve have moved to levels not seen in over a decade.
| Instrument | Yield | Source | Note |
|---|---|---|---|
| 3-month BBSW | 4.74-4.77% | YieldReport / Janus Henderson | Different observation times |
| 6-month bank bills | 5.12% | Janus Henderson | Above the cash rate |
| 3-year Commonwealth | 4.93-5.03% | Janus Henderson / YieldReport | Late September readings |
| 10-year Commonwealth | 5.35-5.38% | Janus Henderson / TradingEconomics | 5.38% on 7 October 2026 |
| 30-year Commonwealth | 5.76% | YieldReport | Long end of the curve |
| 10-year inflation-linked | 2.4% real | Janus Henderson / TradingEconomics | Return above inflation |
BBSW, the bank bill swap rate, is the benchmark rate banks charge each other for short-term funding. The ranges reflect different observation dates. The 10-year yield is about one percentage point higher than a year ago, at levels last seen around 2011, and eased from just above 5.4% after August inflation came in softer than expected.
Markets expect more tightening. YieldReport notes pricing points to a cash rate of 4.90-4.95% through late 2026 and early 2027, above the RBA’s August path.
The risk-free rate matters because it becomes the discount rate for every other asset:
- Investors value an asset by what its future cash flows are worth today.
- A higher risk-free rate shrinks the present value of those cash flows.
- Cash flows far in the future, such as growth company earnings or long property leases, shrink the most.
With a real yield near 2.4% and bank bills above 5%, you can now earn meaningful returns without taking equity or property risk. That raises the bar for every riskier asset.
How is the higher risk-free rate repricing equities, listed property and cash?
Lay three assets against that yardstick and a gap appears.
| Asset | Yield measure | Level | Versus 10-year at about 5.35% |
|---|---|---|---|
| Best one-year term deposit | Interest rate | 5.50% | Slightly above |
| MSCI Australia | Earnings yield | Just under 4.8% | Below |
| Australian listed property | Dividend yield | About 3.8% | Over 1.5 points below |
Equities and the earnings yield gap
MSCI Australia traded at 20.97 times earnings as at August. Its earnings yield, which is annual earnings divided by share price, sits just under 4.8%. That is below both the 10-year yield and the best term deposits.
One camp argues bonds have absorbed most of the repricing, and that easing 10-year yields signal a plateau with equities closer to fair value. Another points to trimmed-mean inflation near 3.6% and warns of further adjustment if policy stays restrictive. Both readings have merit, and the next inflation print will test them.
The same squeeze is visible offshore, where the equity risk premium on US stocks has compressed to its thinnest level since 2002 as real bond yields rose, a useful comparison for judging how little cushion Australian equities now offer.
Listed property: the bond proxy that stopped behaving like one
Australian real estate investment trusts (A-REITs) were long treated as bond substitutes because of their steady income. The $140 billion sector fell almost 20% over the past year, against a decline of under 1% for the ASX 200. Its dividend yield of about 3.8% now trails the 10-year by more than 1.5 points.
Citi estimates that historically, a 100 basis point rise in the 10-year yield has meant an average 14.9% negative return for listed property. A-REITs priced off the old risk-free rate are paying the price of the new one.
Institutions have adjusted. Washington H. Soul Pattinson cut listed equities to 40% of its portfolio from 90% at the end of FY21 and holds 20% in fixed income, with post-tax net asset value of $14.5 billion at its FY26 result.
Todd Barlow, Chief Executive Officer, Soul Patts The firm is now being paid to hold riskless cash.
If your equity and property holdings yield less than a term deposit, you are accepting price risk for less income. Check whether the growth you expect justifies that trade.
Where is credit cracking, and what does September-quarter CPI decide?
Credit shows the clearest strain, but the headline needs unpacking.
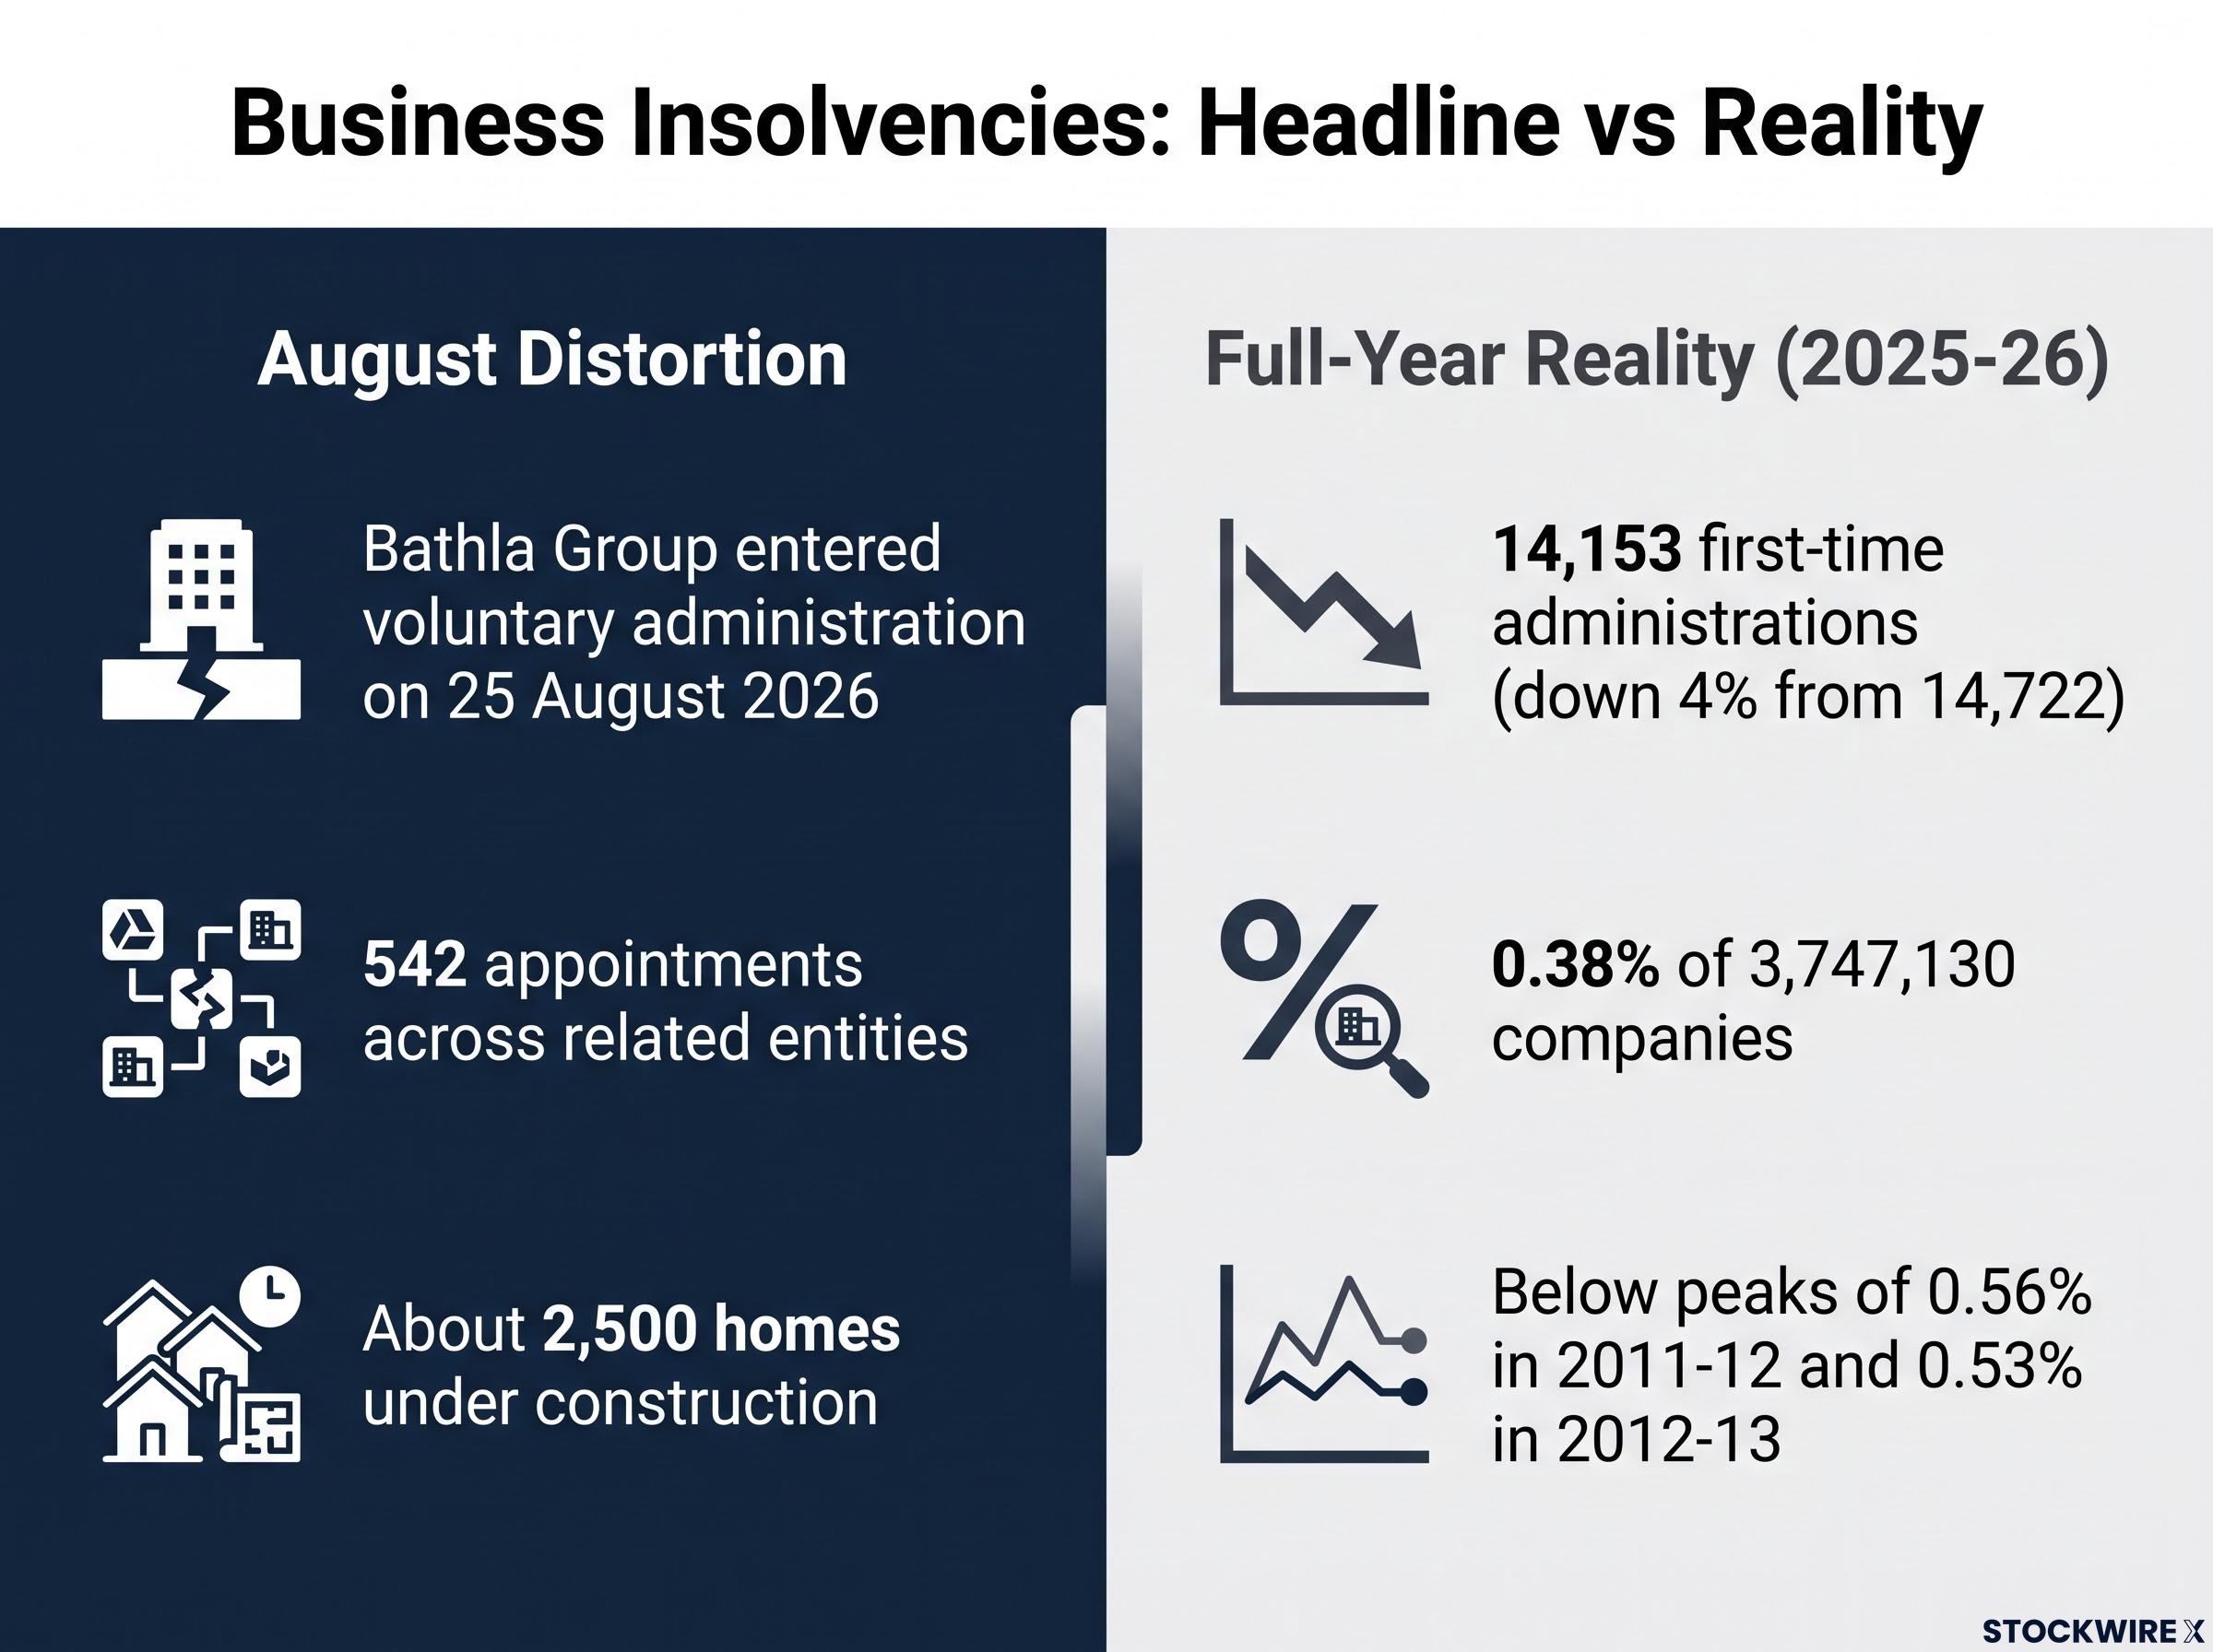
Two views of insolvency Business insolvencies rose 66% to a record in August (YieldReport). ASIC’s full-year data shows first-time external administrations fell 4% in 2025-26.
The record was heavily distorted by Bathla Group, which entered voluntary administration on 25 August 2026 with Teneo Australia appointed. Bathla accounts for 542 appointments across related entities and about 2,500 homes under construction. Construction made up 1,172 of 3,234 insolvencies in the financial year to mid-September, according to the Australian Securities and Investments Commission (ASIC).
The full-year picture is calmer. ASIC’s Issue 41, published 1 October 2026, recorded 14,153 first-time administrations in 2025-26, down from 14,722. That is 0.38% of 3,747,130 companies, below the peaks of 0.56% in 2011-12 and 0.53% in 2012-13.
Higher bank-bill rates raise refinancing costs and pressure loan covenants, which are conditions lenders attach to borrowing. Mirvac warned that smaller developers relying on private credit are most exposed, and private credit default estimates range from under 1% to 19%. The stress is concentrated so far, so watch whether it spreads beyond developers before treating it as a broad warning.
Why September-quarter CPI is the swing factor
August’s monthly inflation undershot forecasts and briefly trimmed tightening bets. A hot September-quarter print could push the cash rate toward market pricing and add pressure to property and credit. A soft print could support the plateau view in bonds and equities.
The risk runs both ways. Lagged effects on consumption, housing and investment could turn participation-driven cooling into genuine demand weakness in 2027. Some point to the 2022-23 cycle as a similar episode, though that comparison remains unverified.
Your watchlist:
- September-quarter CPI
- The RBA’s next update on 3 November 2026
- Weekly ASIC insolvency data, published two weeks in arrears
These statements are speculative and subject to change based on market developments. Past performance does not guarantee future results.
What the higher risk-free rate changes, and what it does not
The chain runs in one direction. A supply-driven jobless rise leaves the RBA free to stay restrictive, which keeps the risk-free rate above 5%, which forces every asset to justify its yield and growth against that benchmark.
What has not been settled is just as important. Bond yields may have plateaued or may have further to climb. Credit stress may stay confined to developers or spread. September-quarter CPI will narrow those possibilities.
The practical test is simple. Line up the income and expected growth of each holding against what a term deposit or government bond now pays, and ask whether the extra risk is earning its keep.
For readers wanting to rebalance across growth and defensive assets, our full explainer on asset allocation for Australian investors shows why allocation drives over 90% of long-term returns.
This article is for informational purposes only and should not be considered financial advice. Investors should conduct their own research and consult with financial professionals before making investment decisions.