
A $1 move in a stock is not always worth the same to your option. The fifth dollar of a rally can add more to a call’s value than the first. Most beginners watch delta, but in delta gamma options analysis, gamma is the reason delta keeps changing as the stock moves.
MongoDB (MDB) recently gave traders a live example. After a post-earnings gap lower, the stock climbed for eight days, and pro trader Jake Sweeney of Verified Investing picked a 370 call expiring 43 days out. The stock sat near $368 when he made the call.
Prices have since eased. MDB closed at $363.03 on 7 October 2026, according to MarketWatch, and it trades in the mid-$360s as of 8 October 2026.
Here you get a working mental model of how delta and gamma interact with strike and time, then see it applied to one real selection. This is education and analysis, not a recommendation to buy or sell MDB or any option.
What delta and gamma actually measure
Sweeney, teaching alongside co-host Tabby Pierce, uses a driving comparison that sticks. Here are the precise definitions, with his analogy beside each:
- Delta: the amount an option’s price changes for each $1 move in the underlying stock. In Sweeney’s framing, it is your speed.
- Gamma: the amount delta itself changes for each $1 move in the stock. In his framing, it is the accelerator.
The one-line version Delta is speed. Gamma is the accelerator that changes your speed.
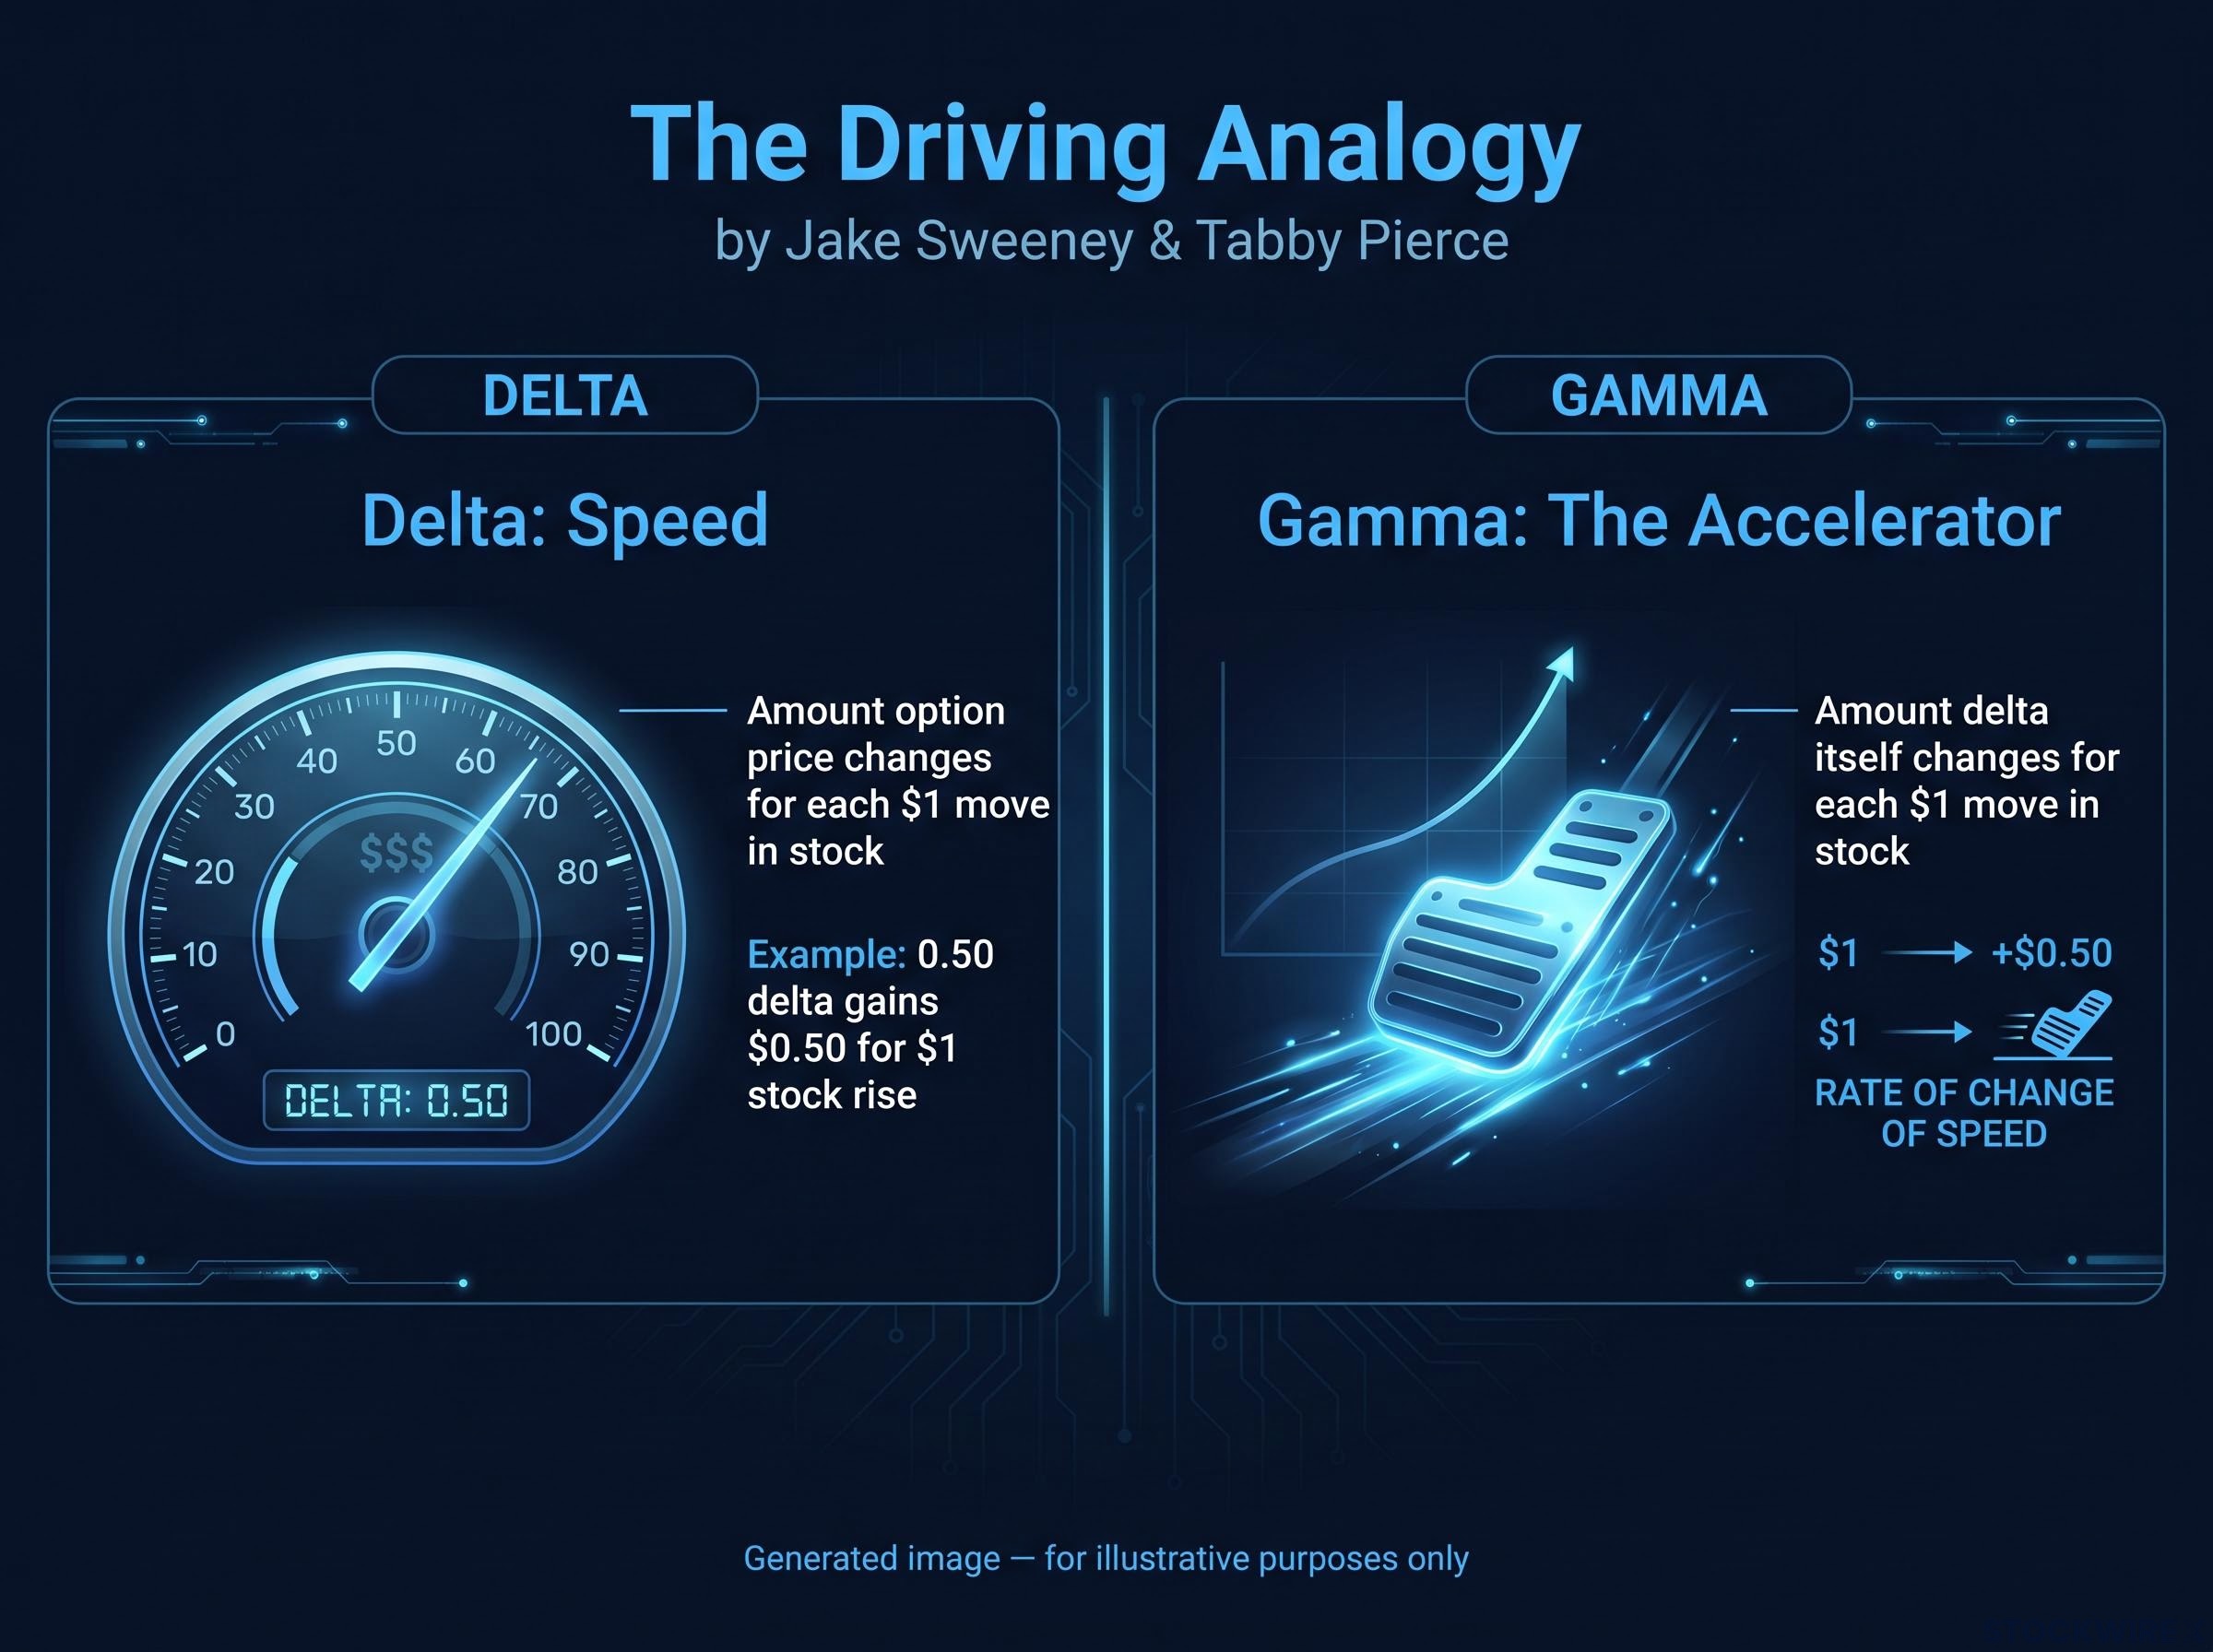
A call with a delta of 0.50 gains roughly $0.50 for every $1 rise in the stock at the outset. That figure does not stay put. Gamma adjusts delta as the trade works, so each additional favourable dollar adds more profit than the one before.
A call with a 0.50 delta is only a starting point, and how delta changes over time depends on both the stock’s path and the days left to expiry, so the same contract can feel very different a month later.
When gamma is high, even a small stock move shifts delta materially. Your option’s sensitivity is not a fixed number; it is a moving target.
The MDB setup shows how this drift could look. The figures below are illustrative, not live quotes.
| Stock price (illustrative) | Approximate delta of 370 call | What it means |
|---|---|---|
| About $368 | 0.57 | Moderate sensitivity at entry |
| Nudging above $370 | Rising | Gamma pushes delta higher as the strike is crossed |
| Further above the strike | Roughly 0.70-0.80 | Each extra dollar adds more than earlier ones |
The educator consensus from Cboe, the Options Clearing Corporation (OCC), Investopedia, Schwab, Fidelity, tastytrade and OptionsPlay agrees on this behaviour. Reading delta alone gives you a snapshot. Gamma tells you how quickly that snapshot will change, and that is what decides how your position feels on a fast move.
When big ASX news breaks, our subscribers know first
Why gamma peaks at the money and near expiration
Plot gamma across strikes and you get a funnel. It is low on both edges and peaks right at the strike, where the stock price and strike price meet. Two mechanisms build that shape.
Why the at-the-money strike is the make-or-break zone
An option is “at the money” when the stock trades at the strike price. Near that point, a small move flips the option between out of the money (no intrinsic value) and in the money (holding intrinsic value), so the probability of finishing in the money changes quickly.
Picture a $370 call with the stock at $369. A $2 move decides which side of the line it sits on.
Far from the strike, there is little room for change. Deep in-the-money deltas sit near 1 and deep out-of-the-money deltas near 0, so gamma stays low.
Why time to expiration steepens the curve
As expiry approaches, the payoff becomes more binary: the option either finishes with value or it does not. The delta curve grows steeper, steepest at the strike, so small stock moves produce large option swings.
That responsiveness has a price. Theta is the daily loss in an option’s value from the passing of time, and short-dated at-the-money contracts carry both high gamma and high theta.
| Profile | Short-dated ATM | 40-60 day near-the-money | Deep ITM or far OTM |
|---|---|---|---|
| Gamma | Highest | Moderate | Low |
| Theta | High, fast decay | Slower decay | Varies |
| Typical use | Event trades; far OTM versions behave like lottery tickets | Multi-week directional trades | Stock-like exposure (ITM) or speculation (OTM) |
Gamma also works both ways. As a call buyer you are long gamma, gaining faster when right and losing faster when wrong.
That is why Sweeney prefers contracts two to three months out, and many educators suggest 30-60+ days for retail long calls. The contracts offering the most explosive response are also the most likely to decay or whipsaw, so choosing an expiration is really choosing how much acceleration you are willing to pay for.
Applying delta, gamma and duration to the MDB 370 call
Sweeney did not start with the option. He started with the chart, then let each filter narrow the choice.
The technical case
MDB had risen for about eight days after gapping down. The source places that gap at roughly 420 in one reference and cites a gap-down origin near 410 as resistance in another, so both levels are worth watching.
Recent candles were wicking into a shelf of support near 364.26, a sign buyers were defending the level. Overhead, the 3 November 2025 high near 385.44 stood as a major pivot.
A long-term trendline from the 24 April 2026 pivot low had held through multiple touches before flipping from support to resistance. Daily RSI (the relative strength index, a momentum gauge from 0 to 100) read about 47-50, well short of the overbought zone near 70.
The options-chain choices
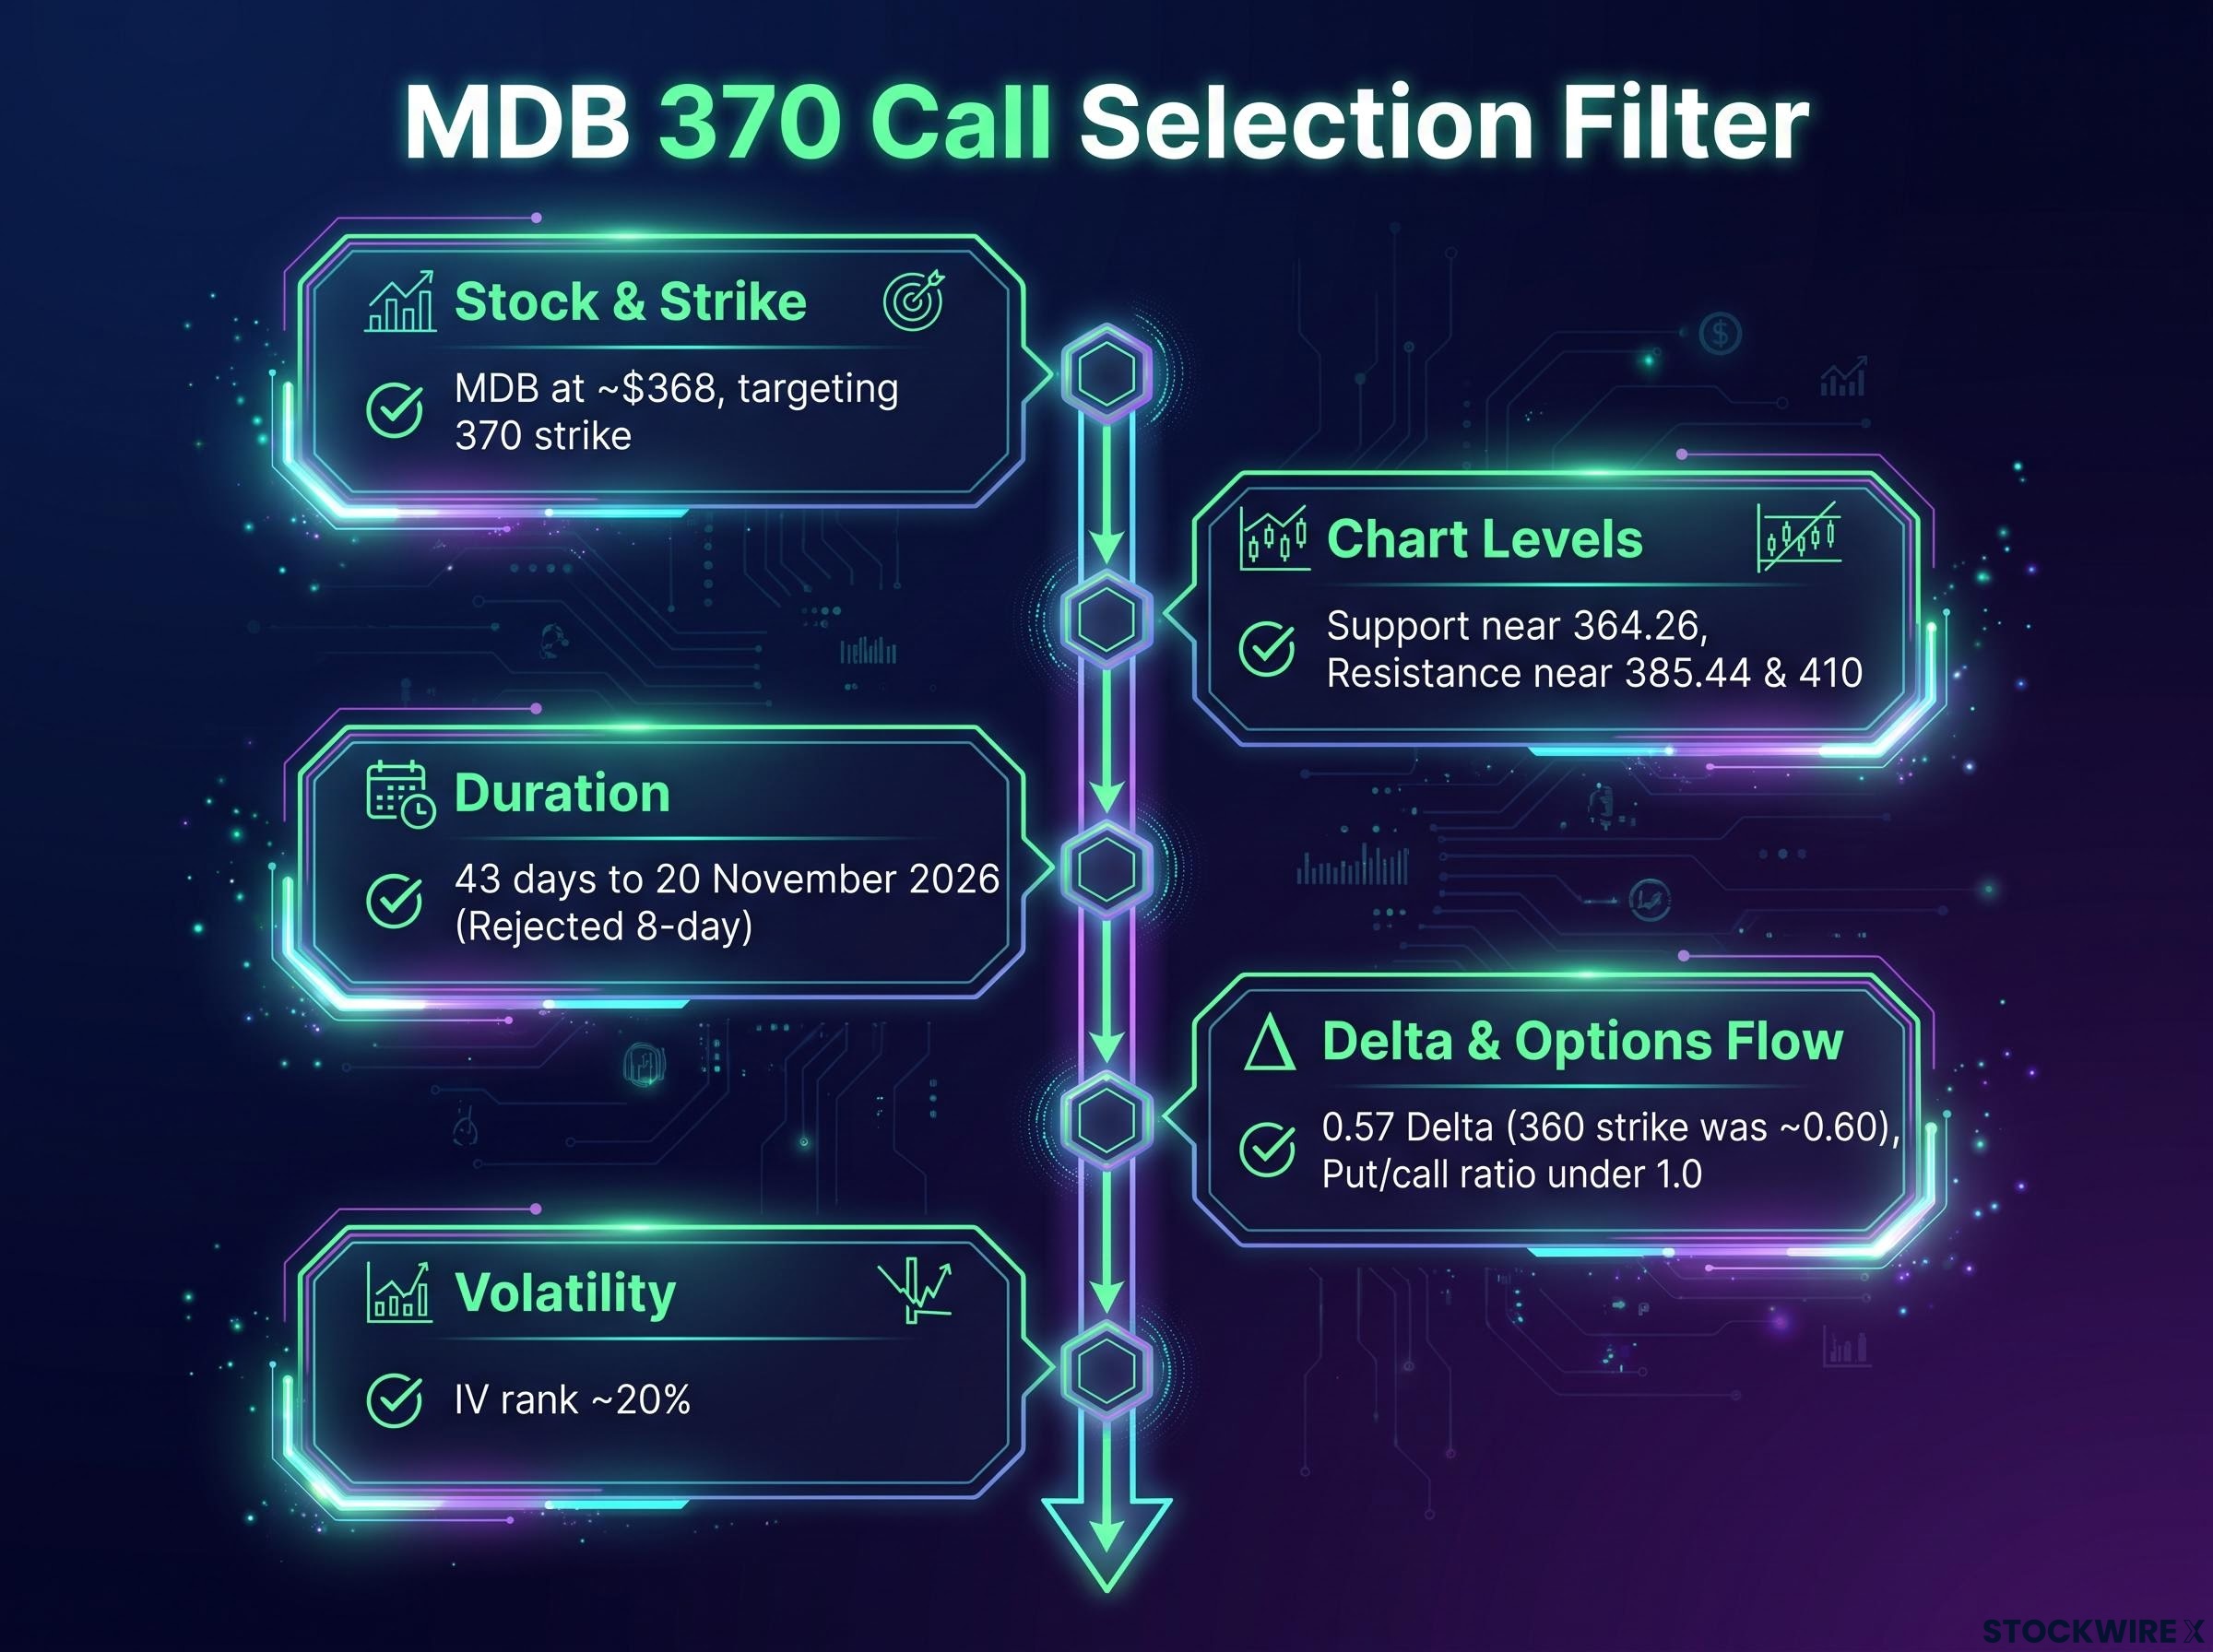
With the chart setting direction, the chain set the contract. Sweeney weighed the 360, 365 and 370 strikes in this order:
- Chart levels: support near 364.26, resistance near 385.44 and 410.
- Strike: 370, slightly out of the money at about $368 but sitting on a support line and at his target.
- Delta: 0.57, against a preference near 0.5. The 360 showed about 0.60; higher delta brings more certainty but costs more.
- IV rank: about 20%, which he read as cheap premium. IV rank shows where current implied volatility sits within its past-year range.
- Put/call ratio: under 1.0, signalling more call buying.
- Duration: an 8-day contract was rejected as too close to expiry; 43 days to 20 November 2026 gave the thesis room.
- Chain check: confirmed on the IBKR options chain.
| Factor | Reading | Why it mattered |
|---|---|---|
| Delta | 0.57 | Near-the-money balance of cost and direction |
| Expiration | 43 days | Moderate gamma, slower theta than short-dated contracts |
| IV rank | About 20% | Premium not inflated by volatility |
| Put/call ratio | Under 1.0 | Flow leaning bullish |
One caveat: the IV rank and put/call figures come only from the original source. No independent, named-source MDB options data was found to confirm them.
Each filter answers a different question: direction, price paid, time and gamma exposure. You can reuse those questions on any ticker without copying the trade.
For readers wanting to turn IV rank into a strategy choice, our dedicated guide to choosing options strategies with implied volatility explains when buying premium beats selling it.
Where gamma risk bites: what can still go wrong
The checklist looks tidy. The risks are less so.
MDB has already shown how violently it can gap. On 1 September 2026, MongoDB reported revenue of $771.8M, up 30%, with EPS of about $1.90 against $1.61 consensus and raised full-year guidance. Shares still fell around 17%, because Q3 revenue guidance of about $756-$761M signalled deceleration.
The stock’s 2026 range, per Macrotrends as of 11 September 2026, runs from a low of $225.95 to a high of $399.65. That spread tells you how far a single software name can travel.
The main ways this setup can still lose money:
- Premium loss: if MDB fails to clear the strike plus the premium paid by expiry, the call can expire worthless, a 100% loss.
- Theta drag: sideways chop lets time decay erode value even if the longer-term thesis holds.
- Gaps and vol crush: a gap against you can wipe out much of the value, while a post-earnings drop in implied volatility can mute a gap in your favour. A low IV rank is no guarantee, and an earnings date inside your expiry window changes the trade.
- Indicator limits: RSI can stay stretched, support can break, and put/call ratios can be skewed by hedging.
- Concentration: one stock means one company’s, and one sector’s, shocks.
One way traders cap the downside of a single long call is through defined-risk spreads, which limit the net debit at risk while still keeping some exposure to a sharp move.
The setup itself carries cautions. An eight-day rally raises the odds of a pause, resistance sits near 385.44 and 410, and the trendline has turned against the stock.
A 43-day, near-0.5-delta call reduces gamma and decay stress, but it does not remove them. Position size and clear exit criteria are the levers you still control.
Educational illustration only This example shows how delta, gamma, theta and volatility interact. It is not a recommendation to buy or sell MDB or any option. Past performance does not guarantee future results.
What to carry from this trade, and what to leave behind
Delta sets your starting sensitivity. Gamma sets how fast that sensitivity changes. Strike and duration decide how much of each you hold, and how much time decay you pay for the privilege.
The MDB 370 call is a worked example of balancing a near-0.5 delta and moderate gamma against theta. It is not a signal to copy.
Before you select any call, ask three questions:
- Where is gamma highest on this chain, and do you want to sit there?
- How much time does your thesis genuinely need?
- What happens to the position if volatility drops or the stock gaps?
This article is for informational purposes only and should not be considered financial advice. Investors should conduct their own research and consult with financial professionals before making investment decisions.