Singapore-dedicated equity funds have grown five-fold, from US$1 billion to US$5 billion by August, on the back of a government-backed programme. The intuitive read is that small caps should be rallying already. History says otherwise: according to Phillip Securities Research, outperformance has tended to arrive 6-12 months after money is allocated, not when the allocation is announced.
That gap matters right now because three signals have landed close together. The Equity Market Development Programme (EQDP) named its third batch of managers on 29 September 2026. Bank loan growth has hit a record 13.5%. And City Developments Limited (CDL) unveiled its GET+ strategy on 28 September, which the market met with scepticism.
Each of these can be read as a buy signal or a warning, depending on how closely you look. For a global investor, misreading them means either paying early for flows that have not arrived or missing the companies that have actually delivered.
Here is a way to separate real tailwinds from headline noise in your Singapore market analysis, with a checklist you can apply to your next holding.
How is the EQDP changing demand for Singapore small and mid-caps?
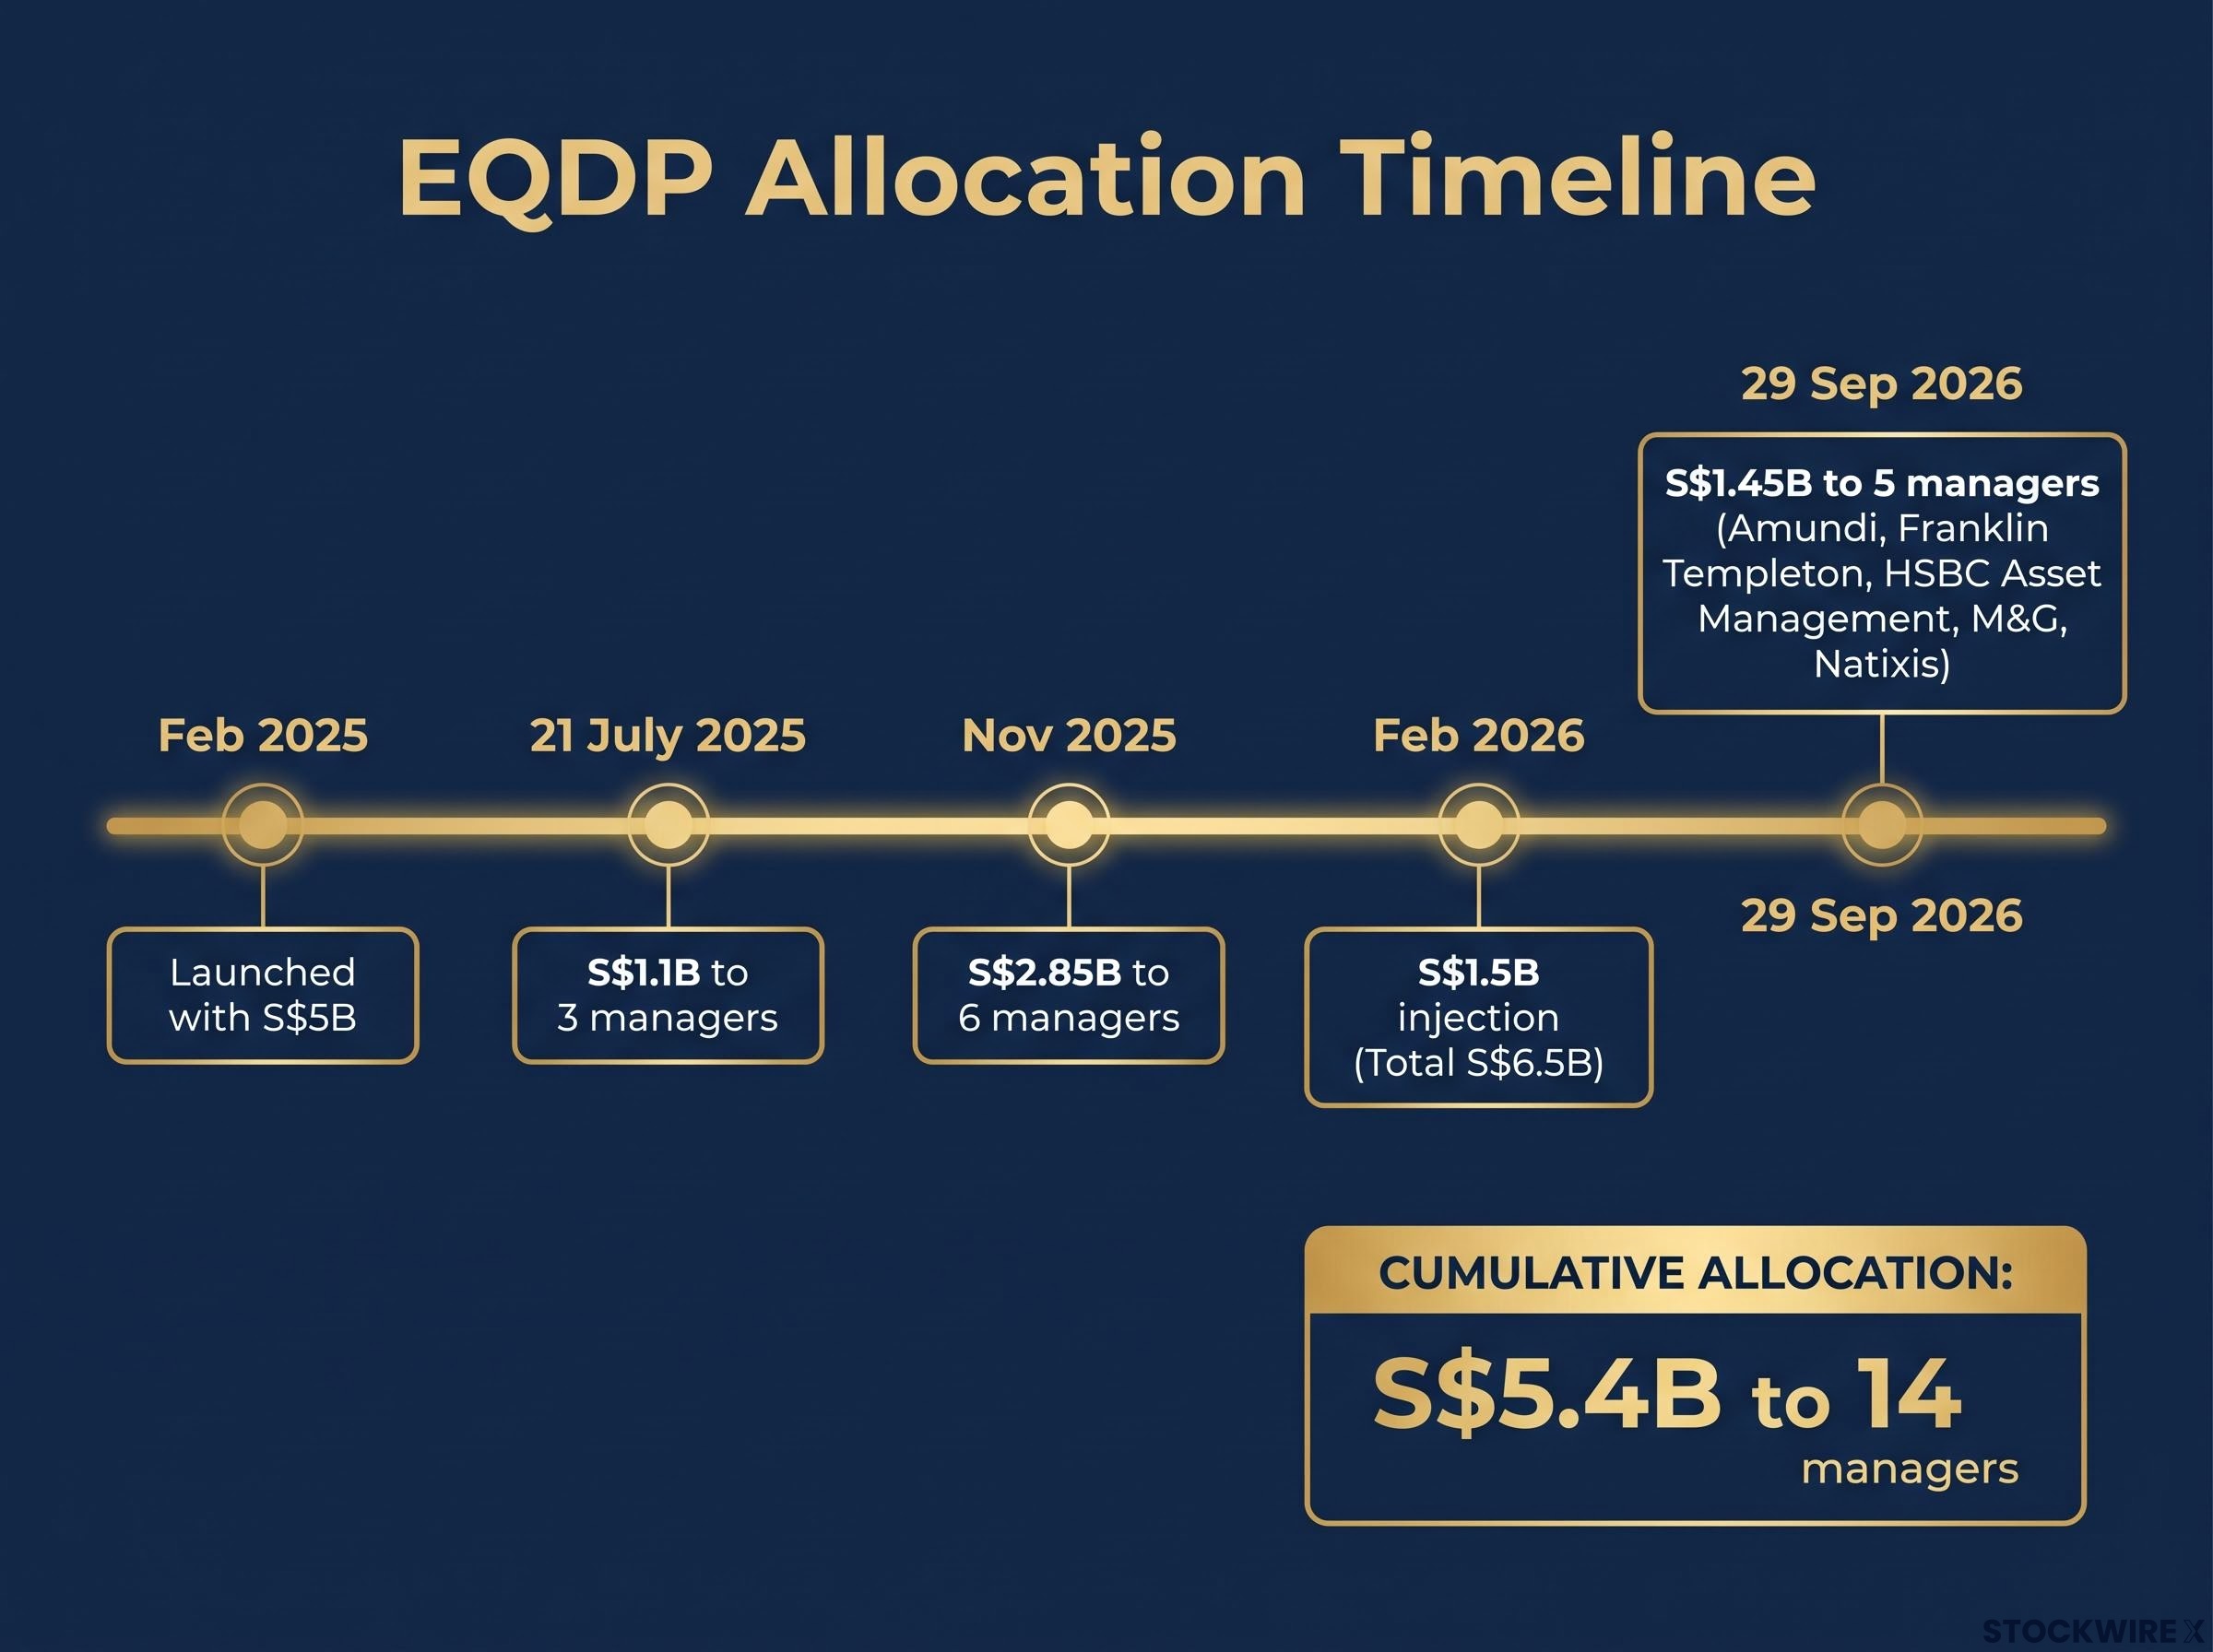
The Monetary Authority of Singapore (MAS) launched the EQDP in February 2025 with S$5 billion. A S$1.5 billion government injection in February 2026 lifted it to S$6.5 billion. As of 29 September 2026, MAS has allocated S$5.4 billion to 14 managers.
| Date | Managers | Amount | Cumulative |
|---|---|---|---|
| 21 July 2025 | 3 | S$1.1B | S$1.1B |
| November 2025 | 6 | S$2.85B | S$3.95B |
| 29 September 2026 | 5 (Amundi, Franklin Templeton, HSBC Asset Management, M&G, Natixis) | S$1.45B | S$5.4B |
| 2027 | Fourth batch under review | To be confirmed | To be confirmed |
The target is different from past efforts that leaned on Straits Times Index blue chips. Small and mid-caps (often called SMID) have long suffered from thin trading, limited analyst coverage and weak visibility, according to MSCI. The EQDP aims at exactly those gaps, backed by a 20% tax rebate for SGX listings, a 5% concessionary tax rate for qualifying fund managers and S$20 million in GEMS market-making support for about 80 stocks until 31 December 2028.
Eligibility rules push money into local shares. New funds must invest at least 30% in Singapore equities, while existing funds need 30% plus annual net inflows of at least 5% of prior-year assets under management (AUM). More SMID names are now reaching 5% institutional stakes, and OCBC‘s fund has grown from US$200 million to US$2 billion.
Then comes the timing problem.
The lag Outperformance has historically appeared 6-12 months after fund allocation, not right after announcements, according to Phillip Securities Research.
MAS assesses managers over at least three years, which signals patient capital rather than price support. Buying on each allocation headline means paying for the news rather than the flows, so you are better served thinking in quarters, not days.
The 6-12 month lag rewards investors who do their own small cap research on primary documents and management credibility, rather than waiting for allocation headlines to reach the share price.
When big ASX news breaks, our subscribers know first
Which sectors stand to benefit, and which are still waiting?
If the flows are slow, fundamentals decide who benefits first. Phillip Securities Research, the single source for the construction and REIT figures below, ranks the setups unevenly.
| Sector | Key driver | Key risk | Data point |
|---|---|---|---|
| Semiconductors | Upcycle since TSMC raised capex in early 2024 | Singapore earnings only starting to improve | Korean chip exports up 26.3% in September |
| Oil and gas | Capex expected to rise on high oil prices and energy security | Dependent on oil prices holding | Qualitative view only |
| Construction | Strengthening private demand; Terminal 5 and HDB BTO | High diesel costs from Middle East conflicts | Contract awards up 25% year-to-date through July |
| REITs | Valuation discount may already price in negatives | Fed rate hike fears, borrowing costs, cap-rate expansion | Down 13%, at 0.85x P/NAV |
Semiconductors offer the cleanest story. The global upcycle is more than two years old, yet Singapore firms are only now showing earnings improvement, which places local names early in the cycle. Oil and gas sits close behind on the capex argument, while construction balances strong award growth against fuel costs.
REITs are the opposite case. They trade at 0.85x price to net asset value (P/NAV), meaning the market values them below the book value of their property, because higher rates and wider capitalisation rates (the yield buyers demand on property) erode values. Some of that pain may already be priced in.
The spread tells you EQDP money is a tailwind, not a guarantee. Check each holding’s own earnings trajectory or rate exposure before assuming flows will carry it.
For investors weighing the REIT discount, our dedicated guide to evaluating Singapore REITs explains how gearing and interest coverage separate resilient trusts from vulnerable ones.
Why is bank lending growing at a record pace?
The sector picture points to real investment, and the banks confirm it. Loan growth has reached 13.5%, against 6% a year earlier, per Phillip Securities Research on September 2026 data.
Record credit demand Loan growth: 13.5% now versus 6% a year ago.
This does not contradict MAS’ Financial Stability Review figure of 6.2%, which covered the 2025 review period. The lending is concentrated in capital-heavy areas:
- Data centres and technology
- Energy and renewables
- Acquisition financing
- Manufacturing, the fastest-growing segment
Housing and consumer loans are growing at stable mid-single-digit rates. With the purchasing managers’ index (PMI, a survey gauge of business activity) at a near eight-year high, this looks like genuine real-economy demand rather than a speculative surge.
The limit sits in the profit maths. The three-month Singapore Overnight Rate Average (SORA, the benchmark for local borrowing costs) fell to 1.72% in Q3 2025 from 3.59% a year earlier, and its year-on-year turn positive mostly sustains net interest income rather than accelerating it.
Wealth-management fees do the separating. OCBC and DBS are better placed than UOB, which lags in high-net-worth client acquisition. No bank-specific net interest income or credit-quality data was available, so treat the volume headline as one input, not a proportional profit jump.
Volume-driven lending cushions net interest income only while deposit costs stay contained, and UOB has already raised promotional deposit rates.
How should you judge a strategy announcement? CDL versus Hongkong Land
Macro tailwinds lift a market. Company execution decides which shares capture it, and two property groups show the difference.
What CDL promised and where the market pushed back
CDL’s GET+ plan covers FY2027-2029. It targets S$5 billion of growth investment (60% Singapore, 30% China and Japan, 10% elsewhere) and S$6 billion of divestments. Stated goals include a dividend payout of at least 35% of PATMI (profit after tax and minority interests), net gearing (net debt relative to equity) cut from 75% to about 55%, over S$1 billion in divestment gains and AUM doubling from about S$5 billion to S$10 billion.
About 20% of its 54 hotels, worth roughly S$1.8 billion of an estimated S$8.6 billion, are earmarked for sale. Yet the shares trade near S$7 against a revalued net asset value (RNAV) of about S$15, and the plan offers no return on equity (ROE) targets and no buybacks to close that discount.
Selling S$6 billion to reinvest S$5 billion also blurs what shareholders actually receive. Reported reactions differ: verified reporting shows a fall of up to 6.3% on announcement day, while the original Phillip Securities source cited 15%, which may reflect a cumulative or later measure.
What Hongkong Land has already delivered
Hongkong Land targets at least US$4 billion of capital recycling by end-2027, and US$3.6 billion (90%) was completed or announced by early 2026. Proceeds have funded buybacks of US$200 million plus US$150 million, a roughly 30% cut in net debt and a 9% dividend rise. It has also tied CEO pay to sale targets, with a longer framework to recycle up to US$10 billion over 10 years, up to 20% for buybacks.
| Dimension | CDL GET+ | Hongkong Land |
|---|---|---|
| Timeline | FY2027-2029 | Target by end-2027; 10-year framework |
| Buybacks | None announced | US$200M plus US$150M |
| Leverage | Gearing 75% to about 55% targeted | Net debt down about 30% |
| Management incentives | Not specified | CEO pay tied to sale targets |
| Progress | Plan just launched | 90% of target done or announced |
Targets without capital-return mechanics leave a discount in place. Weight delivered actions above ambition.
What is the framework for reading fund-flow tailwinds and strategy plans?
The core idea is to separate structural flows, such as the EQDP and loan growth, from company-specific execution. Then test each for timing and specificity. Four questions do most of the work:
- Where is the money going? EQDP funds tilt towards SMID names, so a large-cap bank benefits differently from an under-covered small cap.
- How long until it shows? The 6-12 month lag and the three-year manager assessment both point to quarters, not weeks.
- Is the plan quantified? CDL set gearing and payout targets but left out ROE goals and buybacks.
- Has anything been delivered yet? Hongkong Land’s 90% completion is evidence; a fresh plan is a promise.
The key test Delivered beats announced. Give conviction to actions already taken, not targets still pending.
Be clear about the evidence limits. No analyst modelling of an unsustainable liquidity-driven rally turned up in the research, and market-wide institutional ownership data beyond the figures cited is thin, so the lag pattern is your main caution. Most headline tailwinds need a second confirming signal, such as earnings or completed buybacks, before they justify conviction.
What the flows and the plans say about Singapore’s next phase
The three threads point the same way. EQDP money is patient capital, loan growth reflects real-economy demand, and the CDL versus Hongkong Land contrast shows the market rewarding specifics over ambition.
Your watchlist is short. Track the fourth EQDP batch under review for 2027, whether SMID outperformance emerges inside the 6-12 month window, the direction of SORA and whether CDL adds capital-return details to GET+. Each will either confirm the tailwind or expose it as noise.
The decision for you is whether a holding has its second signal yet, or whether you are still paying for the headline.
This article is for informational purposes only and should not be considered financial advice. Investors should conduct their own research and consult with financial professionals before making investment decisions. Past performance does not guarantee future results. Financial projections are subject to market conditions and various risk factors.