Gold is trading near $4,126/oz, roughly 26% below its 2026 peak. Yet TD Securities still expects a fresh gold bull run extending into 2027.
That gap raises the question this analysis tries to answer: is the selling on your screen a signal about gold’s value, or noise generated by machines?
As of 7 October 2026, gold, silver and platinum are all under pressure. TD analysts Ryan McKay and Bart Melek point to heavy selling by trend-following funds, sharply rising real interest rates and a firmer US dollar. Real interest rates are bond yields after inflation is subtracted.
For anyone holding precious metals, or thinking about buying them, the key is separating short-term mechanical flows from long-term demand. Here you will see which forces look temporary, which look structural, and where TD’s case is most exposed.
What are CTAs, and why does their selling matter less than it looks?
On a price chart, the past few sessions look like capitulation. Kitco data on 7 October showed gold at about $4,126/oz, silver at $60.31/oz and platinum at $1,655/oz, with TD flagging heavy selling across all three.
The sellers behind much of that move are commodity trading advisors (CTAs). A CTA is a fund that trades futures using rules-based models rather than human judgement about the economy.
How trend-following models decide to sell
Trend-following CTAs allocate on price momentum and volatility, not macro conviction. Their process typically runs in three steps:
- Momentum signal: models build long positions when prices break out or cross moving averages.
- Trigger breach: rising real yields and a stronger dollar push prices below set thresholds.
- Forced selling: models cut or flip positions within a short window, regardless of why gold is held.
The result is heavy, concentrated selling that amplifies the move. Nothing about reserve policy or geopolitical demand has to change for it to happen.
Because CTA selling is rule-driven and algorithm-executed, simultaneous threshold breaches across funds can compound the move faster than a fundamental selloff would.
Why the selling can reverse
TD Securities’ view McKay and Melek treat CTA selling as a flow-driven, reversible headwind that is small relative to sustained official and physical demand. Once the selling is exhausted and the trend stabilises, these models can flip back to buying.
History offers a parallel. During the 2013 taper tantrum, ETF outflows and hedge fund liquidations drove sharp falls, but physical and official buyers later absorbed the selling and prices stabilised.
When you see a steep drop driven by systematic funds, the price may be reflecting model triggers rather than any change in why gold is owned. Treat it as a reading on positioning, not a verdict on fundamentals.
When big ASX news breaks, our subscribers know first
Why central banks and ETFs could keep a floor under gold
If CTAs are the loud sellers, the quieter buyers tell a different story. Start with China.
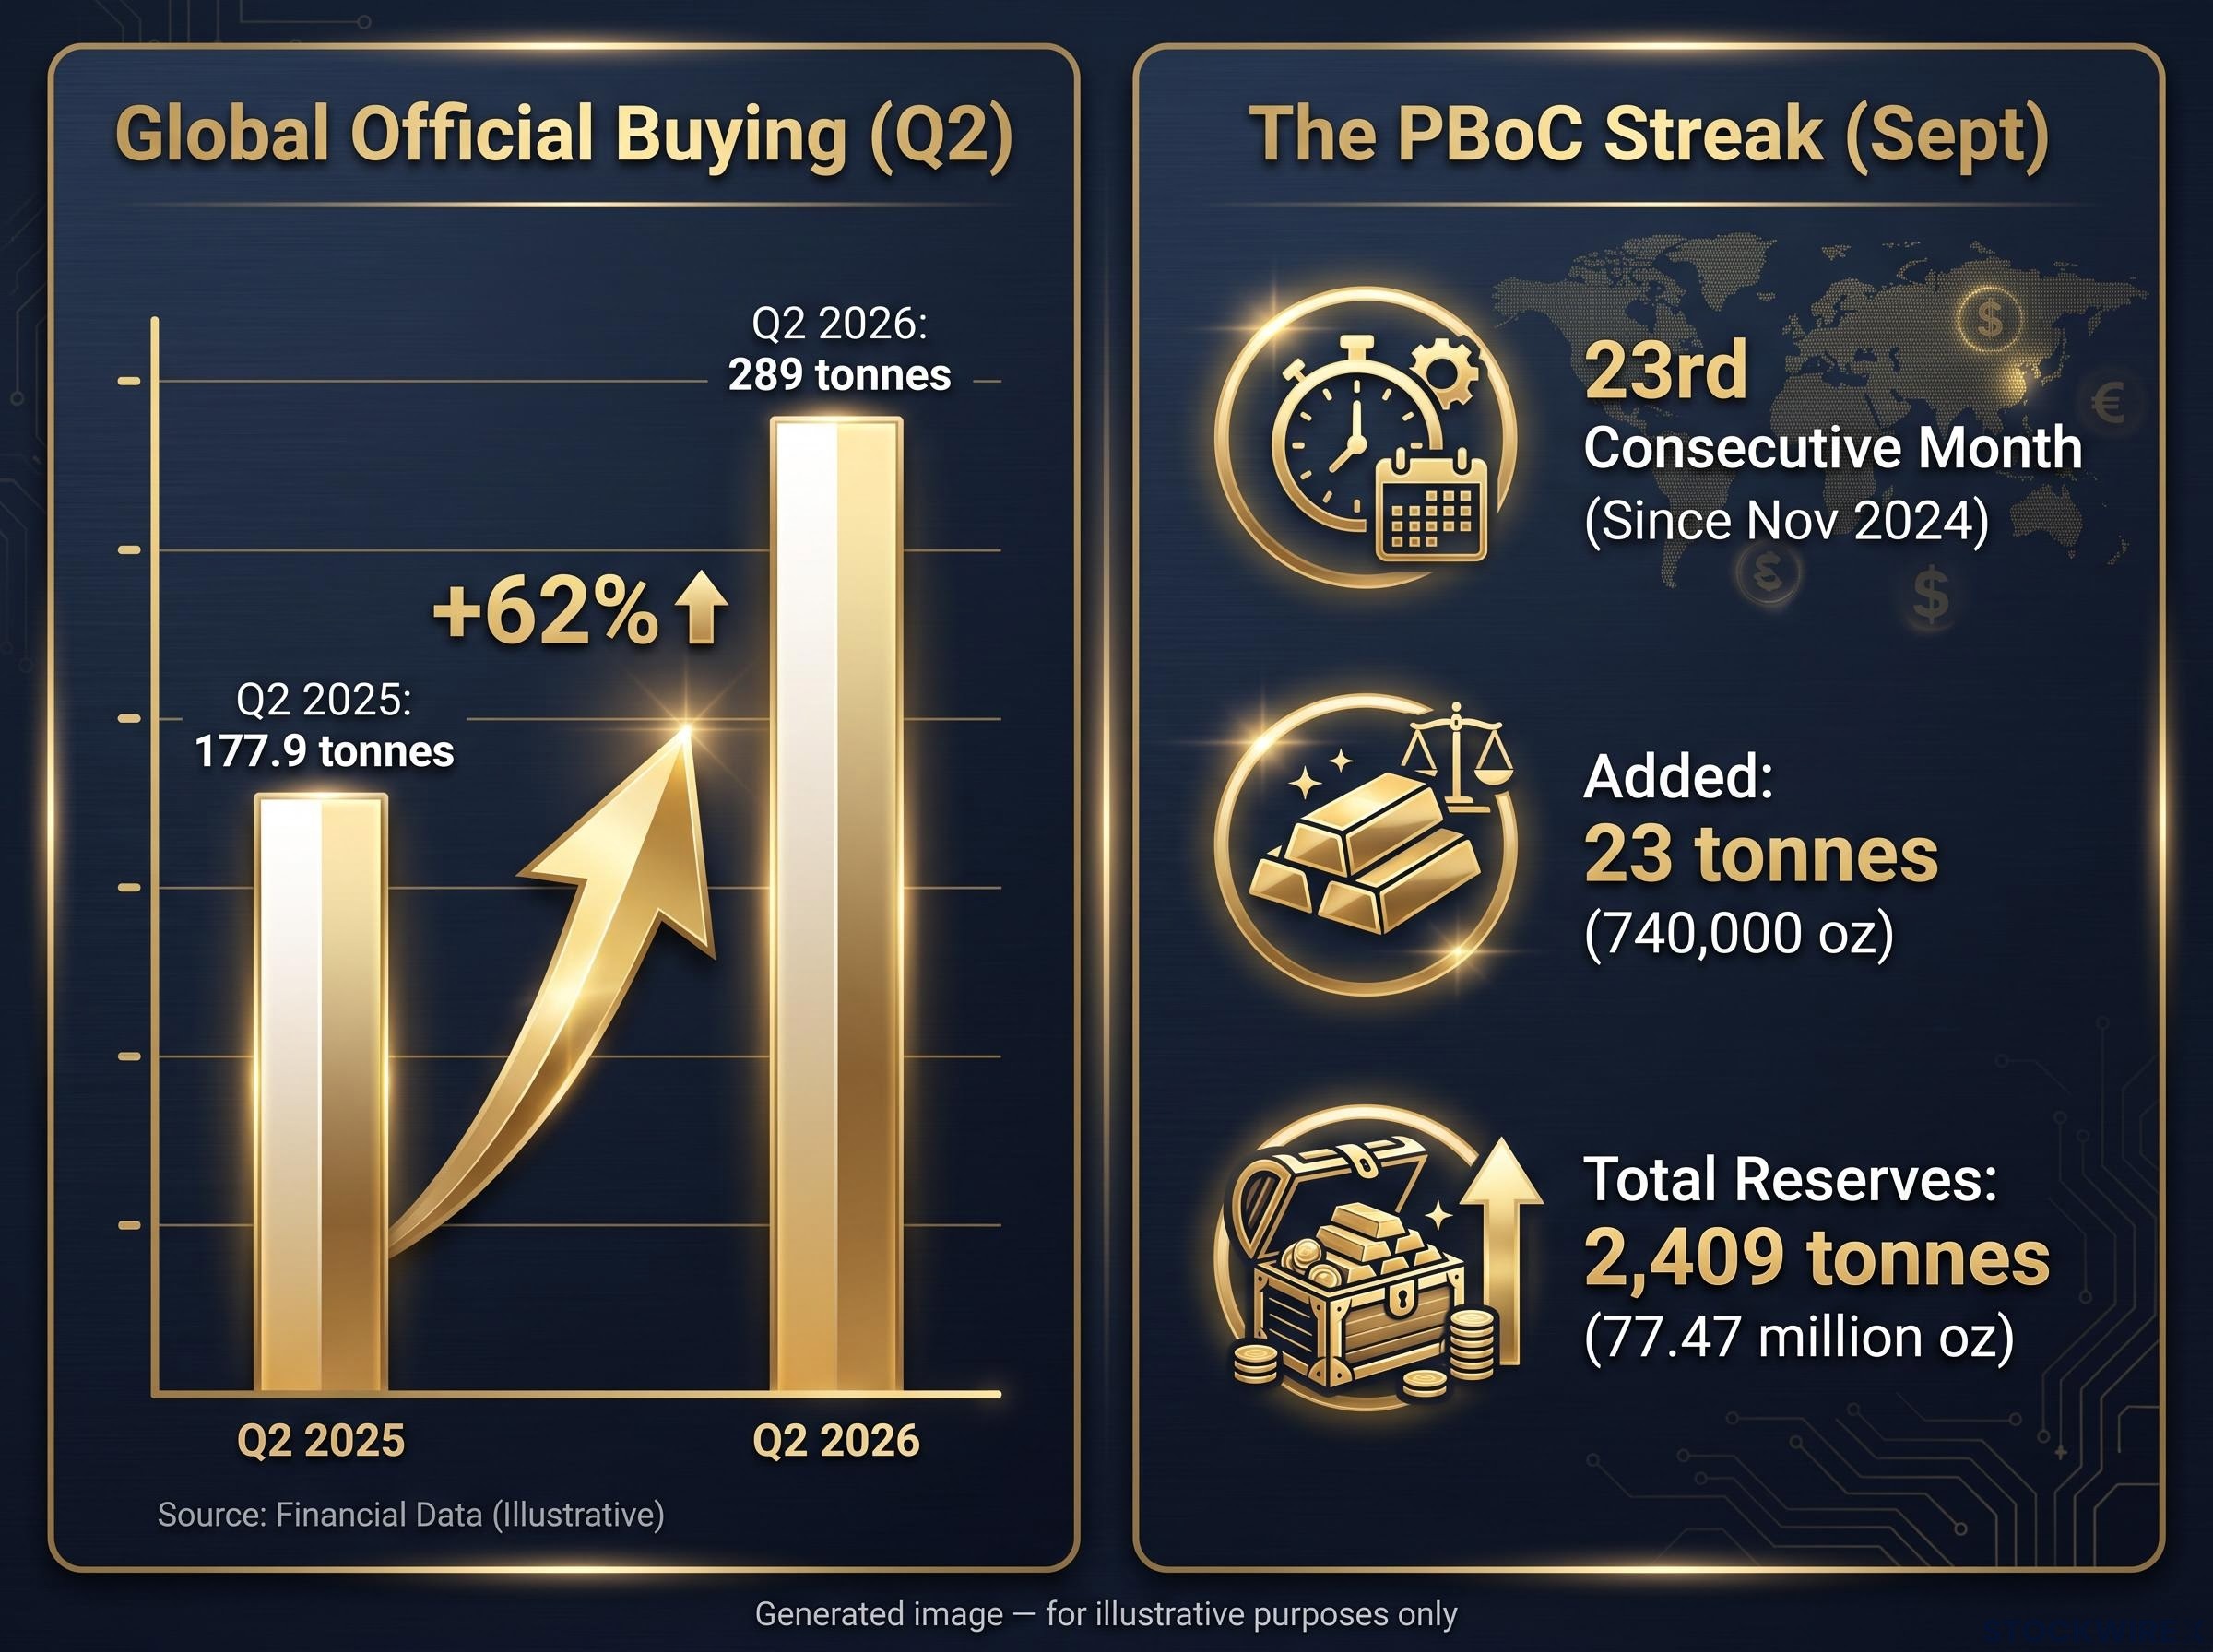
The PBoC streak The People’s Bank of China (PBoC) reported its 23rd consecutive month of gold purchases in September, adding 740,000 ounces (about 23 tonnes) and lifting reserves to 77.47 million ounces, roughly 2,409 tonnes.
The streak dates back to November 2024. China Daily Asia described September’s addition as the largest monthly increase in reserves in three years, arriving in the same month prices came under pressure.
Official buying
The wider central bank picture is larger still. World Gold Council (WGC) data show central banks added about 289 tonnes in Q2 2026, up 62% from 177.9 tonnes in Q2 2025 and a record for any second quarter.
Q1 figures need care. Earlier reports cited 244 tonnes, but later WGC materials revised this to 57 tonnes, so the higher number should not be relied on.
Intentions point the same way. The WGC’s 2026 survey found 89% of reserve managers expect global official holdings to rise over the next year, and a record 45% plan to add to their own reserves.
ETF flows
Exchange-traded funds (ETFs), which let investors hold gold through a listed security, were weaker in the second quarter. Physically backed gold ETFs saw about 45 tonnes of outflows, meaning central banks bought more than six times what ETF holders sold.
| Flow | Q2 2026 | Q2 2025 | Change |
|---|---|---|---|
| Central bank buying | 289 tonnes | 177.9 tonnes | +62% |
| Physically backed ETF flows | -45 tonnes | Not available | Net outflow |
The ETF weakness did not last. Strong Q3 inflows pushed global holdings to a record 4,256 tonnes by end-September.
TD links this demand to geopolitical risk, fiscal worries, dollar debasement, de-dollarisation and stagflation fears. Reserve managers buying for diversification are not trading on real yields, so their demand responds to different signals than speculators do. That should change how much weight you give to rate-driven selling.
The OMFIF survey found central banks are now more likely to be cutting dollar holdings than adding to them, a first on record that supports the diversification motive behind official gold buying.
Can gold really decouple from real rates?
The conventional relationship is simple. Gold pays no interest, so when real yields rise, holding it costs more in income you give up, and prices usually come under pressure.
That opportunity cost is better measured by real yields, the nominal Treasury yield minus inflation expectations, than by the headline policy rate alone.
That is exactly the headwind TD describes today. Precise current real yield and dollar index readings were not available in the research, but TD characterises real rates as surging and the dollar as firmer.
TD’s argument is that this relationship weakens from here. Kitco reported on 23 September 2026 that TD sees gold’s next leg above $5,000/oz, with targets pointing into 2027. The bank cites four drivers:
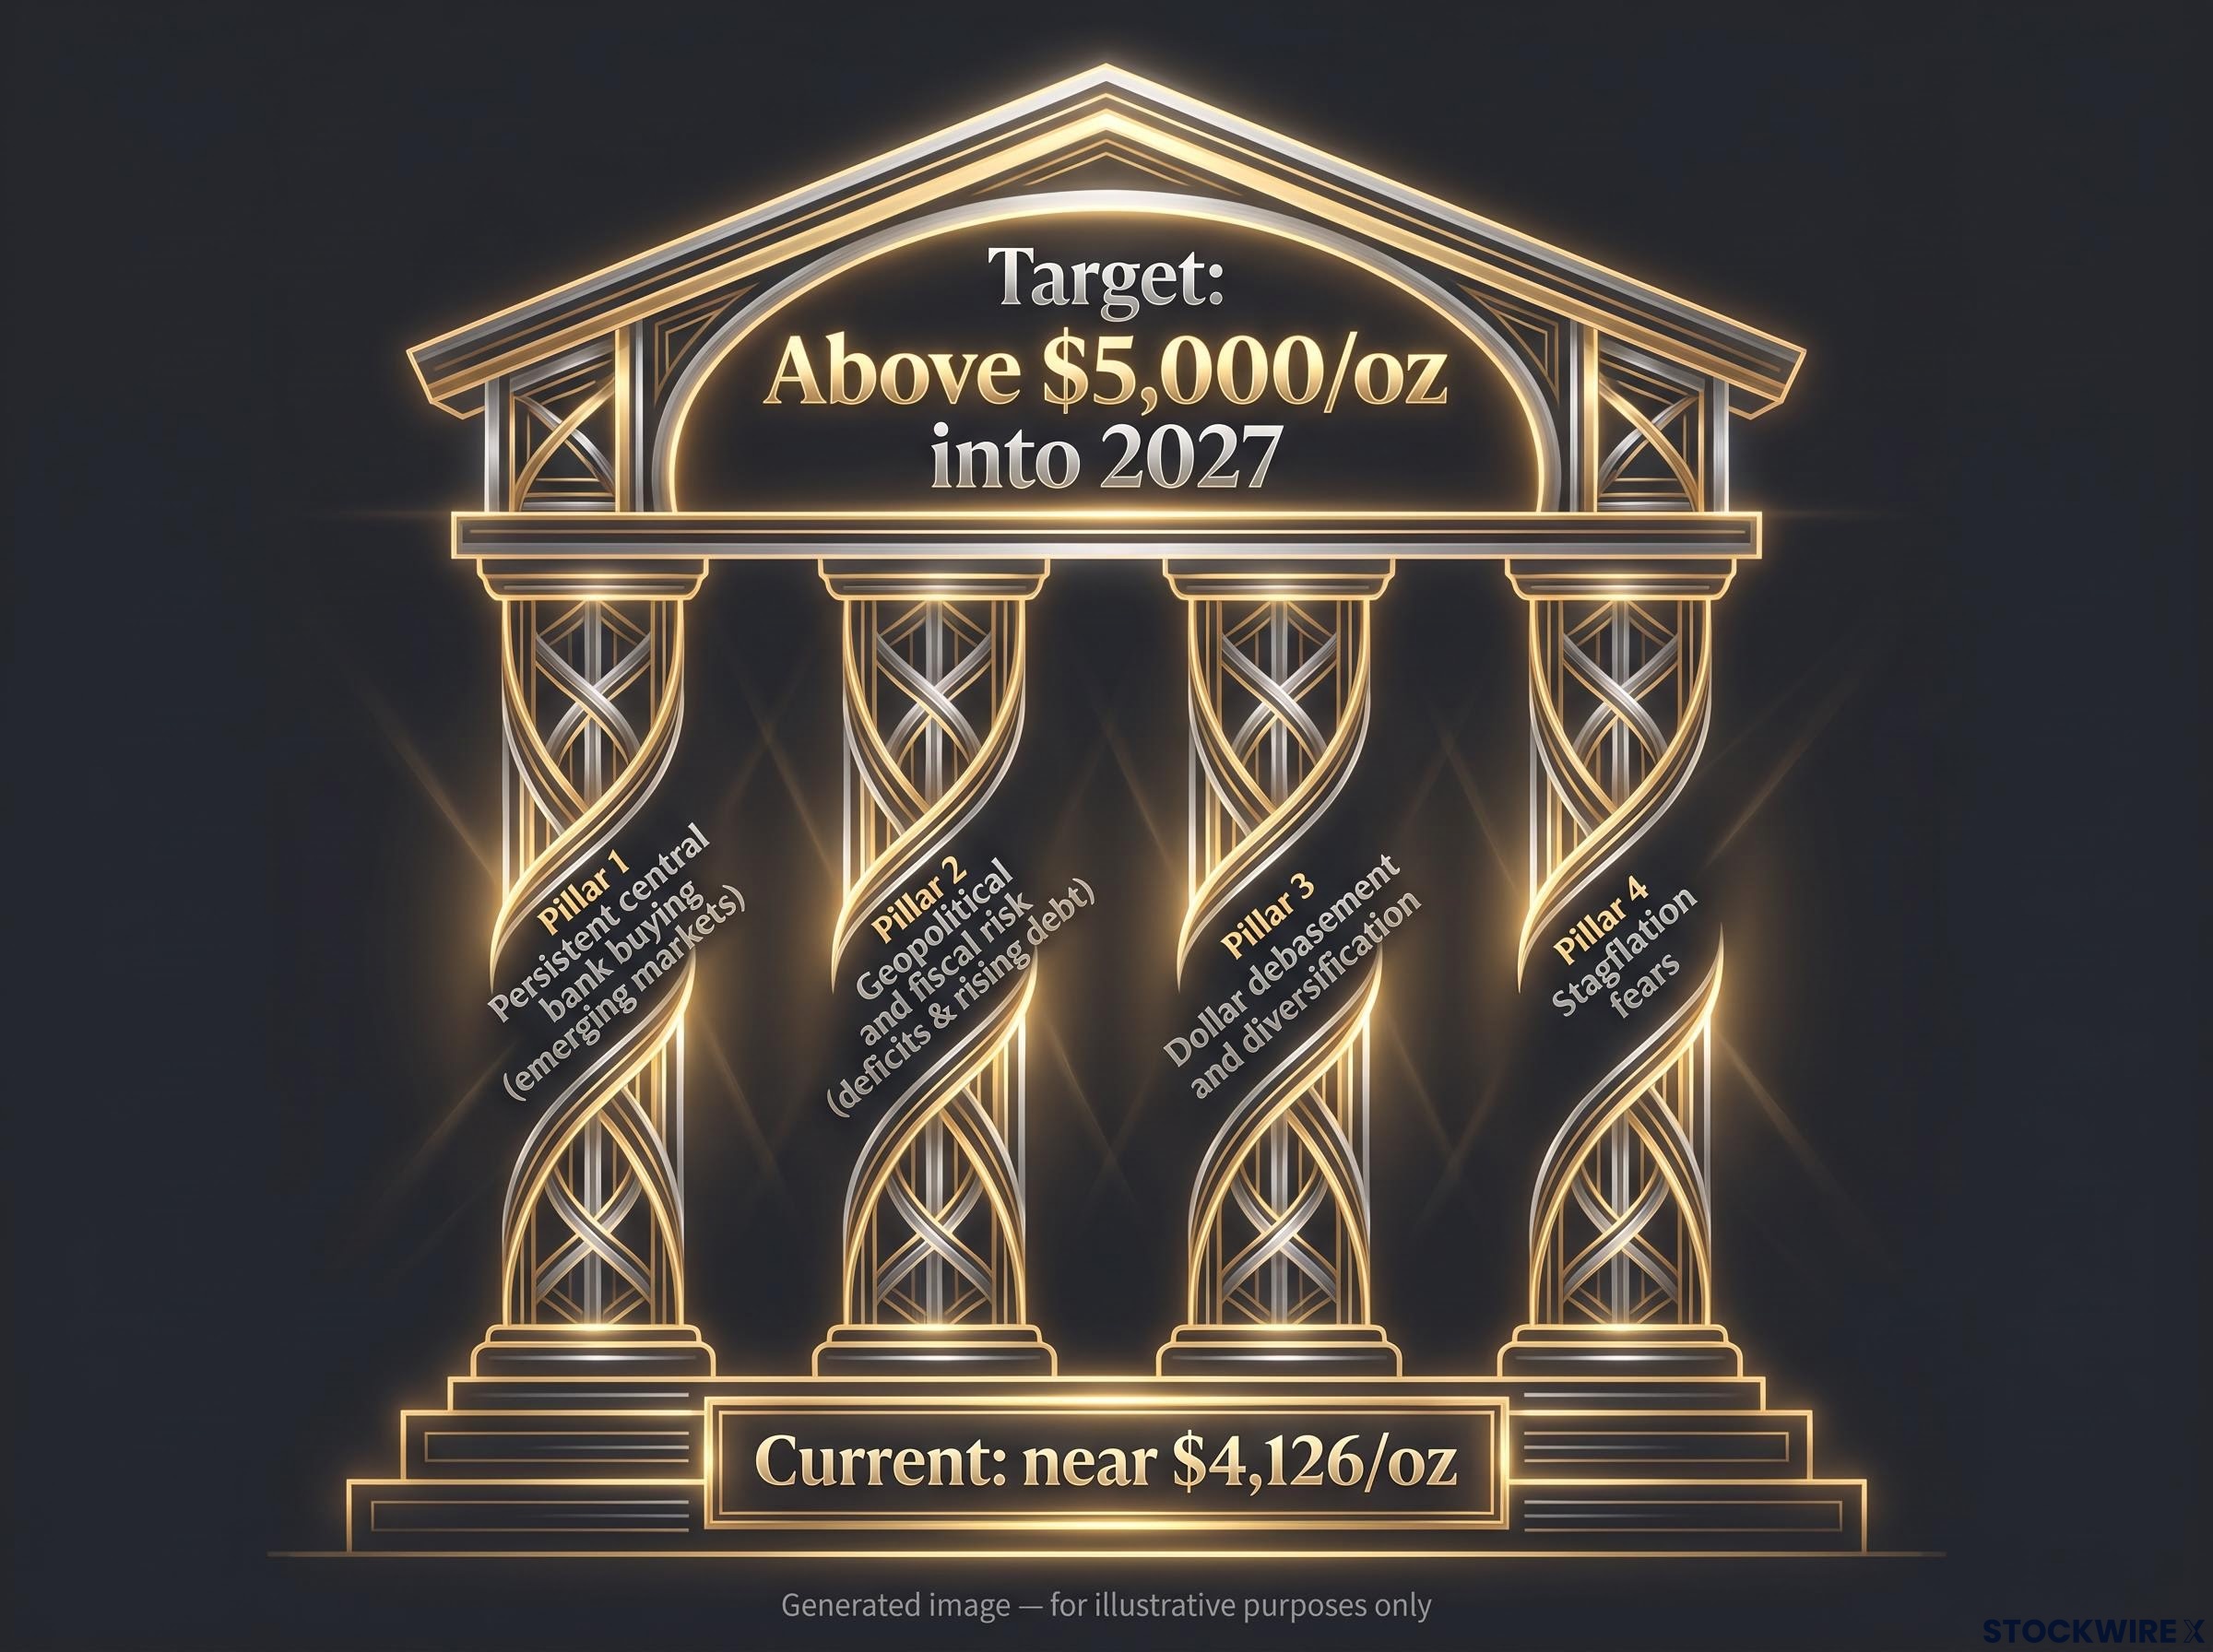
- Persistent, price-insensitive central bank buying, especially from emerging markets
- Geopolitical and fiscal risk, including deficits and rising debt
- Dollar debasement and diversification away from the dollar
- Stagflation fears
The claim is not without precedent. During the 2005-2007 commodity boom, gold rose on emerging-market demand and diversification flows even though US real yields were not especially low. In 2010-2011, gold rallied through sovereign debt crises while real yields swung and at times rose.
| Feature | Conventional rate-driven regime | Decoupling regime |
|---|---|---|
| Main driver | Real yields and the dollar | Official diversification and safe-haven demand |
| Main buyers | Speculators, ETFs, systematic funds | Central banks, physical buyers |
| Sensitivity to real yields | High | Lower, can be overridden |
Decoupling is a regime claim, not a rule. Treat rate sensitivity as one input that strong official and safe-haven demand can override, and ask whether those conditions are actually present before accepting that the usual relationship has broken.
Where the bull case is weakest: the risks and the cautious voices
TD’s conviction is clear: dip buying from discretionary traders, ETFs and central banks forms a floor, and macro risks overpower rate headwinds. Other institutions read the same data more cautiously.
Where institutions agree with TD
The WGC says the structural case remains intact, with diversification and crisis protection keeping central bank buying at scale. UBS frames gold as a long-term diversifier supported by official buying and geopolitical risk.
Where they diverge
The disagreement is over timing and magnitude, not direction.
The WGC’s measured stance The WGC expects central banks to deliver another strong year, but projects total 2026 gold demand to finish below the 2025 total.
UBS stresses that near-term performance stays sensitive to Federal Reserve policy and real yields. Business Standard notes weaker ETF and bar-and-coin investment makes the outlook more nuanced, even with gold 26% off its peak.
Ranked by how directly each threatens TD’s thesis, the main risks are:
- A slowdown in central bank buying, which would weaken the thesis’s main pillar.
- Higher-for-longer real rates and a strong dollar, raising the cost of holding gold.
- Fragile ETF sentiment. Q2’s 45 tonnes of outflows showed how quickly flows can turn, despite the Q3 record. GoldSilver.com claims 298 tonnes of ETF gold is “underwater”, a figure that has not been independently confirmed.
- Positioning unwinds, where large speculative longs exit quickly and CTAs amplify the fall.
- Price sensitivity, with high prices dampening retail bar-and-coin demand.
Strong official demand is necessary for a sustained rally, but not sufficient. Weigh the thesis against positioning and macro conditions rather than treating central bank buying as a guarantee. Forecasts are speculative and subject to change as conditions develop.
What to watch before judging the 2027 call
The evidence points to two separate forces. CTA selling is price-driven and reversible; central bank and ETF demand looks structural. Whether they combine into a sustained rally depends on real yields, the dollar and the pace of official buying.
Four variables will tell you which way it is breaking:
- PBoC monthly reserve data, and whether the streak reaches a 24th month
- Global ETF holdings against the 4,256-tonne record
- The direction of real yields and the US dollar
- WGC quarterly demand updates, especially central bank totals
Treat TD’s $5,000+ target as a scenario to monitor, not a certainty. Past performance does not guarantee future results.
Investors exploring the bull case further can read our detailed coverage of Asian physical demand and fiscal stress, including how OTC flows escape headline data.
This article is for informational purposes only and should not be considered financial advice. Investors should conduct their own research and consult with financial professionals before making investment decisions.