Most investors build a late-year ETF shortlist the same way: they collect the tickers that keep appearing in videos, forums and newsletters. That habit is understandable, and it can leave you holding four funds that all make the same bet. With fewer than three months left in 2026, choosing ETFs for Q4 2026 calls for a sharper question than “which fund is hot?”
High interest rates, stretched valuations in parts of the market and narrow leadership make a different question more useful. What does each fund actually do for you?
This analysis tests four US-listed funds against that question. SCHD covers income and quality, AIPO targets AI power infrastructure, XLG concentrates on mega-cap growth and XLI tracks industrial cyclicals. The framework comes from one investment presenter’s published view, checked against available fund data. It is not a personal recommendation.
Here is how to judge each fund by its role, its cost and the way it is most likely to disappoint you, along with a sample $10,000 split you can test against your own risk tolerance.
Why choose ETFs by portfolio role instead of by recommendation?
Online tips usually arrive one ticker at a time. Each one sounds convincing on its own, and that is the problem. A tip tells you why a fund might rise. It rarely tells you how that fund fits alongside the ones you already own.
The backdrop makes that gap more costly. Rates remain elevated, valuations look rich in some corners, the Federal Reserve outlook keeps shifting, geopolitical uncertainty persists and market leadership is concentrated in a small group of giant companies. In that environment, the presenter behind this framework argues for treating ETFs as tools with distinct jobs, some defensive and some built for growth.
The four funds here are meant to complement each other, not compete.
| Fund | Role | Expense ratio | Main risk |
|---|---|---|---|
| SCHD | Income and quality | 0.06% | Lags if mega-cap tech keeps rallying |
| AIPO | AI power infrastructure | 0.69% | Thematic volatility and concentration |
| XLG | Mega-cap growth | 0.20% | Heavy tech and mega-cap concentration |
| XLI | Industrial cyclicals | Not verified | Recession or weaker business investment |
An expense ratio is the annual fee a fund charges, shown as a percentage of the money you have invested. Even the presenter runs through several checks before buying:
- Valuation: is the fund’s underlying market priced for perfection?
- Position size: how much would a bad year cost you?
- Risk: what is the most likely failure mode?
- Overlap: does it hold the same companies as another fund?
- Existing holdings: what do you already own?
The overlap check matters most. If two of your funds do the same job, you pay twice for one exposure, and that is a bigger risk than picking the “wrong” fund.
Paying twice for one exposure is among the most common ETF portfolio mistakes, because thematic and mega-cap funds often lean on the same handful of names while charging separate fees.
When big ASX news breaks, our subscribers know first
SCHD: can quality income hold up if mega-cap tech keeps running?
The Schwab U.S. Dividend Equity ETF tracks the Dow Jones U.S. Dividend 100 Index, which screens for established US dividend payers with quality characteristics rather than chasing the highest yields. Its case does not depend on a tech crash. It works if market leadership broadens, or if investors start rewarding cash flow and profitability.
The numbers make the case look simple. The fee is 0.06%, assets sit around $108.67 billion (StockAnalysis, 24 September 2026) and the yield runs roughly 3.0-3.2%. The original source cites dividend growth of about 7% a year over five years and nearly 15 consecutive annual increases.
Performance has been uneven. The presenter reports a gain of roughly 20% over 12 months, followed by a fall of about 10% over the previous month and a half.
SCHD’s valuation and yield have both shifted after this year’s rally, with the trailing yield compressing toward 3% and the fund still trading at a discount to the S&P 500, which frames how much income you are really buying.
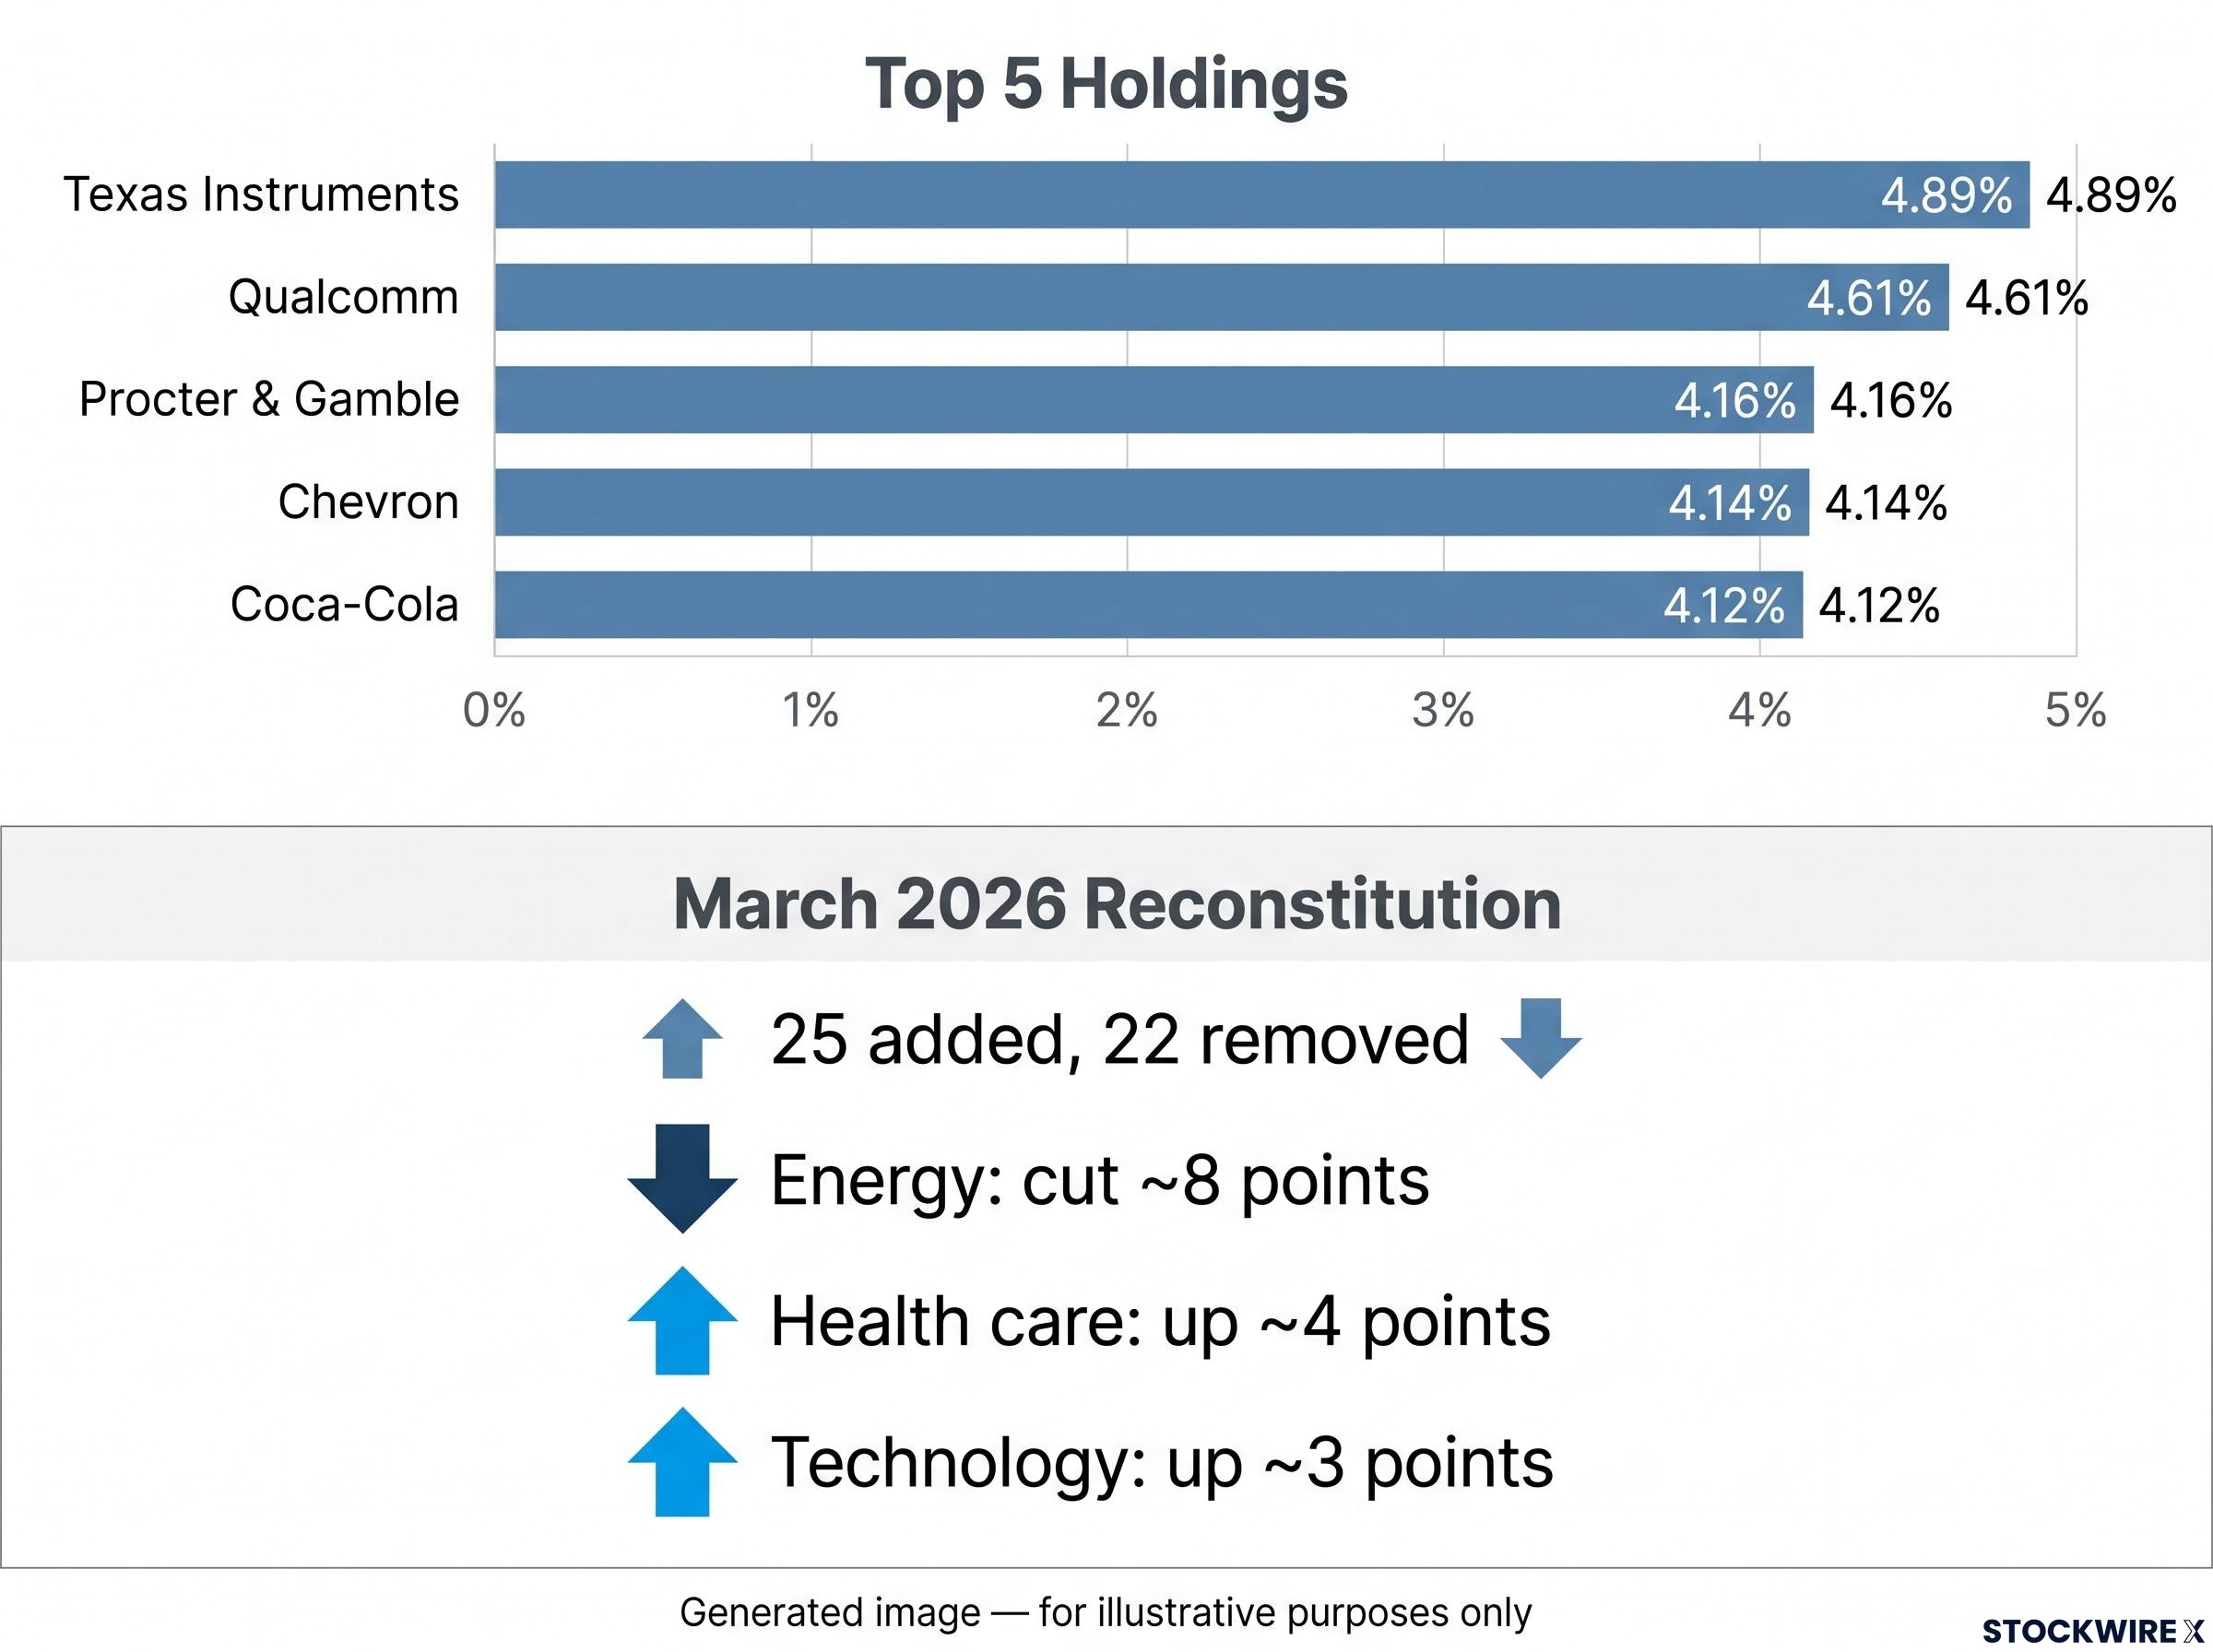
Look under the hood and the “simple dividend fund” label starts to fray. SCHD holds about 105 positions, yet the top 10 account for 41.56% of assets. The five largest:
- Texas Instruments: 4.89%
- Qualcomm: 4.61%
- Procter & Gamble: 4.16%
- Chevron: 4.14%
- Coca-Cola: 4.12%
What the March reconstitution changed
A reconstitution is the scheduled reset in which an index swaps out companies that no longer pass its rules. SCHD’s version in March 2026 was unusually large.
March 2026 reconstitution 25 added, 22 removed, about 31% turnover.
Energy was cut by about 8 percentage points, with health care up about 4 and technology up about 3. The screen mechanically dropped Cisco and AbbVie, and at least one commentator has pointed out that both went on to perform well afterwards. That is the opportunity cost of a fund that follows rules without discretion.
Reports conflict over whether UnitedHealth and Abbott were removed, but holdings data show both remained prominent. Commentary through the year has also argued that heavy turnover, which measures how much of the portfolio is replaced, can push the real cost above 0.06% through trading costs and bid-ask spreads.
For you, the read is this: SCHD is a rules-driven bet on a specific group of mature companies. It can diversify a tech-heavy portfolio, but if mega-cap tech keeps running, expect it to trail.
AIPO and XLG: how much risk sits behind the growth stories?
Where SCHD diversifies away from the AI trade, the next two funds lean into it from opposite ends. One charges a premium for a narrow theme. The other charges far less for the market’s biggest names.
AIPO, the AI power bet
The Defiance AI & Power Infrastructure ETF rests on a simple premise: AI needs more than chips. It needs electricity, grid equipment, cooling and storage. Last month the index was updated to sharpen its exposure to power generation, grid equipment and energy storage.
Holdings reflect that thesis. Quanta Services (8.64%), Eaton (8.61%), GE Vernova (8.49%) and Vertiv (6.52%) lead a top 10 worth 54.97% of assets. Industrials make up 55% of the fund, technology 21% and utilities 12%, with assets of about $925.7 million as of 10 March 2026.
The swings are sharp. As of 21 September 2026, ETFCentral data show AIPO up 31.56% year to date, down 16.37% over three months and up 0.54% over one month.
That whiplash is the price of the theme. It is why AIPO belongs as a small satellite position, not a core holding.
The 0.69% gross fee raises the hurdle further. The presenter says he usually avoids fees above 0.50%, tolerating this one because of performance, and contrasts it with ARK’s 0.75% fee, which he argues has delivered declines over some five-year stretches. Bubble warnings also persist: thematic commentators caution against over-extrapolating AI capital spending, flagging overcapacity and grid-planning delays.
XLG, the mega-cap anchor
The Invesco S&P 500 Top 50 ETF takes the opposite approach: a deliberate overweight to the 50 largest S&P 500 companies, whose size rests on large earnings and cash flow. On the presenter’s figures, which were not independently verified, it charges 0.20% and is up 12% over 12 months.
Concentration is the catch. Tech makes up 51% of the fund and communications 13%, while the top holdings, led by Nvidia, Apple, Microsoft, Amazon and Alphabet, account for about 60%. The presenter still rates it the best single-fund risk-reward, as long as earnings and cash flow keep growing.
| Measure | AIPO | XLG |
|---|---|---|
| Fee | 0.69% (gross) | 0.20% |
| Concentration | Top 10 at 54.97% | Top holdings about 60% |
| Largest sector | Industrials 55% | Technology 51% |
| Key risk | AI capex over-extrapolation, project delays | Dependence on continued mega-cap growth |
Both funds hold Nvidia, Alphabet and Broadcom, so owning the pair doubles your AI exposure more than the labels suggest.
XLI: is the pullback an entry point or a warning?
XLI’s recent slide Down 10% from its mid-August peak.
The Industrial Select Sector SPDR ETF has fallen roughly 8% over three months, according to the presenter’s data, and industrials have recently ranked among the three weakest S&P 500 sectors. Over 12 months it is still up nearly 10%.
The case for buying the dip rests on the physical side of the AI build-out. Data centres, power plants, transformers, construction, transportation and factories all need industrial suppliers. That makes XLI a broader bet on the physical economy than AIPO’s narrow power theme.
Its largest holdings:
- Caterpillar: 7%
- GE Aerospace: 6%
- GE Vernova: nearly 5%
- RTX, Deere, Eaton and Union Pacific: about 3% each
GE Vernova and Eaton also sit near the top of AIPO, so holding both funds stacks your exposure to the same grid names. The presenter recently bought XLI, but his thesis assumes capital spending stays resilient.
That assumption is the whole trade. XLI is a bet on the business cycle, so its value to you depends on your own view of recession odds. If you are very bearish on the economy, this fund is unlikely to suit you.
Industrial cycle timing is the practical lever here, and a widely cited signal is the ISM Manufacturing New Orders sub-index moving back above 50, confirmed by narrowing credit spreads and rising earnings revisions.
How could a $10,000 allocation turn these roles into position sizes?
The presenter’s hypothetical split assigns weight by risk rather than by excitement. It is a framework to test, not advice to copy.
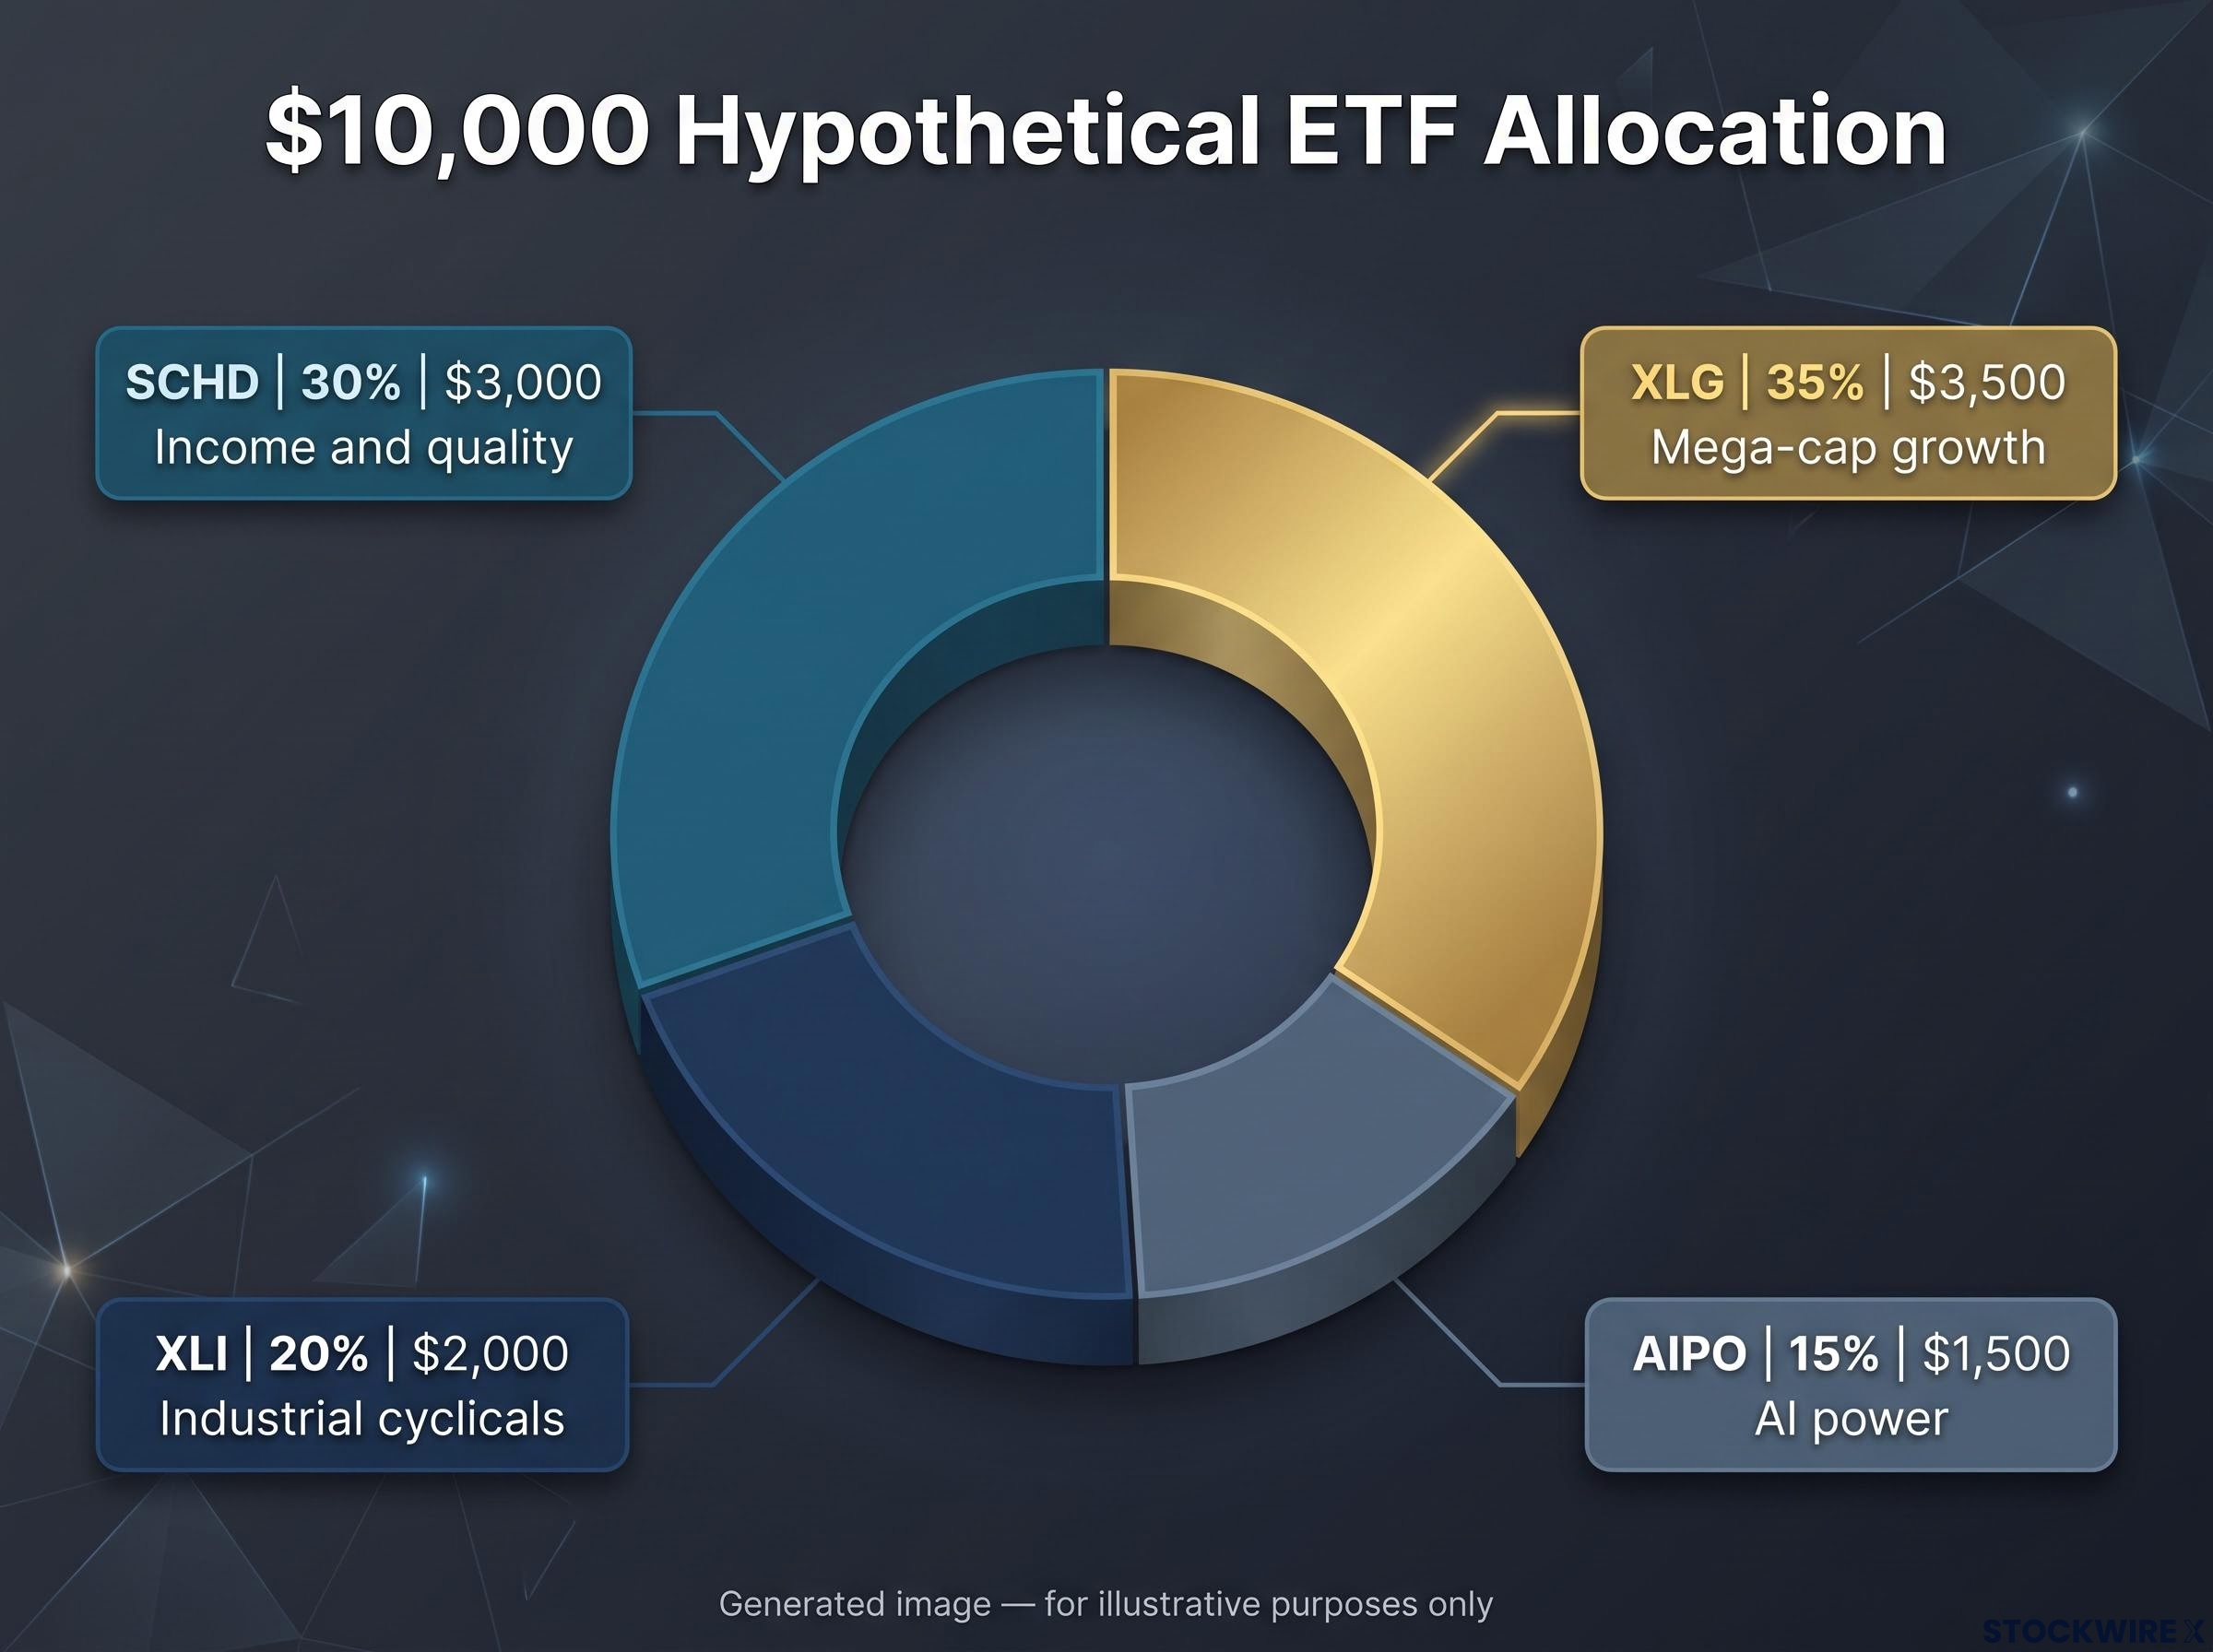
| Fund | Weight | Dollar amount | Role | Sizing rationale |
|---|---|---|---|---|
| XLG | 35% | $3,500 | Mega-cap growth | Presenter’s single pick if limited to one |
| SCHD | 30% | $3,000 | Income and quality | Low-cost diversifier away from tech |
| XLI | 20% | $2,000 | Industrial cyclicals | Cyclical exposure capped against recession risk |
| AIPO | 15% | $1,500 | AI power | Widest range of outcomes, so smallest weight |
The logic at the bottom of the table matters most. The presenter’s highest-conviction idea gets the smallest slot because high conviction does not mean high certainty, and the funds with the most upside also carry the widest outcomes.
Overlap means the headline weights understate your real exposure:
- Eaton and GE Vernova: held in both AIPO and XLI
- Nvidia, Alphabet and Broadcom: held in both AIPO and XLG
In practice, your effective bet on AI and industrials runs larger than 15% or 20% suggests. Rework the dollar figures around what you already own, your time horizon and how large a drawdown you can stomach. If your portfolio is already tech-heavy, a bigger SCHD slice may do more for you than another dollar in XLG.
Past performance does not guarantee future results. The allocation and outlooks discussed are speculative and subject to change with market developments.
What the four funds ask of you, and what they do not
Each fund earns its place by doing one job, and each carries a matching trade-off. SCHD may lag if tech keeps rallying. AIPO brings volatility and a 0.69% fee. XLG concentrates you in mega-cap tech. XLI depends on the business cycle holding up.
Keep the evidence in perspective. The allocation is one presenter’s opinion, and figures for XLG, XLI and the market backdrop come from his on-screen data rather than independent verification.
The decision sequence is what carries over to any fund. Check overlap and existing holdings first, size each position by its risk, then decide.
This article is for informational purposes only and should not be considered financial advice. Investors should conduct their own research and consult with financial professionals before making investment decisions.