
The U.S. federal government now owes roughly $40.24 trillion, and gold has just slid between 3% and 6% in a week. Many investors assume that mounting debt stress pushes gold higher in a straight line. The past fortnight shows why gold fell anyway, and why that assumption needs revising.
The pullback came as 10-year Treasury yields hovered near 5.25% and the dollar firmed, leaving spot gold around $4,140 an ounce. The metal has still had a large run.
How large depends on the source. Felix Prins, the commentator whose analysis frames much of this debate, puts gold’s one-year gain above 60%. Trading Economics shows a year-over-year rise of only about 4.5% to 6.5% as of 5-6 October 2026, which reflects a different measurement window, so the two figures should not be read as the same metric.
This piece explains how to tell technical selling apart from a real change in gold’s case. It also gives you two practical tools: a sizing range for your gold holding and a screen for how much your portfolio depends on cheap debt.
What is behind the drop: yields, the dollar and forced selling
The decline was not one event. Three separate forces stacked on top of each other:
- Yields: higher Treasury yields make a metal that pays no income less attractive to hold.
- The dollar: a stronger dollar raises the price of dollar-denominated gold for overseas buyers.
- Margin selling: leveraged traders forced to post more cash sell what they hold, which pushes prices down further.
Yields and the dollar
Reuters data shows the 10-year yield touched 5.344% before closing near 5.248%, while the 30-year traded above 5.66%. Sources disagree on the exact lookback, but these are multi-decade highs. Peter Schiff, the gold advocate, has argued that rising bond yields pull money out of metals because they raise the opportunity cost, which is the income you give up by holding gold instead of a yielding bond.
The opportunity cost that weighs on gold is better measured by real yields, the nominal Treasury yield minus inflation expectations, than by the headline Fed funds rate, which is why a 5.25% 10-year yield matters most when inflation expectations are not rising alongside it.
The currency side compounded the pressure. CNBC reported gold heading for a second straight weekly loss as the dollar set up a weekly gain, and Fawad Razaqzada of Forex.com tied the drop to a climbing dollar and elevated yields. When a weak payrolls report cut the implied odds of an October Federal Reserve hike to about 22% from roughly 70%, gold bounced briefly. Kitco data shows that bounce was quickly given back.
Crowded positioning and margin calls
A margin requirement is the cash deposit a trader must keep with the exchange to hold a futures position. When exchanges raise it, leveraged traders who cannot pay must sell, and their selling can trigger stop-loss orders placed by others.
There is recent precedent. CME Group lifted precious-metal margins on 31 December 2025 and again on 2 February 2026, when spot gold fell 6.1% to $4,565.79 after a one-day drop of more than 9%, and silver tumbled 12% after a record 27% plunge. Prins also warns that during such cascades the paper price can drift away from the price of physical metal.
| Source | Date | Gold | Silver | Note |
|---|---|---|---|---|
| Reuters | 2 October 2026 | $4,140.06 | Not stated | About -3.4% for the week |
| Kitco NewsWire | 2 October 2026 | $4,142.00 | $60.23 | Late U.S. trading |
| CNBC | 2 October 2026 | Not stated | $60.17 | Silver down about 1.1% |
| Trading Economics | 5 October 2026 | $4,139.50 | Not stated | About -6.03% weekly, longer window |
The gap between the 3.4% and 6% readings is a matter of timing, with Trading Economics capturing extra selling through 5 October. For you, the larger point is that much of this move reflects positioning and rate competition, both of which can reverse. It does not show a collapse in the reasons people own gold.
When big ASX news breaks, our subscribers know first
Why gold has fallen at the start of crises before rallying
Gold is often sold hardest at the moment fear peaks. That looks backwards for a safe haven, but the logic is about liquidity rather than conviction.
Gold trades easily, is centrally cleared and is widely used as collateral. When a sudden shock hits and margin calls arrive, funds sell whatever they can sell quickly, and gold sits near the top of that list. The February 2026 CME episode showed leverage temporarily overpowering the safe-haven story.
Gold’s safe haven protection has failed before in acute liquidity squeezes such as March 2020, when forced liquidation, rising real yields and a stronger dollar all hit at once, the same combination now visible in the current pullback.
History offers two episodes that Prins cites.
| Episode | Initial move | Subsequent move | Trigger context | Caveat |
|---|---|---|---|---|
| 1973-74 | Stalled and fell | About $100 to $850 through the 1970s (roughly 8x) | Stock market collapse | No detailed drawdown path found |
| 2008 | Fell about 30% | Roughly tripled over 2008-2011 | Financial panic, then money printing | Recovery tied to policy response |
In both cases the early weakness came first and the larger move followed once policy shifted. The research found no further quantified recovery paths beyond these headline figures.
A pattern, not a promise Prins himself concedes the past pattern does not guarantee repetition. Past performance does not guarantee future results.
He also frames very high price targets of $10,000 to $50,000 as a reflection of the ratio of paper money to real money, not a forecast. In his telling, gold does not rise so much as the dollar falls.
This tells you that a sharp early drop in gold has precedent and does not by itself signal the hedge has failed. It also offers no timetable, and no assurance, of a recovery.
Inflation erosion, financial repression and the debasement case explained
The long-term argument for gold starts with a simple question: what happens to the buying power of your cash over time? Three terms do most of the work here.
- Currency debasement: a fall in the value of money, usually because more of it is created faster than the economy grows.
- Inflation erosion: the gradual loss of what each dollar can buy as prices rise.
- Financial repression: government policy that keeps interest rates below inflation, so the real value of public debt shrinks over time.
The arithmetic of slow loss At 5% annual devaluation, the purchasing power of a dollar halves in about 10 years.
The U.S. has done this before. Research from Carmen Reinhart and M. Belen Sbrancia, along with IMF work, documents how post-war advanced economies, including the U.S., held rates under inflation to erode real debt, steering savers into bonds and deposits at capped returns. Real assets such as gold historically benefited.
Today’s numbers explain why the idea resurfaces. Federal debt is about $40.24 trillion, up roughly $2.36 trillion in a year, with about $32.4 trillion held by the public. M2, a broad measure of money supply, reached about $23.34 trillion in August 2026, up about 5.7% year over year.
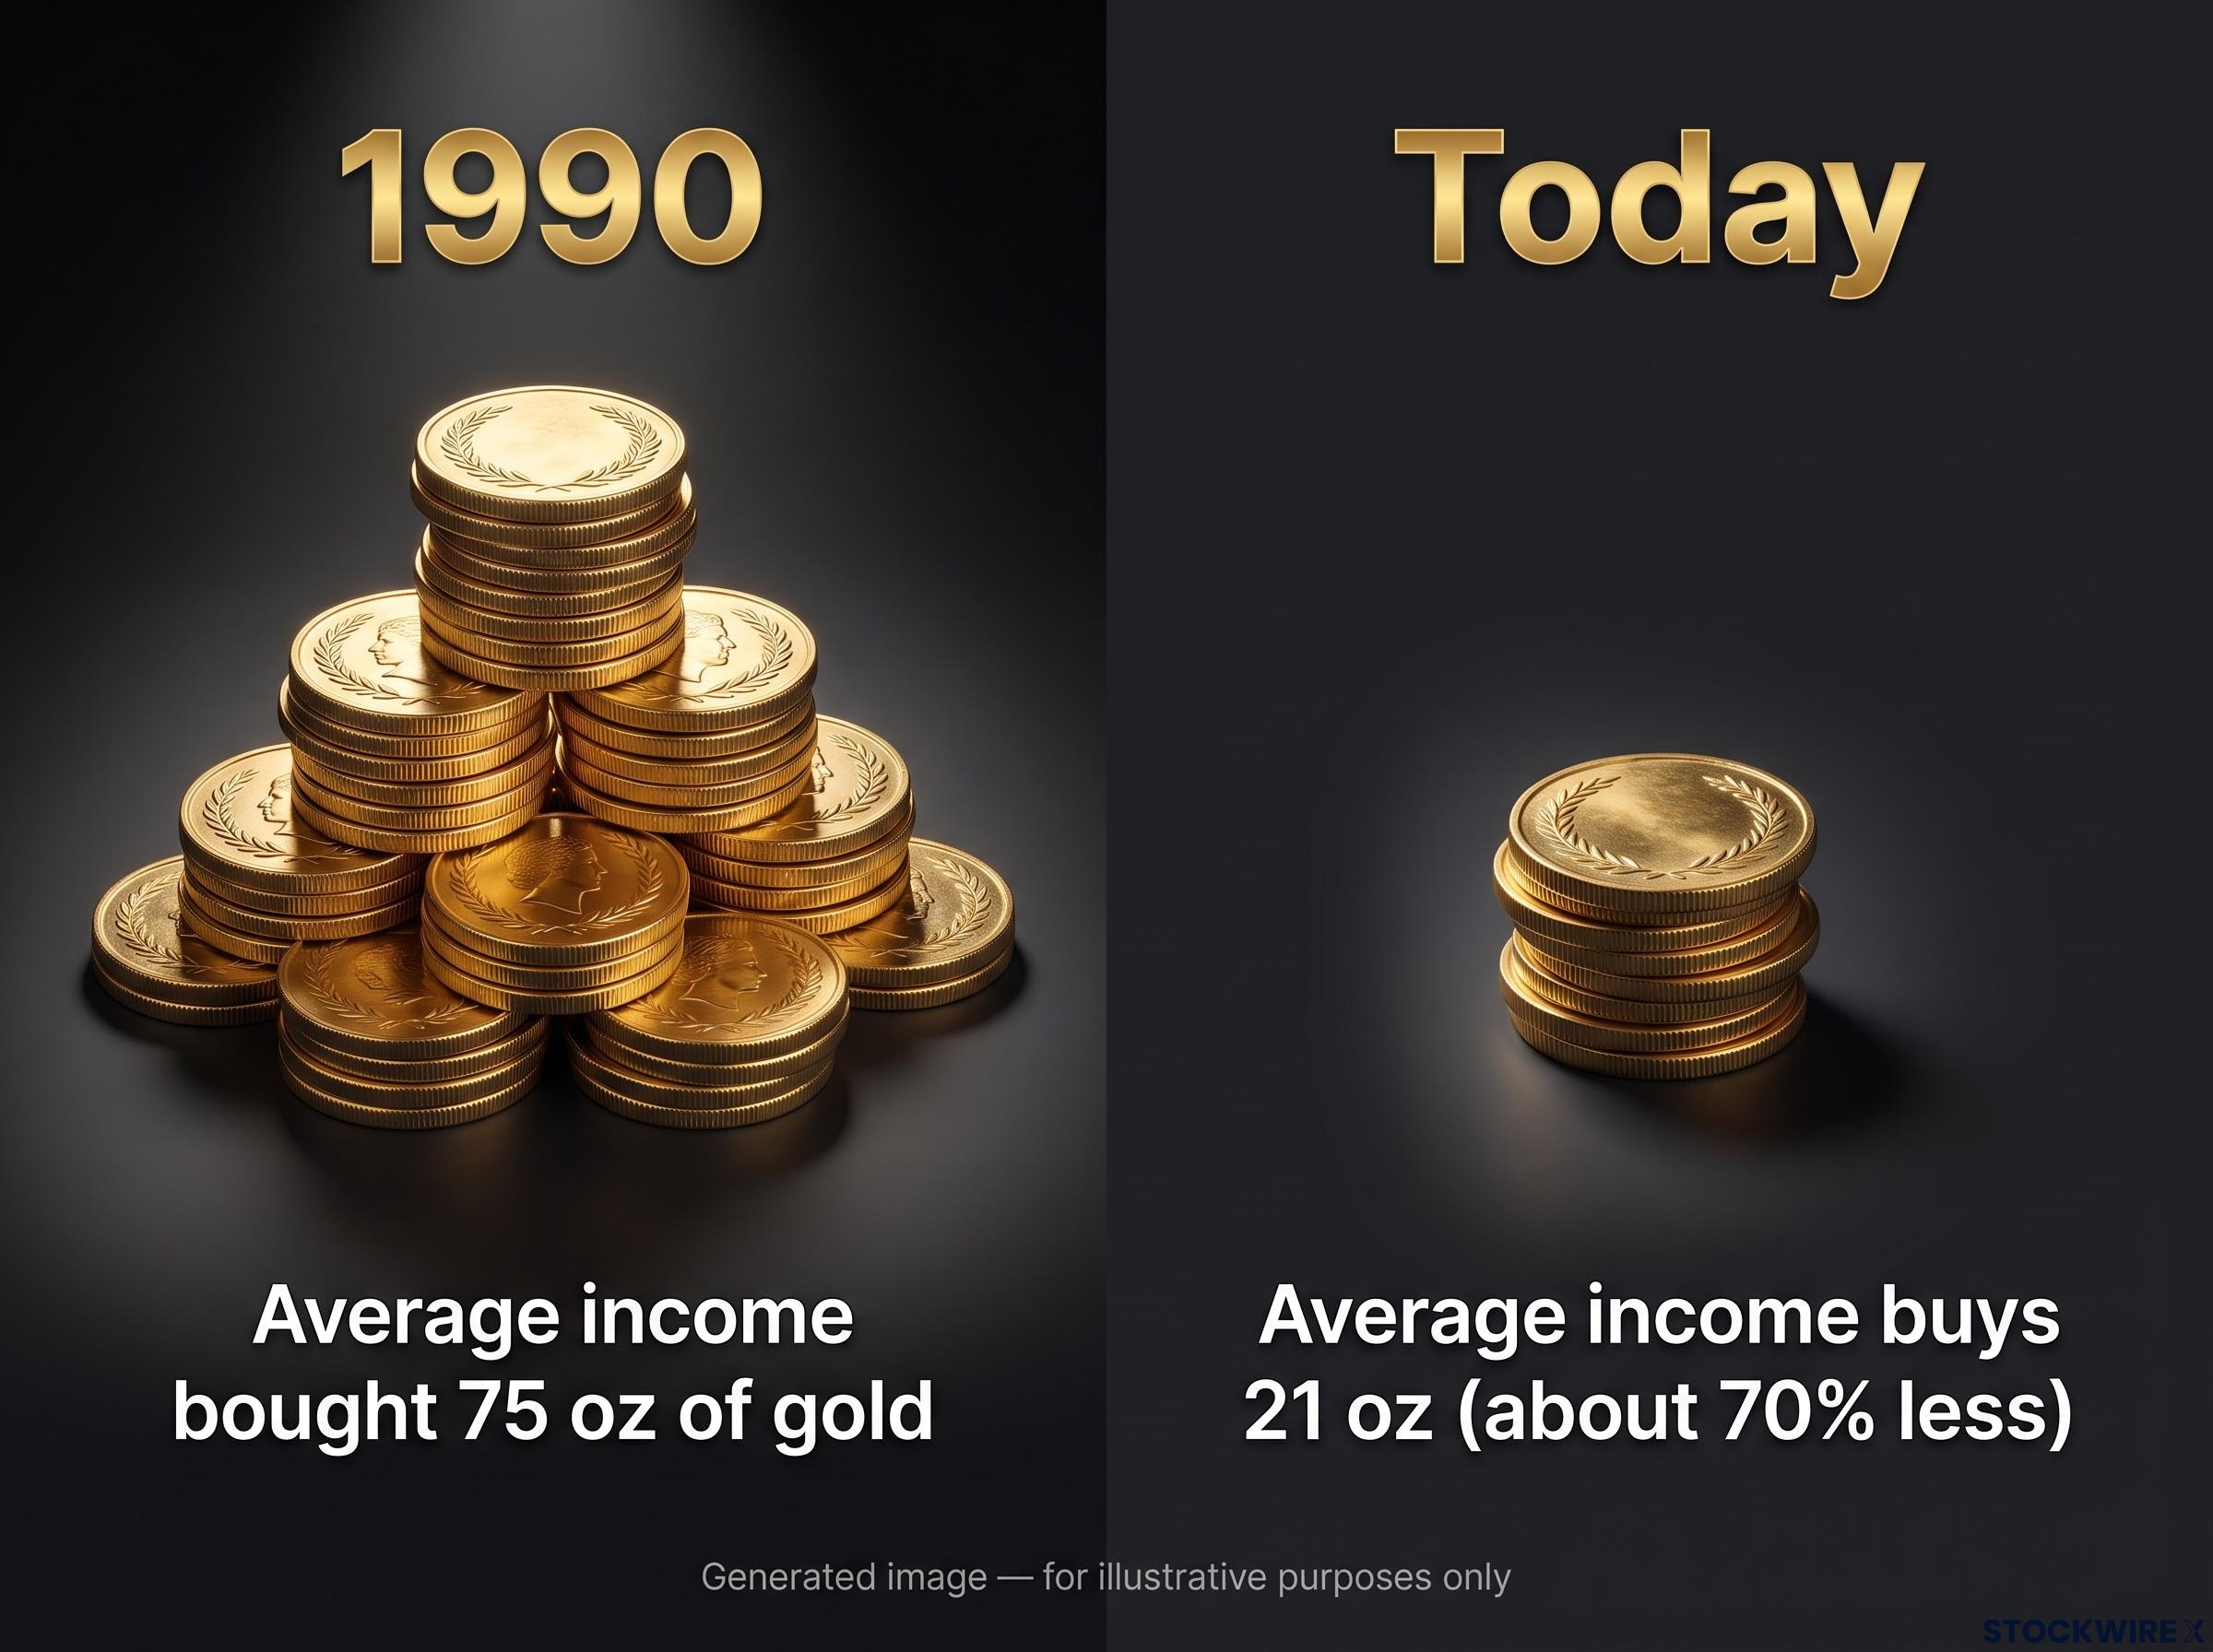
Prins claims average income bought 75 oz of gold in 1990 versus 21 oz today, about 70% less. He also predicts financial repression will be prominent in 2027, which is his opinion rather than an established outlook.
Where the debasement argument is contested
The present differs from the post-war era in one key way: yields are high, not capped. Some economists argue that not all monetary expansion is debasement, and that persistently high real yields alongside conservative central bank balance sheets weaken the runaway case.
Source bias matters too. Prins says official inflation figures are politically adjusted and promotes his institute’s “hours of work” index, which he says rose from 100 in 2000 to 341 by August 2026, but he also sells products tied to this view.
For you, the point is that rising debt and growing money supply leave cash and nominal bonds most exposed to slow purchasing-power loss. That is the real case for holding some gold, and it is not a prediction of any price.
How to size gold and screen your portfolio for debt dependence
This week’s price is the least useful input to your gold decision. Two questions matter more: how much volatility you can hold through, and how exposed the rest of your portfolio is to expensive debt.
Sizing the gold sleeve
The ranges below are commonly cited, though the research flags both institutional figures as not independently confirmed.
| Framework | Typical range | Best for | Caveat |
|---|---|---|---|
| World Gold Council guidance | About 2-10% | Strategic diversification | Range reportedly varies by risk tolerance; unverified |
| All-weather style frameworks | Often 5-10% | Persistent, modest hedge | Unverified figure |
| Drawdown tolerance test | Whatever survives a 30% fall | Behavioural discipline | Personal, not a formula |
Prins’s advice is not to panic sell, to cut exposure if losses cost you sleep, and to size for 30% swings. With 3-6% weekly drops having just occurred, that test is no longer theoretical.
Screening for cheap-debt dependence
High rates do not only weigh on gold. They also expose companies that survived on cheap borrowing.
- Decide your gold sleeve using the 30% drawdown test.
- Check each holding’s interest coverage, which is operating income divided by interest costs. A ratio barely above one is a warning sign.
- Look for refinancing risk: debt maturing soon that may roll over at much higher rates.
- Review sector concentration in commercial real estate, highly leveraged retail and speculative-grade industrials, which the research identifies as showing weakening coverage.
The link back to gold is conditional. If high rates stress over-levered borrowers and prompt easing or repression-style policy, conditions could turn supportive for gold, but that is a possibility, not a forecast. Weigh it against yield competition, dollar strength, paper-versus-physical divergence and a possible slowdown in central bank buying, a risk that remains unverified. Treat Prins’s free report, live session and app as promotional offers.
Central bank buying has been the steadiest source of structural demand for over a decade, which is why a possible slowdown in purchases is a more meaningful risk to the long-term case than any single week of price weakness.
What this pullback changes, and what it does not
The evidence points to a sharp correction driven by multi-decade-high yields, a firmer dollar and forced selling. The structural argument about debt and purchasing power is untouched, though history offers precedent rather than a guarantee.
Three variables deserve your attention from here: whether the 10-year yield holds near 5.25%, the direction of the dollar, and the risk of Fed tightening in December. A retreat in yields would weaken the main force behind the selling.
Analysts who studied earlier episodes of gold strength alongside a weaker dollar and rising yields found that yield direction, rather than yield level, was the variable that separated a sentiment-driven rally from a lasting debasement regime.
Your decision rests on two practical moves: sizing gold so a 30% fall would not force you out, and screening your other holdings for dependence on cheap debt. Both are risk management, not market calls.
This article is for informational purposes only and should not be considered financial advice. Investors should conduct their own research and consult with financial professionals before making investment decisions. Forward-looking statements are speculative and subject to change based on market developments.