A single $8.63 million call purchase landed on SpaceX (SPCX) after the stock jumped about 7.6%, and it looks like conviction. Yet the contract has roughly a 1 in 5 chance of finishing in the money. That gap is the reason SpaceX options flow deserves a sceptical read before anyone copies it.
SPCX trades near $171, about 27% above its $135 IPO price and about 24% below its June high near $225.64. Earnings are expected on 3 November, so where each strike sits relative to that date matters. All trade figures come from one options segment (Tasty Live’s Signal Versus Noise) and are not independently confirmed.
This piece gives you a practical way to judge whether big call prints carry information, and shows what a defined-risk alternative looks like.
What the breakout and the two call trades actually show
SpaceX shares rose about 7.6% on Monday, escaping a multi-week range after a two-day run. IV rank, which compares current implied volatility with its own past range, sits at 10.7, which the presenter described as cheap.
Two bullish trades surfaced. They relate to earnings in opposite ways.
| Strike/Expiry | Premium | Days to expiry | Implied volatility | Odds of finishing in the money |
|---|---|---|---|---|
| 30 October, $172.50 call | **$8.63M** | **25** | **44%** | About **1 in 5** |
| 20 November, $225 call | **$278,000** | **46** | **56%** | About **1 in 7** |
The October trade was bought at the ask, meaning the buyer paid the seller’s asking price. Volume reached about 29,763 contracts against open interest (contracts already outstanding) of just 57.
Key figure: Volume ran at roughly 59x the strike’s prior open interest, which points to fresh positioning.
The November order sits about 34% above the current price. About two-thirds was swept across exchanges, and it was also bought at the ask. The presenter cited a second volume figure for the October trade (about 15,200 against 22,000 open interest) that is not reconciled with the first.
The October call expires before earnings, so the buyer needs momentum to persist for 25 days with no results to help. What that tells you is that this is a short-term momentum bet, not a view on SpaceX’s business. The late-June swing high at $172.40 sits almost on top of the $172.50 strike, a plausible resistance zone.
Structural forces such as forced index buying and staggered insider unlocks can drive price behaviour independent of fundamentals, which is one reason a pullback from the June high does not settle the valuation question.
The November trade survives earnings and aims at the June record. Which one is more informative? The next section gives you the tools to judge.
When big ASX news breaks, our subscribers know first
How do you read unusual options flow without fooling yourself?
On a screen, the signal looks simple: a huge bullish print. The mechanics behind it are less tidy, and per Cboe Options Institute and Options Clearing Corporation (OCC) educational material, each element has limits.
- Volume versus open interest. Volume far above open interest often signals new positions, as with 29,763 contracts against 57. It does not reveal whether they are long, short, directional or hedges.
- Execution. Trades at the ask are usually read as aggressive buying, and sweeps across exchanges suggest urgency. Spread or complex orders can make the tape misleading.
- Opening versus closing. Next-day open interest settles the question. A rise indicates opening trades; flat or lower suggests closing.
- Hedge versus directional. A large out-of-the-money call may be part of a collar or a hedge against event risk.
- Context. Unusual flow is one input, not a standalone signal.
Retail traders often mistake complex institutional strategies for simple bullish bets. A headline print raises a question but does not answer it, so wait for open interest confirmation before assuming anyone is truly long.
What this flow cannot tell you
It cannot show intent, portfolio context or whether the buyer is hedged elsewhere. A bought-at-the-ask label is suggestive, not proof, and “smart money” tags deserve doubt for that reason.
Strikes, implied volatility and the earnings date: why the odds look so different
Probability follows structure. The October $172.50 strike is almost at the money, but it has only 25 days, and earnings fall after expiry. The November $225 strike is about 34% away, so even with extra time it needs a far bigger move.
The odds: About 1 in 5 for the October call and about 1 in 7 for the November call.
Two volatility readings can both be true. IV rank of 10.7 describes the stock’s implied volatility against its own history, while 44% and 56% are the levels priced into those specific contracts. A stock can sit low in its own range while particular options still carry meaningful premium.
Two readings can look contradictory until you separate them: implied volatility is priced per contract and strike, while IV rank only places the stock’s current level against its own history.
Implied volatility often rises into earnings and drops afterwards, an effect traders call IV crush. Long-premium positions can lose value even when the stock moves the right way. The 3 November date is “expected” only, with no public confirmation found.
What you would need to believe:
- October $172.50: The stock clears $172.40, holds above $172.50, and keeps climbing within 25 days without an earnings catalyst.
- November $225: SpaceX returns to its June high by 20 November, and any earnings volatility works in the buyer’s favour.
A rally alone does not guarantee profit, because time decay and IV crush can still bite. Judge a call by its breakeven and odds, not by the direction of the view.
Wide analyst targets, a defined-risk spread and the case for caution
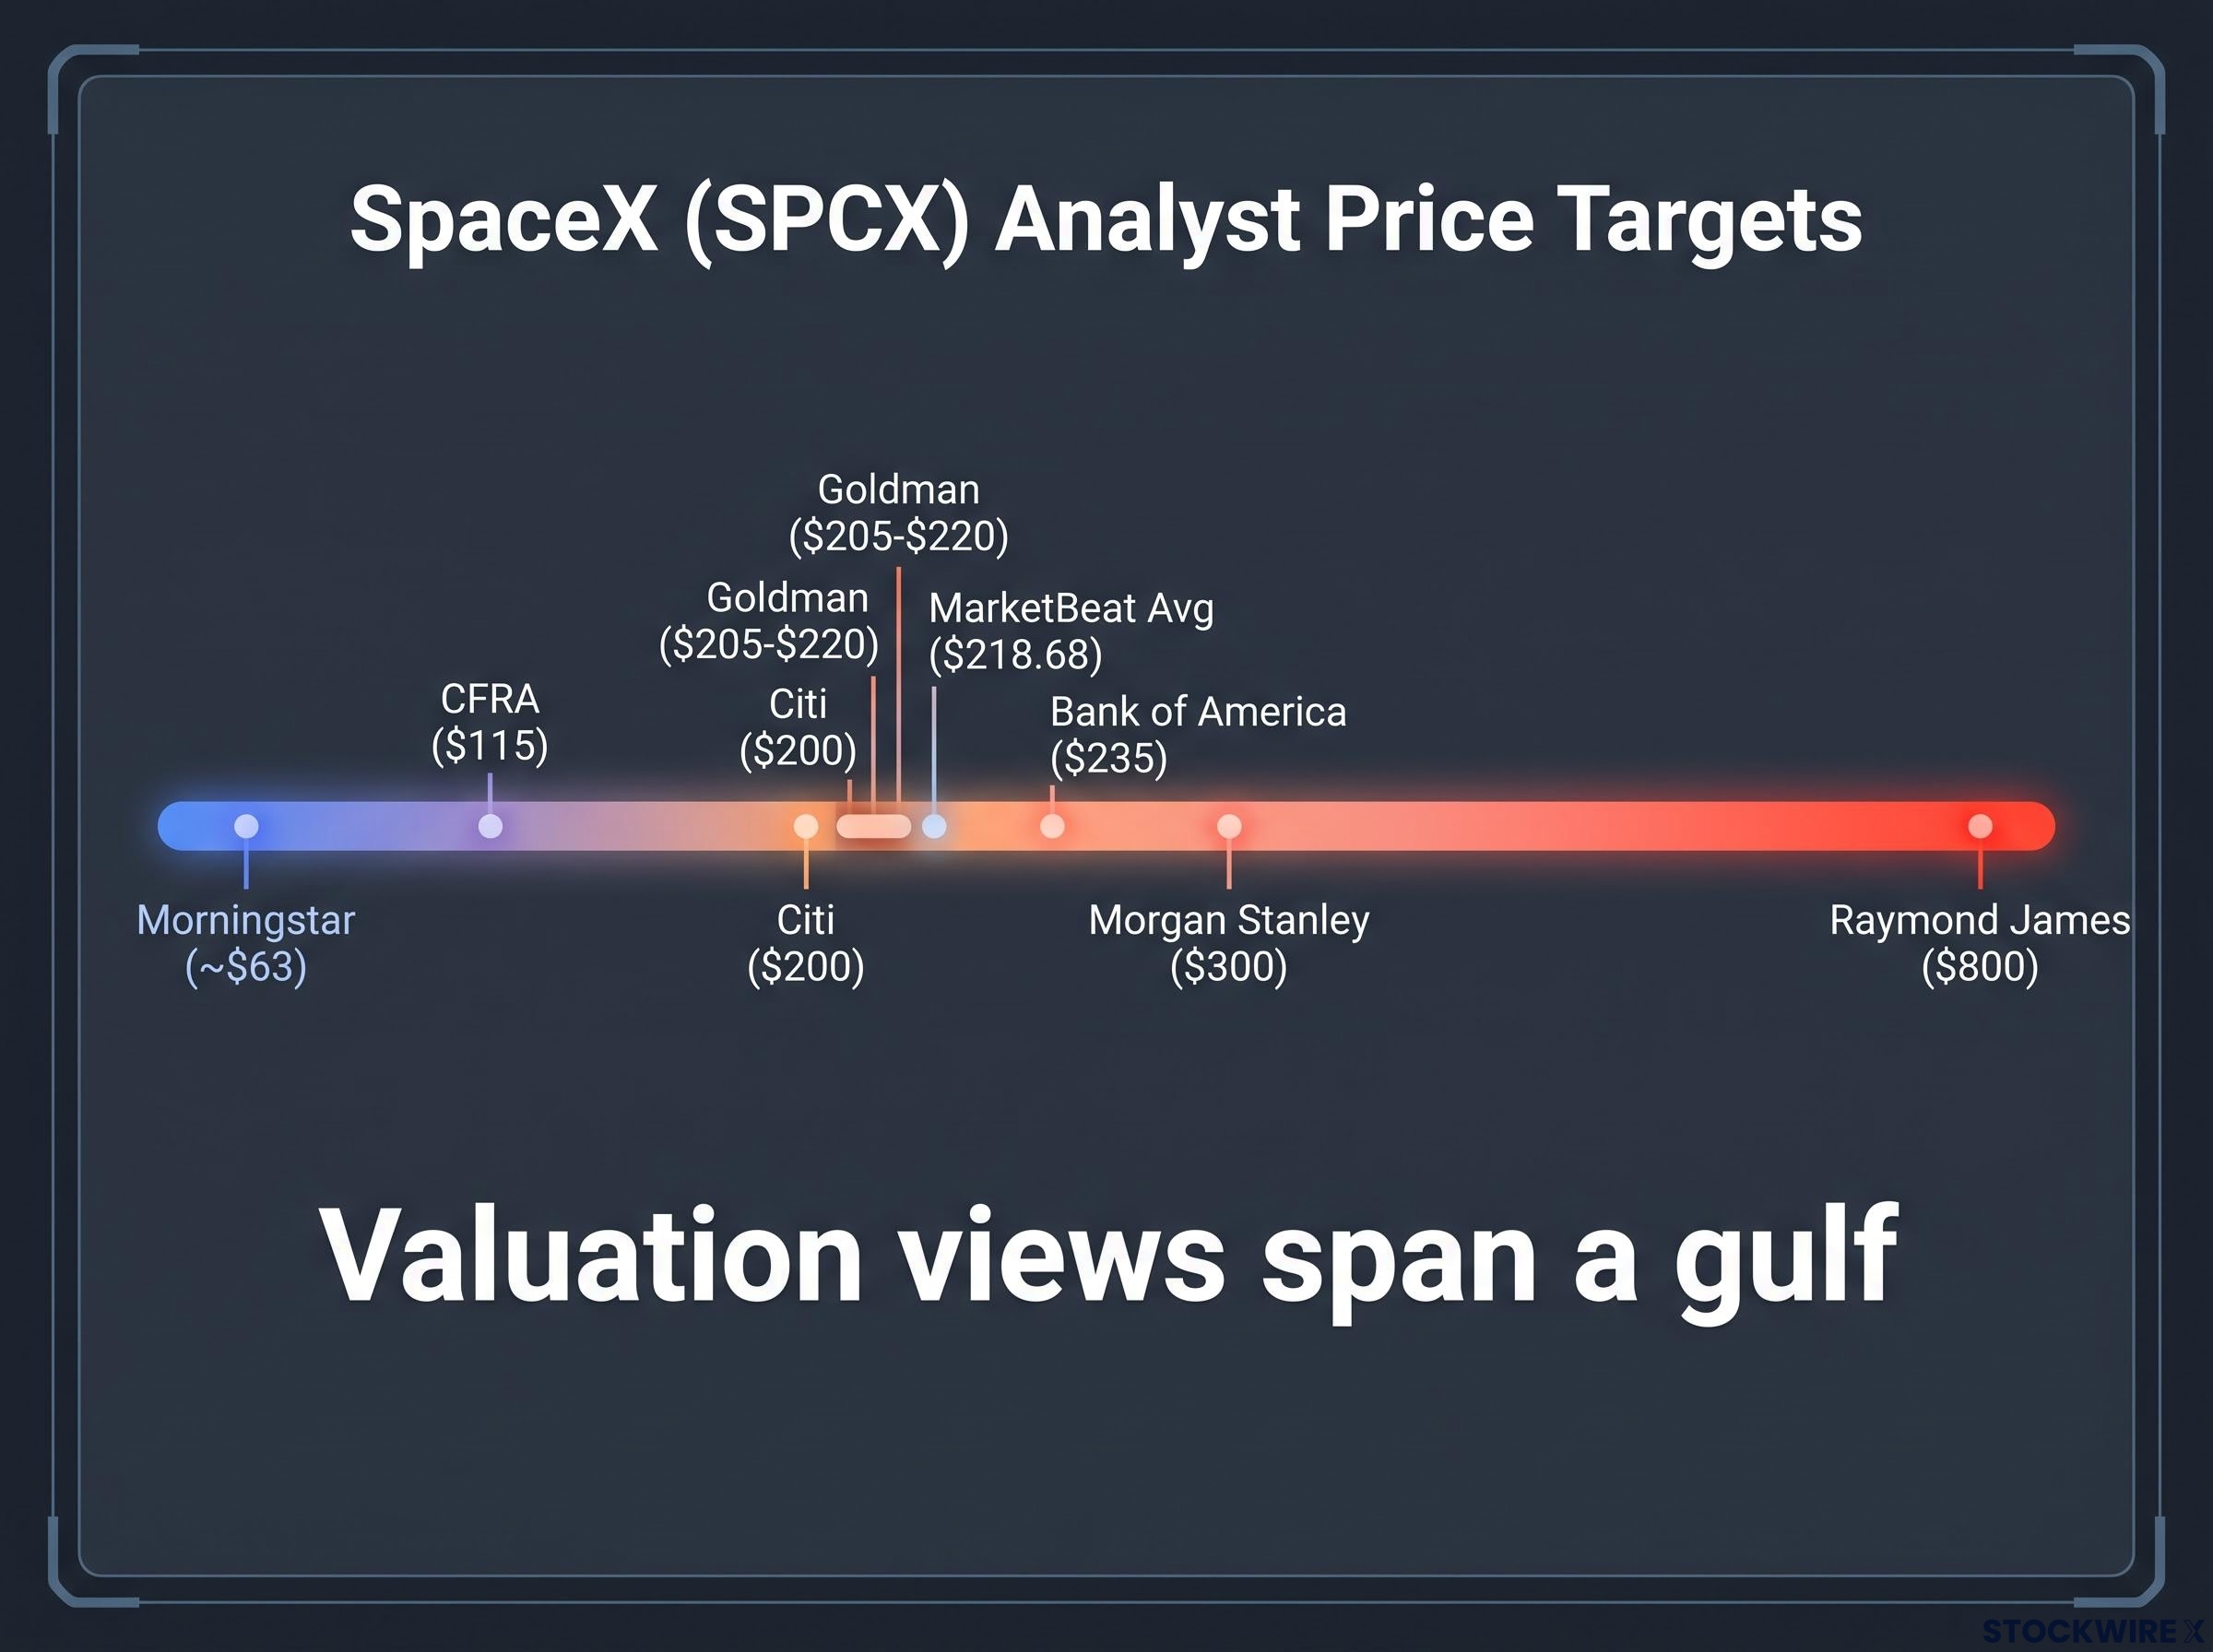
Valuation views on SpaceX span a gulf, and that makes an average target close to useless.
Why targets diverge
Four drivers explain most of the gap:
- Starlink’s addressable market. Bulls see broadband, mobility, government and AI-edge demand; sceptics cite competition, regulation and affordability.
- Launch economics. Optimists expect reusability to cut costs and open new markets; sceptics point to capital intensity and competitors.
- Long-duration projects. Mars, lunar and space-based data centres are options to bulls and cost centres to bears.
- Discount rates and governance. Small changes in discount rates and margins produce large present-value swings.
| Source | Target/Value | Stance |
|---|---|---|
| Raymond James (per presenter) | **$800** | Highest target |
| Morgan Stanley (per presenter) | **$300** | Overweight |
| Bank of America (per presenter) | **$235** | Not specified |
| Goldman (per presenter) | **$205-$220** | Not specified |
| Citi (per presenter) | **$200** | Not specified |
| CFRA (per presenter) | **$115** | Sell |
| MarketBeat average (5 October 2026) | **$218.68** | Range about **$75-$800** |
| Morningstar (12 June 2026) | About **$63** per share (**$780B**) | Intrinsic value |
The brokerage figures come only from the presenter and could not be independently verified. MarketBeat’s $75 low also conflicts with the $115 CFRA figure. With views from roughly $63 to $800, no single target should anchor your decision, so size positions and choose structures that survive being wrong.
Investors exploring the highest target on the street will find our detailed coverage of the Raymond James $800 target, including the six conditions its model requires by 2031.
Long call versus 170/175 spread
The presenter opened a 170/175 long call spread with 25 days to expiry, targeting the same zone as the big buyer. Compared with a plain long call:
- Cost: The spread is cheaper upfront.
- Breakeven: It is easier to reach.
- Vega: Exposure to volatility changes is lower, so IV crush hurts less.
- Upside: Capped at the $5 width.
- Suitability: Better for a move into a zone than a runaway rally.
History adds caution. Post-listing call buying in Coinbase, Rivian and Arm reportedly clustered near narrative peaks and was followed by drawdowns, though these characterisations are illustrative and not independently verified. Past performance does not guarantee future results.
What the flow changes, and what it does not
The flow is real information about positioning, but it is not a forecast. The breakout needs to clear about $172.40 and hold.
Four variables are worth watching:
- Next-day open interest changes on the October strike
- Price behaviour between $172.40 and $172.50
- Confirmation of the 3 November earnings date
- Implied volatility into the event
That leaves a decision: chase, wait for confirmation, or use a defined-risk spread that tolerates being wrong. Waiting costs a little of the move, while chasing costs more if resistance holds.
This article is for informational purposes only and should not be considered financial advice. Investors should conduct their own research and consult with financial professionals before making investment decisions. Options carry the risk of losing the entire premium paid. These statements are speculative and subject to change based on market developments and company performance.