Many investors are likely overweighting one comparison: SpaceX’s chart looks like Facebook’s after 2012, with a strong debut, a deep drawdown and a later rally. It is a seductive pattern, and it deserves scrutiny before anyone sizes a position around it.
SpaceX listed on Nasdaq as SPCX in June 2026 at $135 per share, raising about $75 billion at roughly a $1.77 trillion valuation, the largest IPO in history. One commentator argues the stock is tracking Meta’s post-2012 path, which would imply a further slog lower before a longer recovery.
Figures here reflect conditions around 5 October 2026. Here is what the Meta comparison genuinely shows, where it breaks down, and a short checklist for judging any new mega-IPO.
Does the Meta comparison actually fit SpaceX’s trading so far?
On the surface, the match is convincing. The commentator’s core claim is worth stating in full:
A strong IPO reception, a steep drop, a healing period, another bear phase of a few months, and finally a multi-year rally.
| Metric | Facebook (2012) | SpaceX (2026) |
|---|---|---|
| IPO price | **$38** | **$135** |
| Valuation at pricing | ~**$104B** | ~**$1.77T** |
| First-day open | **$42.05** | ~**$150** |
| First-day close | **$38.23** | ~**$161** |
| Claimed drawdown | ~**61%** (peak of “nearly 50” unverified) | ~**60%** from ~220 to ~100 (low unverified) |
Facebook sold 421,233,615 shares at $38, raising about $16 billion, and its debut was marred by Nasdaq delays. It faded to close just $0.23 above its offer price. SpaceX sold 555.6 million shares, raising about $75 billion ($85.7 billion with the overallotment option, known as the greenshoe), and closed its first day about 19% higher.
Part of the story is retail access to IPO shares: most individual investors buy in the secondary market after institutions are allocated, so the first-day gain that anchors many analog charts was never theirs to capture.
Then the soft spots appear. SpaceX hit a high of $225.64, but verified prices in early October sit around $159-$171, and nothing in the verified record confirms a low near $100. On the Facebook side, the first-day figures do not confirm a peak near 50 either.
The commentator’s original video also predates the June listing, so it was likely a pre-IPO projection rather than a read of actual trading.
A pattern resting on one unverified low is a story, not evidence. Before you act on any claimed drawdown, check it against verified price data.
When big ASX news breaks, our subscribers know first
Why IPO analogs work as stories but fail as forecasts
Analogs feel logical because investors map a known outcome onto a new listing, using chart shape and hype as the bridge. The trouble is that the bridge carries no information about cause.
Research from Jay Ritter at the University of Florida shows IPOs as a group tend to underperform broad benchmarks over three to five years, with very wide dispersion between individual issues. Industry, business model, market cycle and issue size all matter, so “SpaceX will trade like Facebook” is statistically weak unless the drivers match.
Renaissance Capital notes that mega-IPOs with heavy retail participation tend to show high early volatility, selling pressure near lockup expiries (the date when insiders may first sell shares), and strong sensitivity to growth expectations and interest rates. Morningstar and Goldman Sachs commentary adds that lockups can coincide with short-term weakness, but long-run returns follow revenue growth against expectations, profitability and competitive position.
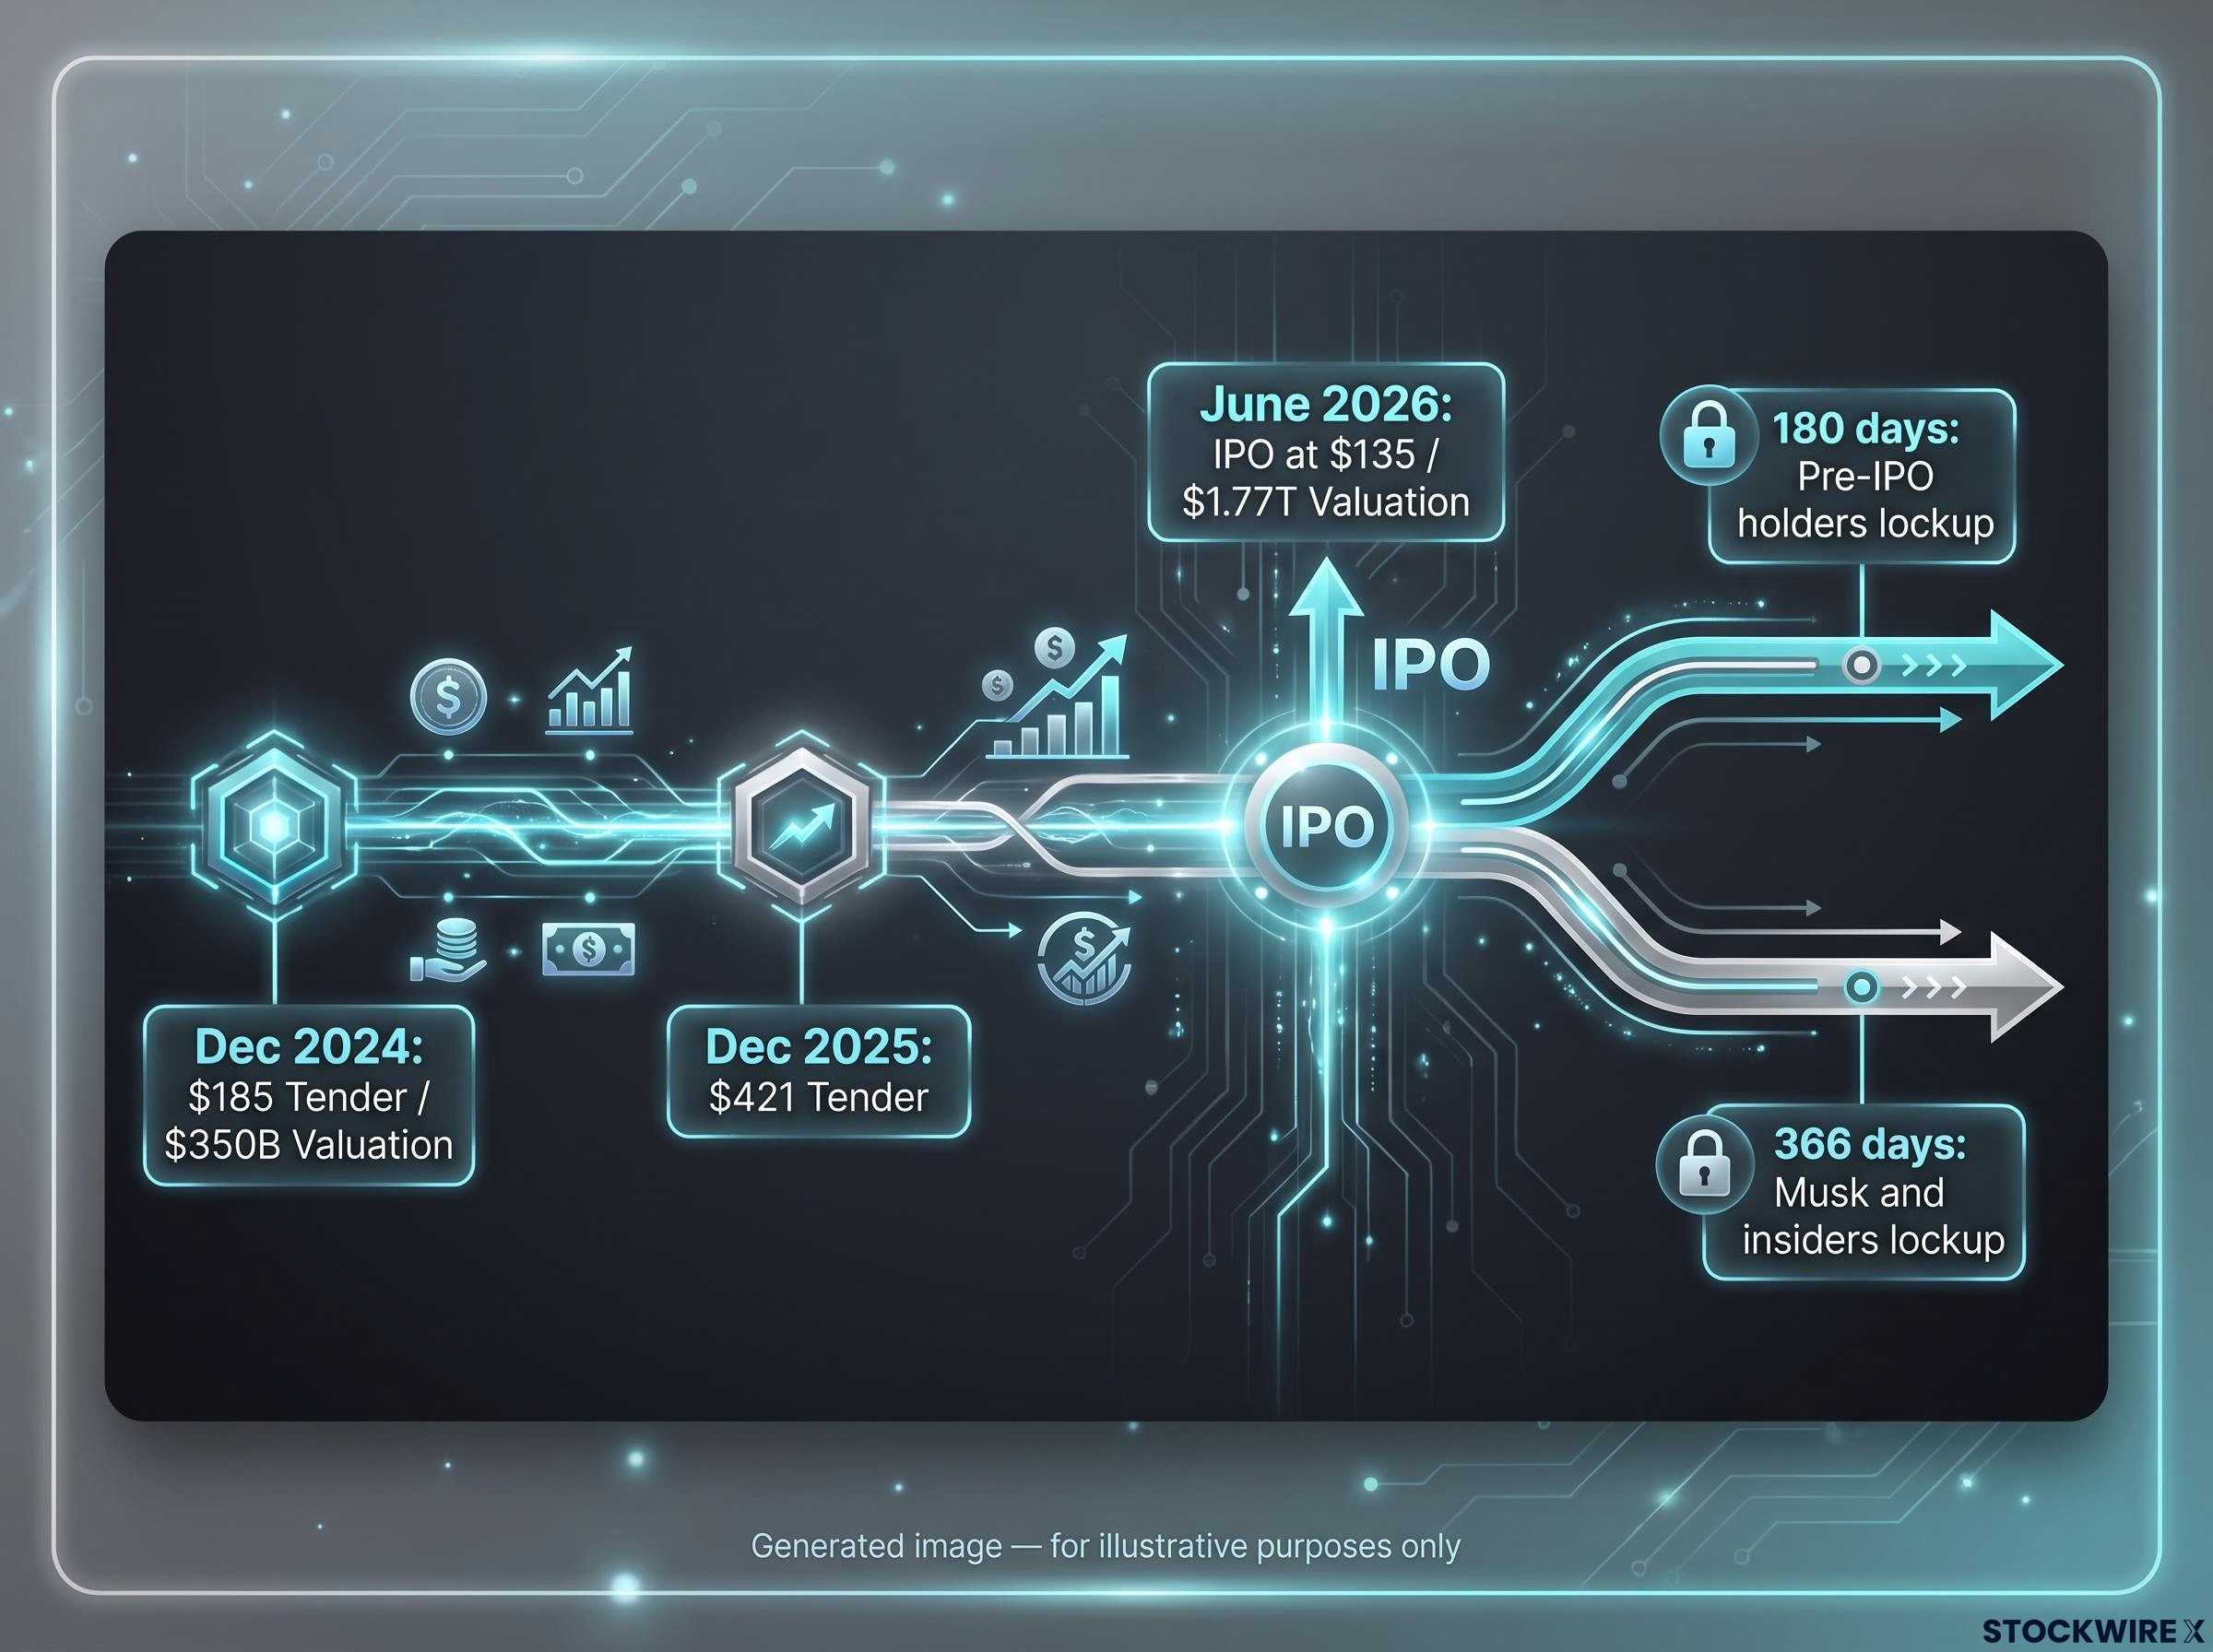
SpaceX’s own lockups run 366 days for Musk and insiders, with staggered 180-day periods for other pre-IPO holders. For you, the sharper question is what drives revenue and margins at this company, not which past chart it resembles.
What Meta had that SpaceX does not
- Business model: Meta was advertising-driven, high-margin and low in capital intensity. SpaceX is capex-heavy, with launch risk and a mix of government and commercial customers.
- Moat: Meta’s came from network effects. SpaceX’s rests on technology, operations and capital.
- Peers: Meta had large, liquid benchmarks in Google and Twitter. SpaceX’s closest peers are much smaller or state-backed.
What the other mega-IPOs show
The spread of outcomes is wide, and each path had its own driver.
| IPO | Listing | Dominant long-run driver |
|---|---|---|
| Alibaba | 2014, NYSE | Chinese regulation and U.S.-China tensions |
| Uber | 2019, NYSE | Profitability and governance doubts |
| Saudi Aramco | 2019, Tadawul | Oil prices and OPEC policy |
| Rivian | 2021, Nasdaq | Production scaling expectations |
| Arm | 2023, Nasdaq | AI and semiconductor cycles |
Uber spent an extended period below its IPO price, and Rivian surged then collapsed. Mega-IPO outcomes are path-dependent, sector-specific and governance-specific.
Why Rocket Lab and other space stocks are not riding SpaceX’s coattails
It is natural to assume a giant listing lifts the whole theme. The evidence suggests capital often concentrates in the leader instead, as it did when Tesla’s rally failed to rescue speculative EV peers.
The June debut also triggered a space sector repricing, with smaller names falling 8% to 28% on listing day as investors benchmarked them against SpaceX’s live valuation.
Five mechanisms are commonly cited:
- Capital concentration: SpaceX’s scale across launch, Starlink and defence makes it the category winner, potentially diverting marginal capital from peers.
- Valuation and funding discipline: Many listed space firms are pre-profit, and a high SpaceX valuation may push investors to demand more proof of unit economics from them.
- Different investor bases: Pre-IPO tenders served institutions and accredited investors, not the retail flows behind small caps and thematic ETFs.
- Index and ETF construction: Weight caps and rebalancing can offset a new constituent’s benefit, especially if its weight is funded by trimming smaller holdings.
- Risk differentiation: Smaller names are seen as narrow, higher-risk technology bets, while SpaceX is viewed as a diversified platform.
Virgin Orbit’s 2023 bankruptcy is a reminder of what weaker-name risk looks like. The commentator’s framing needs correcting, though.
| Holding | Commentator’s claim | Verified data |
|---|---|---|
| Rocket Lab (RKLB) | Not benefiting | ~**6%** YTD, ~**40%** one-year, ~**$73**, peaks near **$151**, drawdowns above **50%** |
| UFO ETF | Performs poorly | ~**12%** YTD, ~**15%** one-year, ~**$43**, SPCX ~**15%** weight |
Peers have not uniformly rallied, but “performs poorly” is not supported by the year-to-date and one-year figures. If you hold space exposure through a thematic ETF, you are now partly a SpaceX holder, so check how much of your “diversified” position is really one stock.
Musk, the midterms and the risks no Facebook chart captures
The commentator expects a slog lower after the November midterms, particularly if Democrats win big. The task is to separate what is documented from what is merely expected.
What is documented
Musk’s 2026 giving is estimated at $85-90 million or more, mostly to Republican candidates and PACs through America PAC and other vehicles. The research shows no market evidence tying SpaceX or Tesla share moves to it.
No direct evidence ties immediate SpaceX or Tesla stock moves to Musk’s political donations.
Several structural risks sit outside Meta’s story:
- Key-person and governance exposure: Musk is tied to strategy and customer relationships, and governance may limit minority shareholders’ influence.
- Government and defence revenue: This adds a political overlay Meta’s ad model never had.
- Starlink regulation: Global approvals shape the growth path.
- Lockup and secondary supply: Tender prices ran from $185 in December 2024 to $421 in December 2025, and valuations climbed from $350B to $1.77T at IPO, so early holders have large gains to sell.
- Operating drivers: Starlink economics, reuse and launch cadence will shape results.
What is expectation
The post-election slog is the commentator’s view, not a finding. Treat political exposure as a real but unquantified risk to size around, not a calendar-based trading signal.
What the Meta comparison changes, and what it does not
The Meta analog is a useful reminder that strong debuts can be followed by long drawdowns and later recoveries. It is not a price template for SpaceX.
Apply five checks to any mega-IPO: verify the claimed drawdown, identify the company-specific drivers, map the lockup dates, check ETF overlap, and size for political and key-person risk.
A disciplined IPO trading strategy, built around the first-month momentum window and a planned exit before lock-up supply arrives, replaces chart-shape guesswork with dates and rules that can be tested.
Figures are as of early October 2026 and will keep shifting. The first lockup expiries and the post-midterm period are the next decision points, with no direction implied.
This article is for informational purposes only and should not be considered financial advice. Investors should conduct their own research and consult with financial professionals before making investment decisions.