Bitcoin’s snapshot price of about $85,302 sits almost exactly on an analyst’s $85,240 support line, while Ethereum, Hyperliquid (HYPE) and Zcash (ZEC) each sit at a different point in a different pattern. Why does one chart line matter more than another, and how would you tell?
Traders across all four assets are leaning on the same small toolkit: parallel channels, necklines and bear flags. Learn it once, and crypto technical analysis stops being a wall of squiggles and becomes something you can apply to any chart. All prices here are dated snapshots from 4-5 October 2026.
After this, you will have a working method for reading levels, plus a clear sense of what would confirm or invalidate each setup. It is an educational framework, not a prediction or financial advice.
How do parallel channels, necklines and bear flags actually work?
Each pattern is a drawing on a price chart, and each line is a place where traders expect buyers or sellers to react. Investopedia, the CMT Association and major exchanges describe them in broadly similar terms. Every pattern comes with a confirmation test and an invalidation test.
Before drawing any line, it helps to know that reading a stock chart starts with just two variables, price and time, and every overlay you add is a reinterpretation of that same history rather than a forecast.
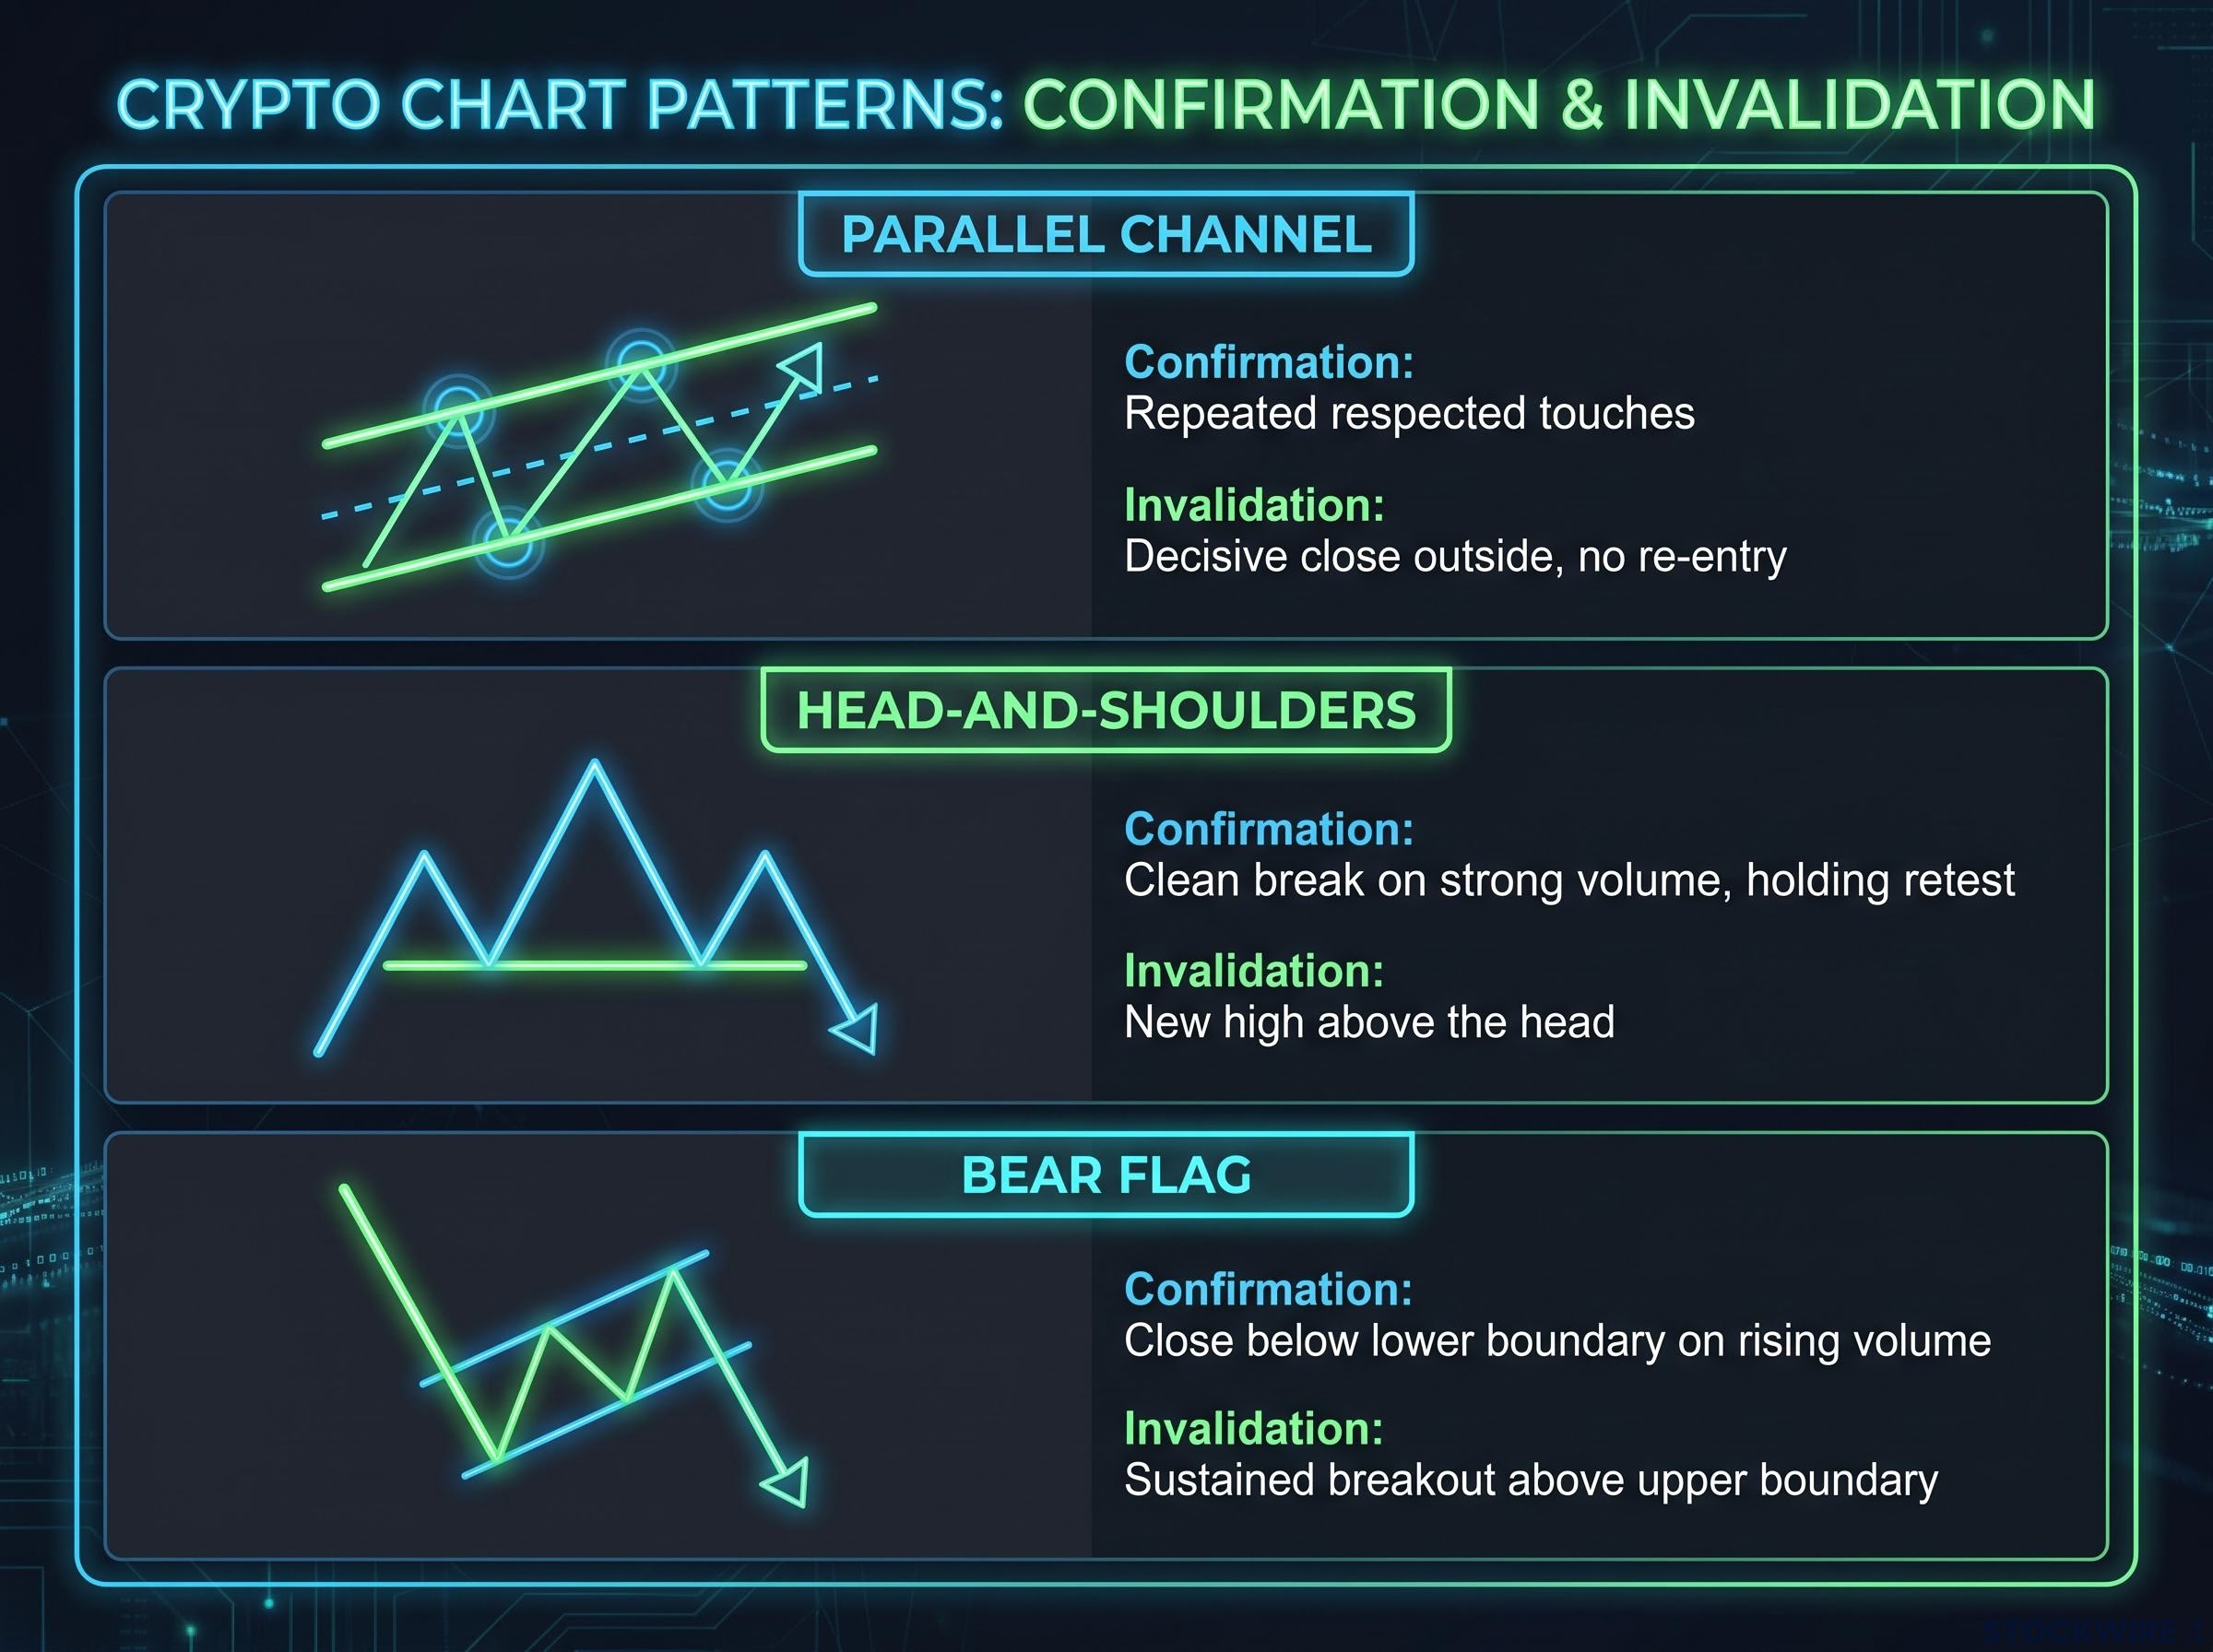
Parallel channels and the midpoint
A parallel channel is two roughly parallel trendlines wrapped around a trending move. The lower line acts as dynamic support (a level where buyers tend to step in), the upper as dynamic resistance (where sellers tend to appear), and the midpoint as a pivot where price often pauses or flips.
Repeated respected touches confirm the channel. A decisive close outside it, followed by failure to re-enter, invalidates it.
Head-and-shoulders necklines
A head-and-shoulders top has three peaks, with the middle one highest. The neckline joins the swing lows between them, and a clean break below it on strong volume, followed by a retest that holds, confirms the reversal. The measured move (the expected size of the fall) equals the head-to-neckline distance, projected from the break.
Bear flags
A bear flag is a sharp drop (the flagpole) followed by a sideways or upward-sloping consolidation (the flag). A close below the lower boundary on rising volume confirms it, often targeting a fall equal to the flagpole. A sustained breakout above the upper boundary invalidates it and can trigger squeezes, where traders betting on a fall are forced to buy back.
| Pattern | What it shows | Confirmation | Invalidation |
|---|---|---|---|
| Parallel channel | Trend bounded by support, resistance and a midpoint | Repeated respected touches | Decisive close outside, no re-entry |
| Head-and-shoulders | Three-peak reversal around a neckline | Clean break on strong volume, holding retest | New high above the head |
| Bear flag | Pause after a sharp drop | Close below lower boundary on rising volume | Sustained breakout above upper boundary |
Because every line is a judgement call, treat a level as a zone where you watch for a reaction, not a precise trigger. Decisive closes and retests count; single touches and intraday wicks do not.
When big ASX news breaks, our subscribers know first
Where are Bitcoin and Ethereum sitting inside their patterns?
The same toolkit gives two different readings. Bitcoin sits at a decision line, while Ethereum has room between two levels. All levels below come from analyst Drew Dosek of Verified Investing (weekly charts) and are views, not facts.
Bitcoin: the neckline test
Dosek sees Bitcoin rebounding toward the neckline of a roughly two-year head-and-shoulders with an upward-sloping neckline. The pattern’s roughly $37,000 measured target was never reached, because the lower boundary of a parallel channel held.
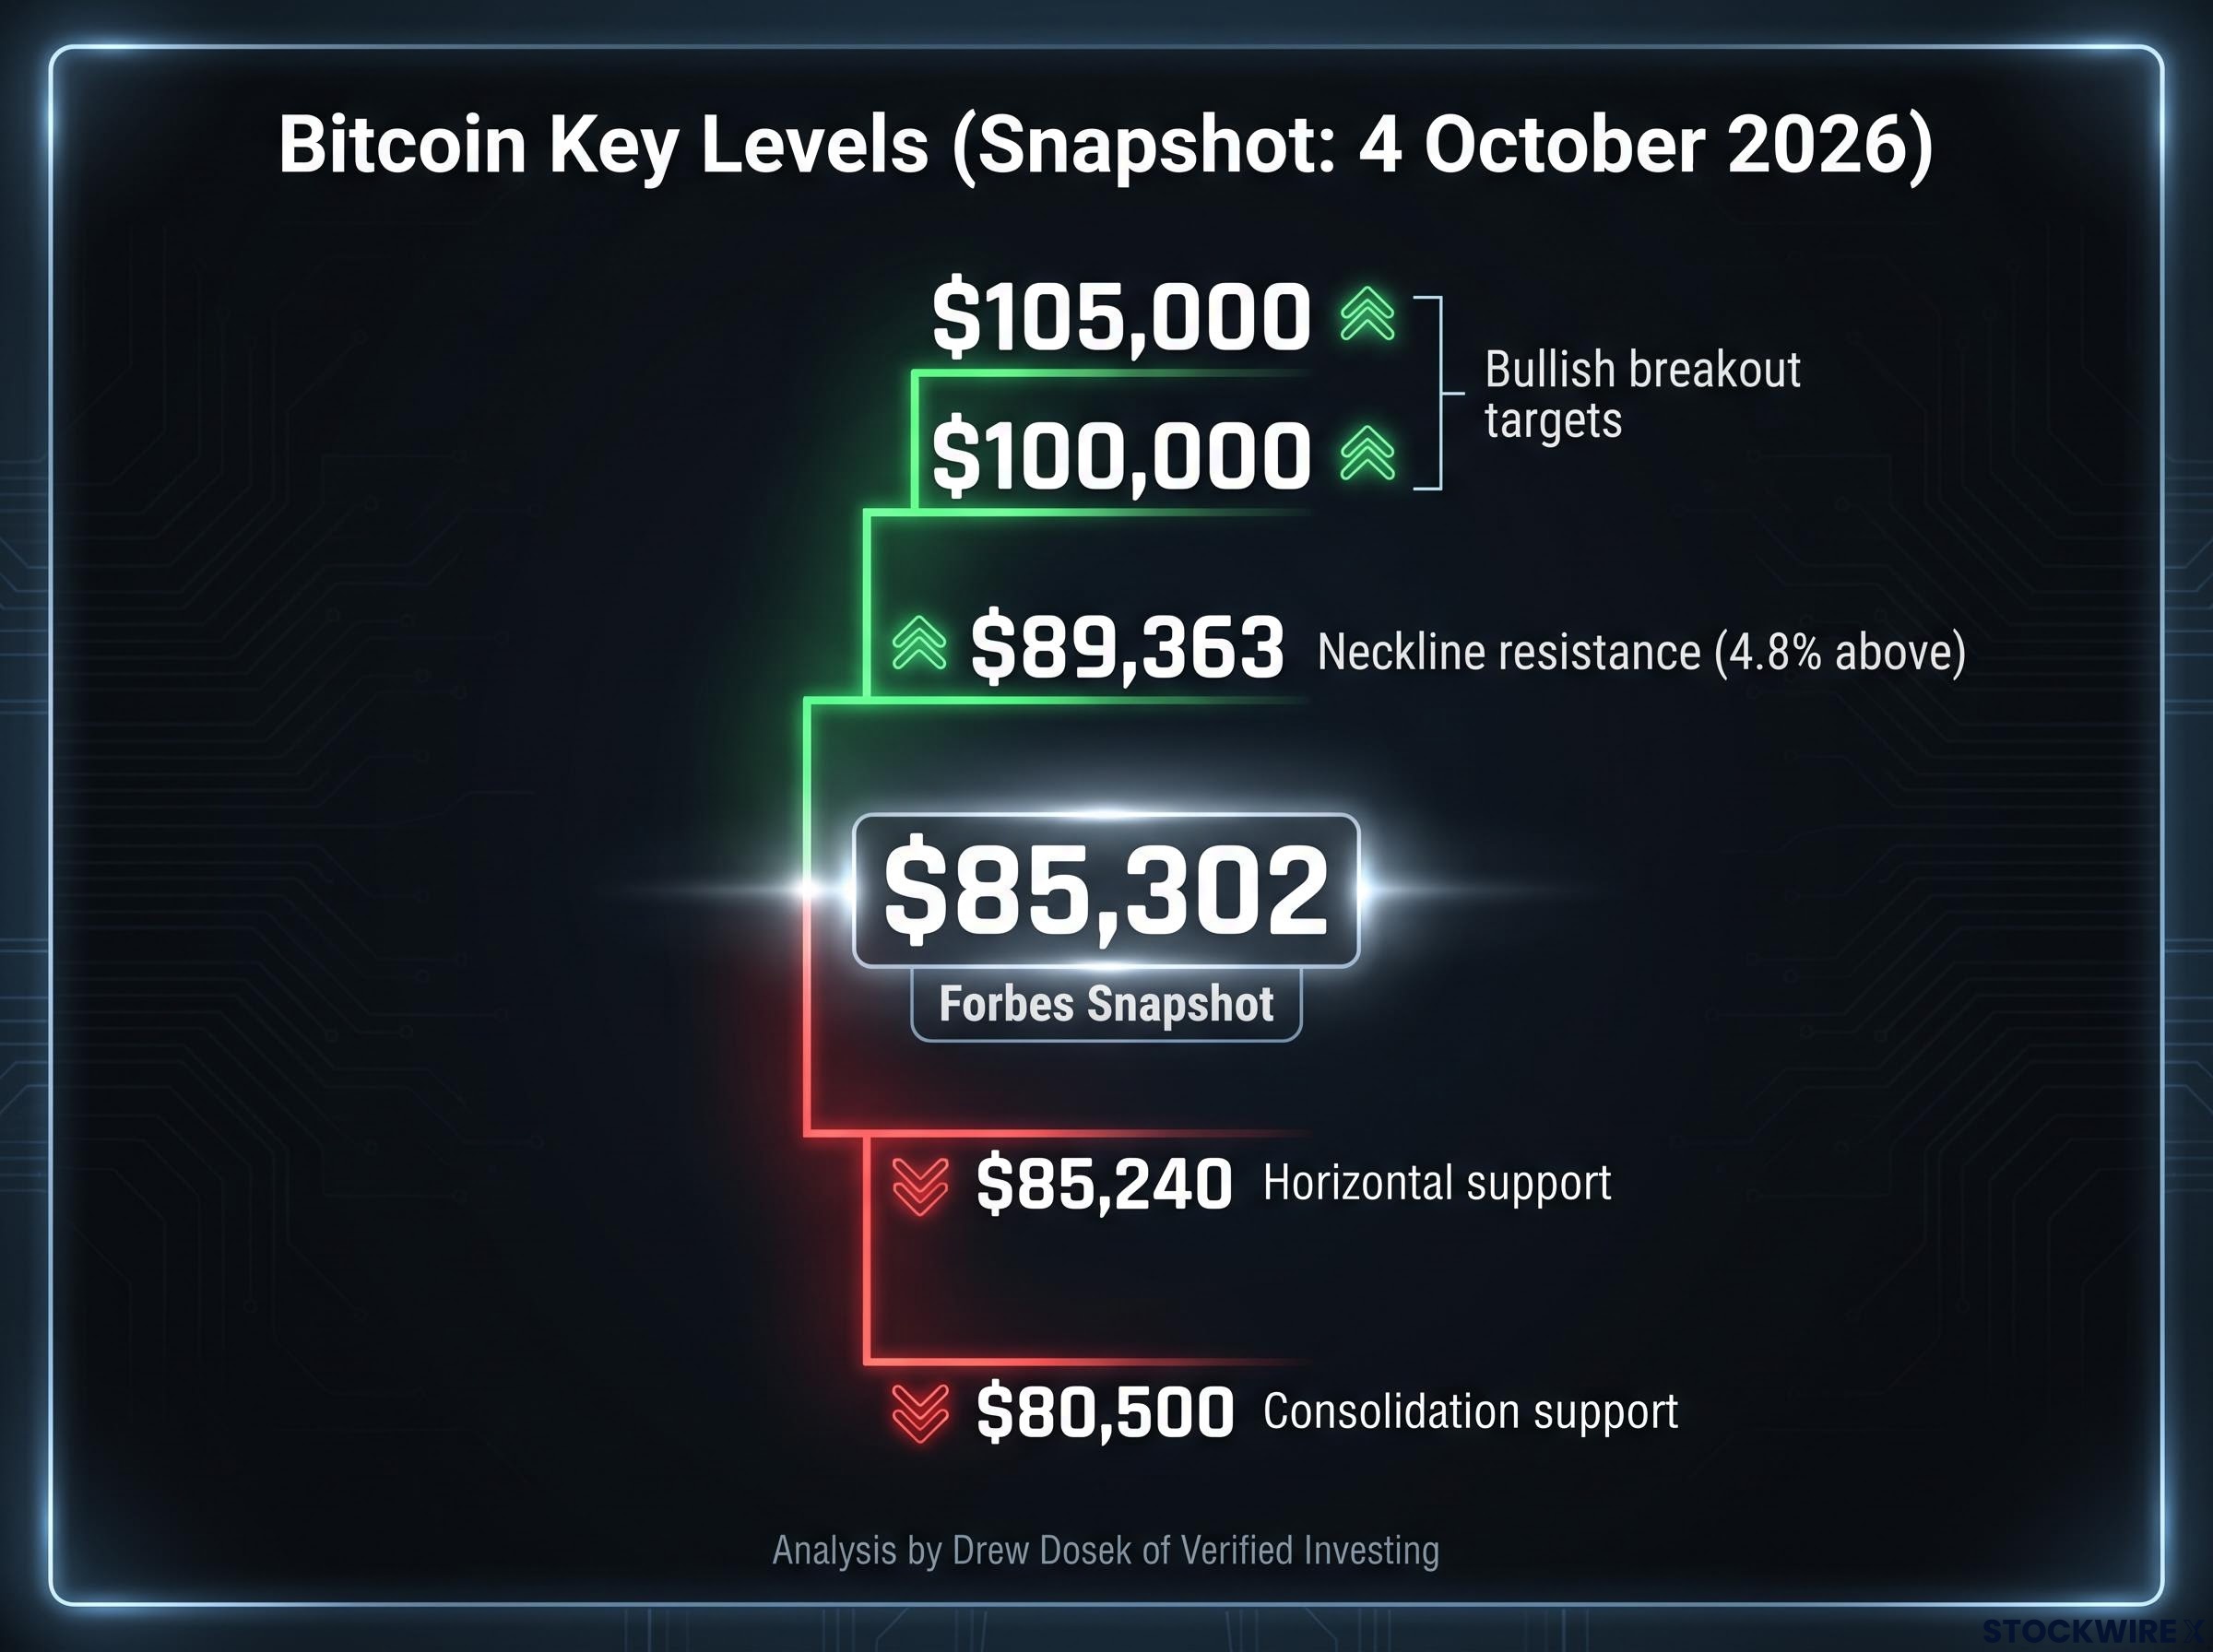
At the $85,302 snapshot (Forbes, 4 October 2026), Bitcoin sits about 4.8% below the neckline. With price on its support line, the next reaction at $85,240 or the neckline will tell you more than any call on direction.
Alongside the neckline and horizontal support, Bitcoin’s EMA cluster, stacked in bullish order below price, and an RSI that reset from overbought levels offer a second layer of evidence for judging whether $85,240 holds.
- Bullish branch: a neckline touch, sideways consolidation, then a breakout toward $100,000 and $105,000. Dosek favours this consolidate-first path.
- Bearish branch: rejection at the neckline, then a drop below horizontal support. Rallies that surge straight into a neckline often fade.
Ethereum: between $2,400 and $3,041.67
Ethereum was supported by the bottom of a channel that began in June 2022. It broke below, was rejected on a re-entry attempt, fell near $1,500, then recovered.
- Bullish branch: consolidation above the level set by the 7 September red candle, then momentum toward $3,000 and the $3,600 channel midpoint.
- Bearish branch: failure to hold $2,400, which would leave the $1,800 channel bottom in view.
| Asset | Level | Role | Snapshot context |
|---|---|---|---|
| BTC | $89,363 | Neckline resistance | About 4.8% above $85,302 |
| BTC | $85,240 | Horizontal support | Price sits almost on it |
| BTC | $80,500 | Consolidation support | Below snapshot |
| ETH | $3,041.67 | Resistance (week of 26 January high) | Above $2,700.65 |
| ETH | $2,400 | Support to hold | Below snapshot |
What do the Hyperliquid and Zcash charts show, and why are they harder to read?
One is a momentum story holding a channel midpoint; the other is a bear flag still forming. Both are less clean than the large caps, for reasons the chart cannot show.
HYPE: holding the channel midpoint
Dosek notes HYPE broke a declining trendline from earlier highs and never retested it, which he reads as strong momentum. Price now holds the 50% line of a parallel channel.
- $110.52: channel top, the target if the all-time high is breached.
- $89.14: midpoint to watch; consecutive daily closes below it point to the lower half.
- $78.17: channel bottom support.
Prices sat around $90-$95 on 5 October: CoinGecko $94.64, TradingView $93.22, Kraken $93.83, with Binance at $90.76 on 4 October. Kraken and CryptoTicker date the record of $97.96 to 23 September 2026, so the high has been reset since the analyst’s “June highs” framing.
The overlay matters. Binance listed HYPE with a Seed Tag on 24 September, and unlock estimates range from about 330,000 to 14.18 million HYPE depending on the provider. Against that, 99% of protocol revenue goes to a buyback-and-burn Assistance Fund.
Supply gap: On 29 September, Hyperliquid reported circulating supply 76,235,135 HYPE higher than CoinGecko’s figure, worth about $6.6 billion at $86.15.
When providers cannot agree on supply, a clean line can be overwhelmed by forces the chart does not show. Weigh supply events and thin liquidity as heavily as the pattern.
Zcash: a bear flag in progress
Dosek says ZEC broke down from a secondary channel, tested the channel bottom the next day, then formed a bear flag on pivot highs. He expects roughly seven to eight more days of sideways action, similar to the prior bull flag’s duration, before a possible drop to the top of the lower channel.
The failure case is a breakout above the flag’s upper boundary. He gave no specific ZEC levels, so the Forbes price of $1,334.07 is a reference only.
For readers wanting more altcoin levels, our full explainer on Zcash and Hyperliquid chart setups maps ZEC’s support ladder and HYPE’s channel ceiling.
When does technical analysis fail, and how should you use these levels?
Charts are a map of decision points with known failure modes, not a forecast. Treat every confirmed pattern as a probability shift, and size your conviction accordingly.
Where patterns break down
- False breakouts: long wicks from leverage and thin liquidity can breach a neckline intraday and reclaim it.
- Leverage cascades: perpetual futures and liquidation engines can push moves beyond what a pattern implies.
- Thin liquidity: smaller tokens such as HYPE and ZEC suffer gaps and slippage, which lowers pattern reliability.
Technicians often describe Bitcoin’s 2017-2018 top as head-and-shoulders-style distribution with a neckline zone near $6,000. Yet bear flags in 2020-2021 reportedly broke upward and produced squeezes. Channel breakdowns have marked regime shifts without permanently invalidating the structure.
Academic work, largely in equities and currencies, reportedly finds weak out-of-sample results once costs are included. Institutional risk teams pair charts with macro, fundamental and flow data, and the SEC, ESMA, FCA and ASIC warn that crypto is highly volatile and that chart-based leveraged strategies can magnify losses.
Institutional teams pair charts with regulatory and macro risk, such as the Senate’s failed Clarity Act vote and a Bitcoin break below its 200-day average, because a clean pattern can be overwhelmed by forces it cannot show.
A repeatable checklist
- Identify the pattern.
- Mark the levels.
- Wait for a decisive close.
- Look for a retest.
- Cross-check liquidity, leverage and supply.
What these four charts teach, and what to watch next
Four assets, three patterns, one method: map each level to what confirms it and what invalidates it. The watch points are Bitcoin at $85,240 and $89,363, Ethereum at $2,400 and $3,041.67, HYPE at $89.14 and $97.96, and ZEC’s flag boundaries.
Levels are where you look for evidence. Your job is to wait for confirmation, not anticipate it.
Prices are snapshots from 4-5 October 2026 and may have moved. Past performance does not guarantee future results, and these statements are speculative and subject to change based on market developments. This article is for informational purposes only and should not be considered financial advice. Investors should conduct their own research and consult with financial professionals before making investment decisions.