
The euro sits near a 17-month low around 1.12, the US 10-year Treasury yield is at 5.35%, and the 30-year is close to 5.70%. Broad equity indices have barely flinched. Yet Lennar shares fell 5.3% today to about $75.60.
So where does bond stress go when the index will not show it? It tends to surface first in rate-sensitive corners of the market, and housing is the most exposed. On 5 October 2026, the 30-year mortgage rate stands at 7.28%, up from about 6% at the start of the year.
Here is how to trace a line from a bond-market move to a specific stock, and how a trader might express a view on that stock using a defined-risk options spread. This is how rising bond yields impact stocks that your index fund may be hiding from you.
Why are yields climbing while the euro slides?
The screens tell a consistent story. The euro has dropped swiftly over a couple of weeks, yields are rising in the US and France, and long bond futures (ZB) keep sliding, on a chart that looks like a prolonged decline since September 2024.
Four drivers sit behind the moves:
- Fiscal supply and debt concerns: Heavy government borrowing means more bonds for the market to absorb, so investors ask for more yield.
- A rebuilding term premium: This is the extra yield investors demand for holding long bonds instead of rolling short-term bills.
- “Higher for longer” central banks: The Fed, ECB and Bank of England have signalled policy rates could stay elevated until inflation is clearly at target.
- French political and fiscal worries: Concern about instability or fiscal slippage widens French yields over German ones and encourages selling of the euro.
Here is where the key gauges stand:
| Indicator | Level | What it signals |
|---|---|---|
| US 10-year yield | 5.35% | Higher benchmark borrowing costs |
| US 30-year yield | About 5.70% | Rebuilding term premium |
| French 10-year OAT | About 4.86%-4.92% | Fiscal and political risk in France |
| OAT-Bund spread | About 147 bp | Stress gauge versus German debt |
| EUR/USD | About 1.120 | 17-month low |
The stress gauge The gap between France’s 10-year OAT yield and Germany’s Bund yield (near 3.43%) is about 147 bp. It measures the extra return investors demand for French risk, which makes it a gauge of stress rather than just a number.
A weaker euro paired with rising yields tells you capital wants more compensation for holding long-duration debt. Borrowing costs across the US economy are being repriced, even if your index fund looks calm.
When you see long yields rising, it helps to know why bond yields move at all: yields are repriced continuously in the secondary market, and the reason behind a move matters as much as its direction.
Where strategists disagree
Three debates remain open, and none is settled. The first is how much of the yield rise is fundamental (inflation, growth) versus technical (positioning, issuance calendars).
The second is whether euro weakness mainly reflects the interest-rate gap or country-specific political risk. The third is how persistent the higher term premium will be once inflation normalises and fiscal paths clear.
One puzzle is worth flagging: precious metals have not benefited from euro weakness as might be expected.
When big ASX news breaks, our subscribers know first
How do higher yields travel from the bond market to stocks?
Think of it as a four-link chain you can reuse on any rate-sensitive stock:
- Mortgage rates and affordability: Mortgage rates are priced off longer Treasury and mortgage-bond yields, so higher payments shrink the pool of qualified buyers.
- Incentives and margins: Builders respond with rate buydowns, closing-cost help and price cuts, which erode margins.
- Land and inventory financing: Higher yields raise the cost of carrying land and unsold homes.
- Valuation discount rates: Higher risk-free yields lower the present value of future cash flows, which often compresses valuation multiples.
Freddie Mac’s 30-year fixed rate shows the first link in action:
| Date | 30-year fixed rate | Change vs prior reading |
|---|---|---|
| 3 September 2026 | 6.71% | Up from 6.66% |
| 17 September 2026 | 6.95% | Up from 6.76% |
| 24 September 2026 | 7.03% | Up from 6.95% |
| 1 October 2026 | 7.28% | Up from 7.03% |
The rate began 2026 near 6.01% (19 February). Analysts generally frame Lennar and D.R. Horton as highly rate-sensitive, with Horton more exposed to entry-level buyers, while Toll Brothers is more resilient to mild moves but vulnerable if a yield spike triggers risk-off sentiment.
The 2022-2023 rate shock is the precedent: homebuilders suffered sharp drawdowns as mortgage rates approached and passed 7%. If you own or watch any stock whose customers finance purchases, or whose value rests on distant cash flows, rising 10-year and 30-year yields are an early warning on that holding, whatever the S&P 500 is doing.
Analysts have already cut homebuilder EPS estimates by roughly 18% for 2026, which suggests some share prices still rest on projections that rising yields have made obsolete.
Why the index may not notice
- Earnings resilience: If yields rise on stronger nominal growth, earnings can hold up and mask sector-level pain.
- Index composition: Tech, healthcare and consumer names dominate, and homebuilders are a small slice.
- Policy-response expectations: Investors may look through yield spikes if they expect central bank or fiscal action.
What is Lennar showing about rate stress and affiliate risk?
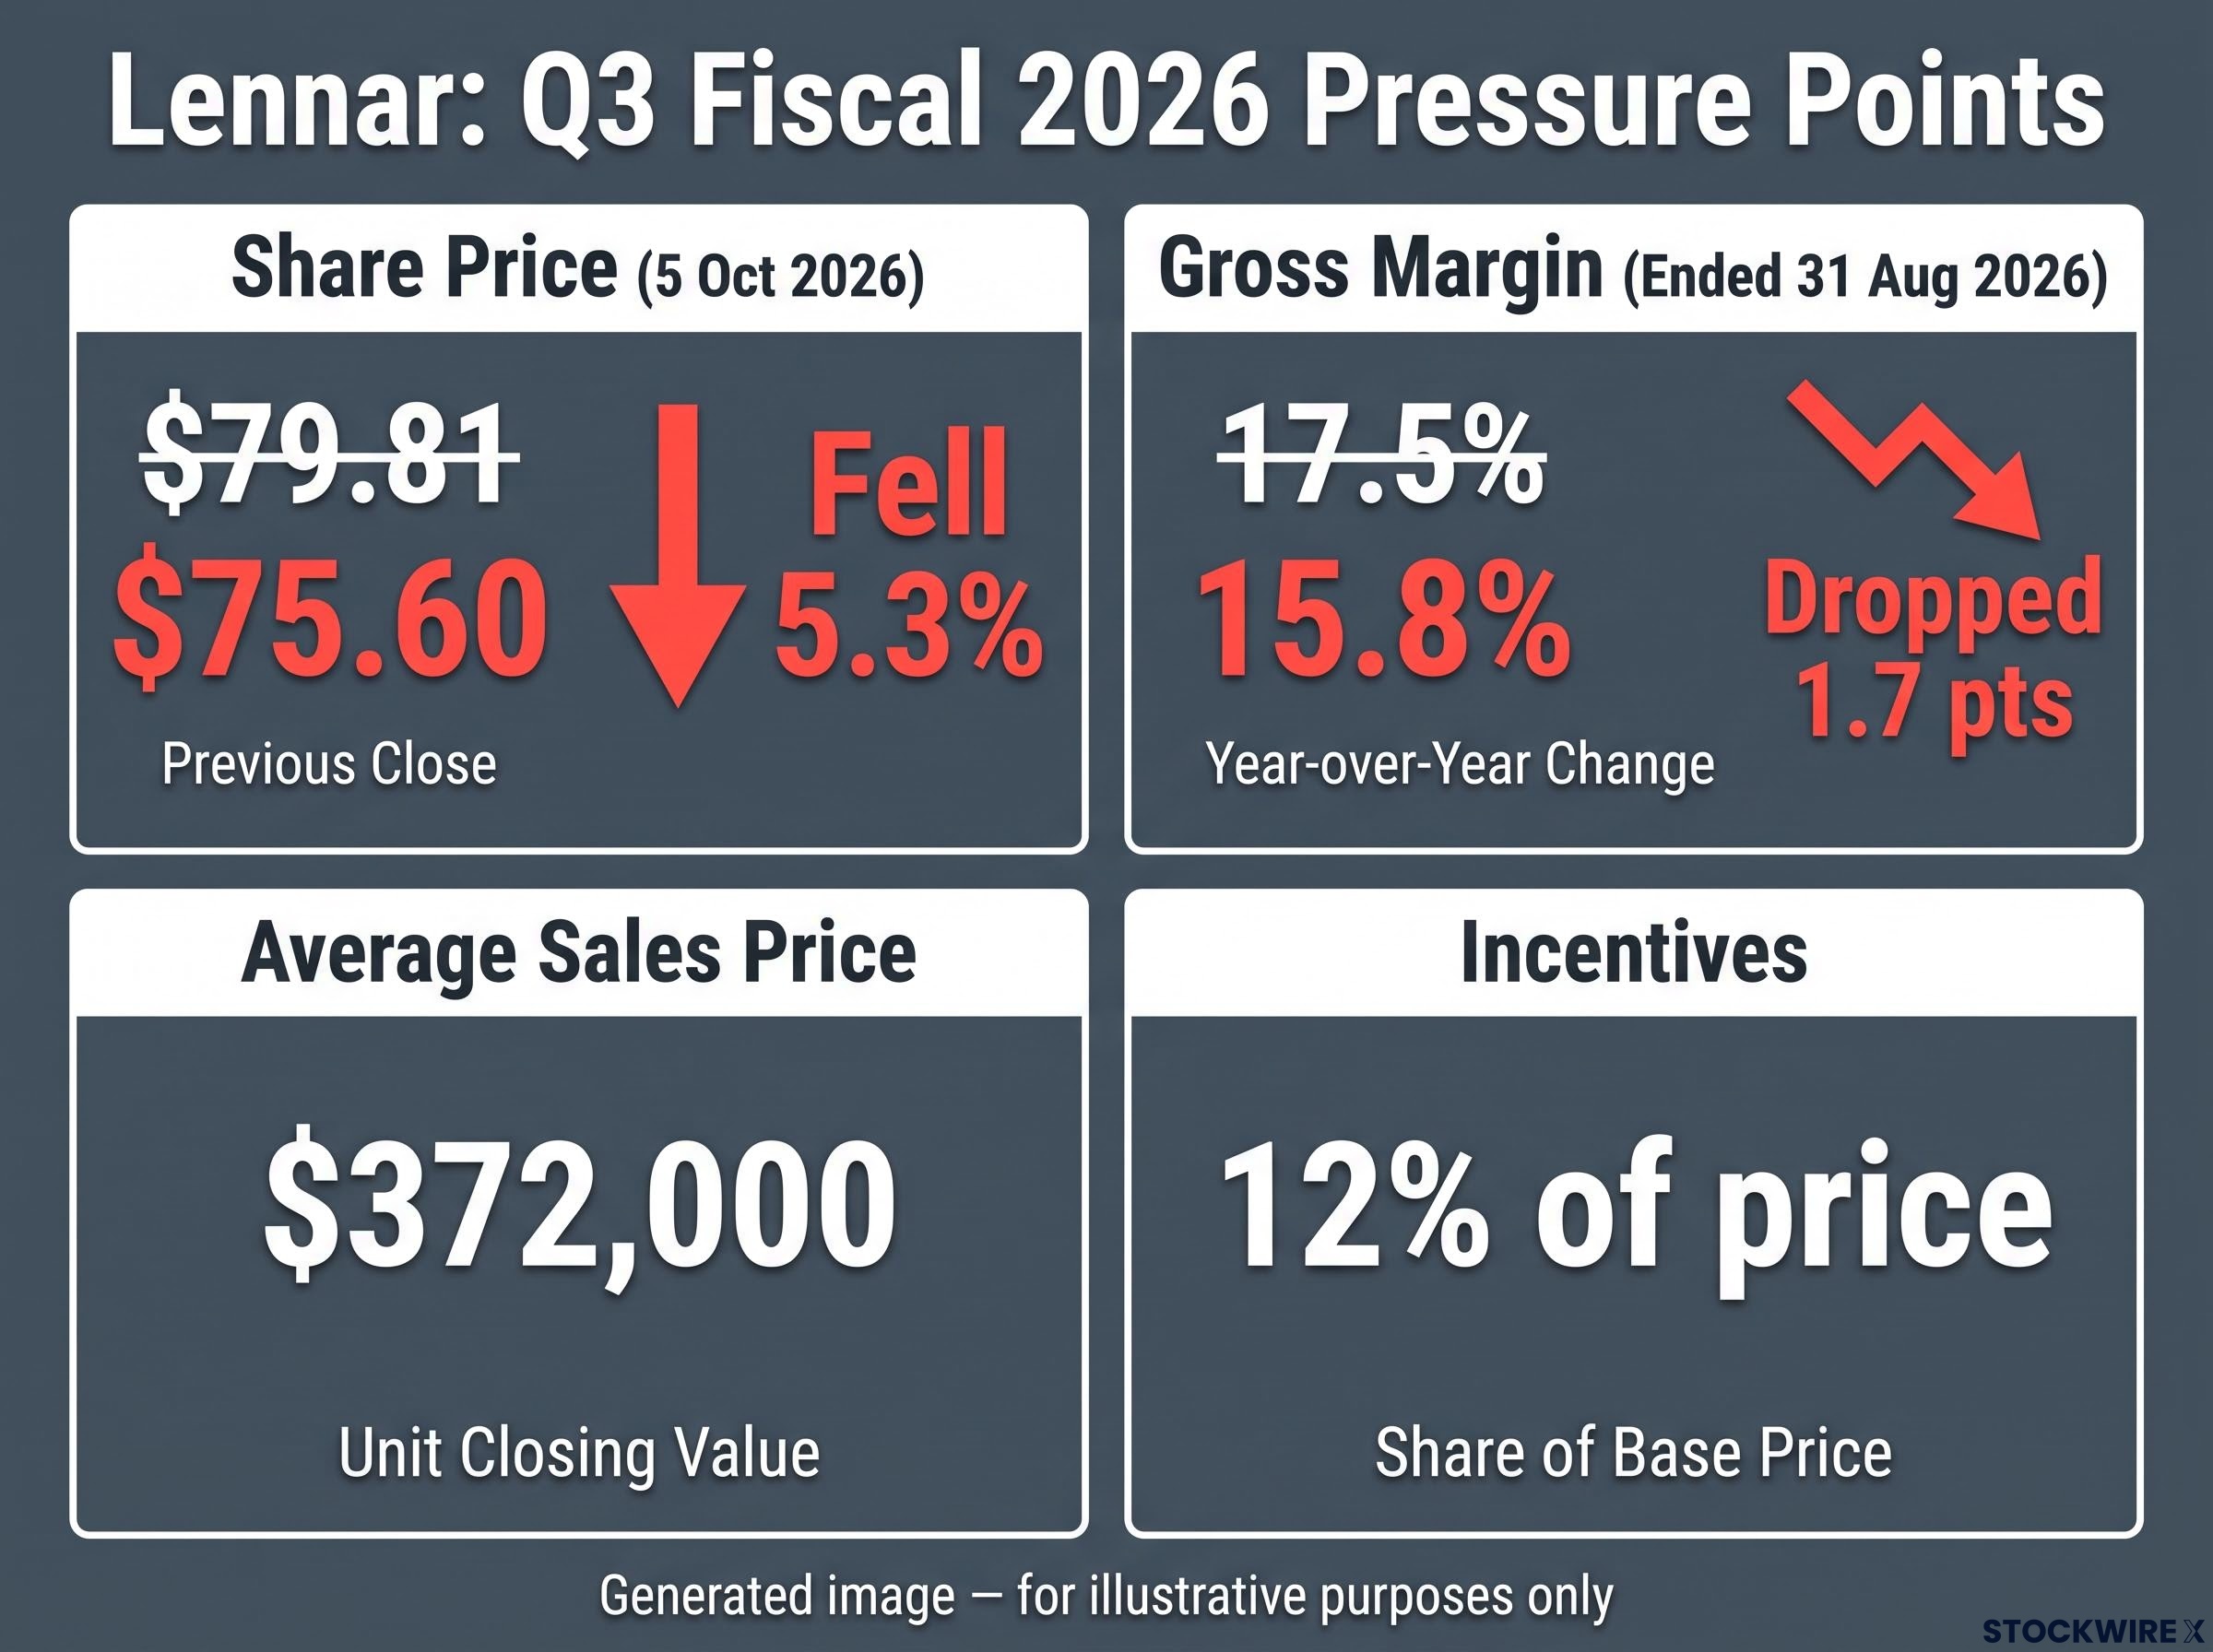
Lennar fell 5.3% on 5 October 2026, closing near $75.60 against a previous close of $79.81. That is the visible symptom, and the quarterly numbers show the pressure was already building.
What the quarter shows
In Q3 fiscal 2026 (ended 31 August 2026), homebuilding gross margin was 15.8%, down from 17.5% a year earlier. Incentives ran at about 12% of price, and deliveries and orders fell year on year.
| Metric | Current | Year earlier or reference |
|---|---|---|
| Homebuilding gross margin | 15.8% | 17.5% |
| Incentives | About 12% of price | Not provided in research |
| Average sales price | $372,000 | Not provided in research |
| Share close | About $75.60 | $79.81 (previous close) |
Lennar targets entry-level and move-up buyers, who are highly sensitive to monthly payments. That is why each climb in mortgage rates lands directly on its margins.
The Millrose question
Millrose Properties is a real estate investment trust (REIT) affiliated with Lennar. It holds homesites, and Lennar pays option fees for the right to build on them.
As of 31 March 2025, Millrose reported $6.6 billion of homesite inventory tied to Lennar, a weighted average yield of 8.5% and an option rate of 8.7%.
Millrose’s view The company says the Lennar relationship “continues to provide a stable foundation” as it grows and diversifies. The open question is whether that stability holds if rates stay high.
No named critic or detailed published critique turned up in the research, and the panel’s information came from weekend reading. Critics of affiliate structures generally raise two concerns: whether the affiliate works as an off-balance-sheet warehouse that obscures true land exposure, and whether high option payments could drag on Lennar’s economics in a prolonged high-rate environment.
Critics argue the asset-light homebuilder model is less light than it appears, since option contracts carry non-refundable deposits and mandatory take-down schedules that behave like fixed land obligations when demand weakens.
A builder paying about 8.7% on option rates while offering 12% incentives sees its cost of staying in the market rise with every point mortgage rates climb. Weigh that before assuming a dip is a bargain. The panel host also holds a short position in Lennar.
How do traders position through a bullish call spread?
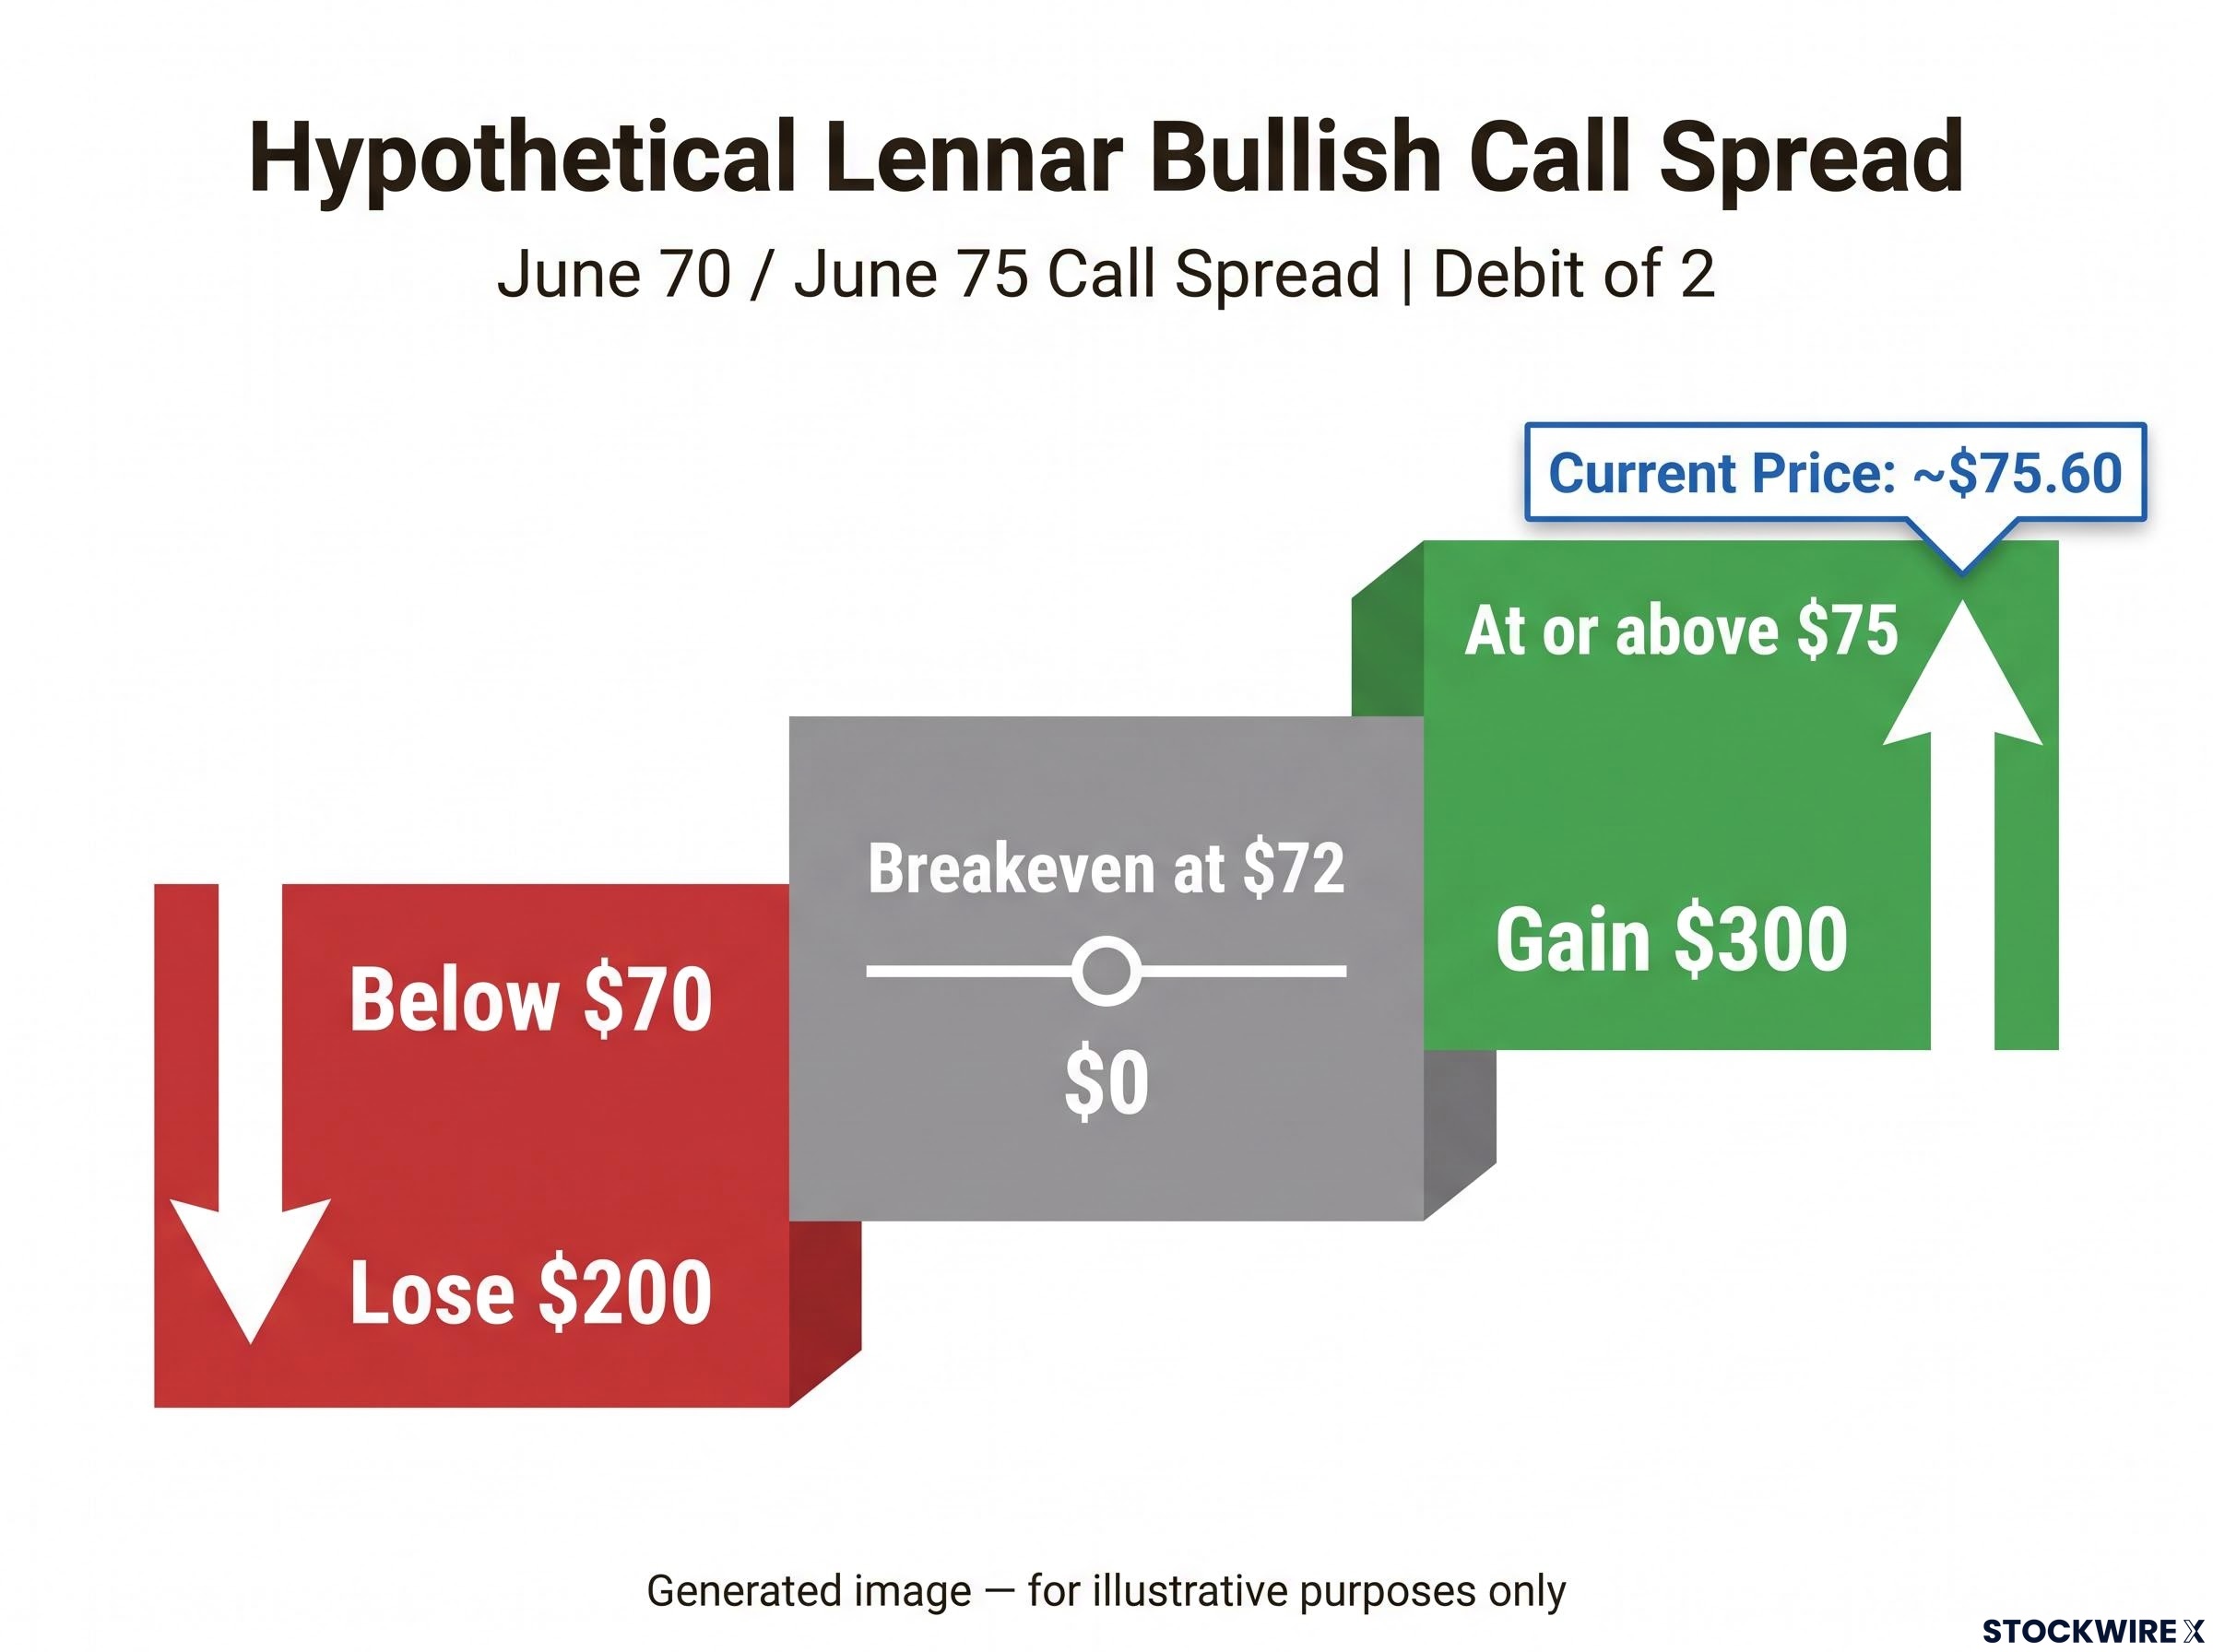
The panelist’s trade is a long-dated bullish spread: buy a June 70 call, sell a June 75 call, with the June 2027 monthly the likely expiry. It expresses a rebound view with capped risk, because the panelist expects the bond issue to last a long time.
The payoff maths uses a hypothetical net debit of 2, purely for illustration. Maximum loss is the debit paid, maximum gain is (5 minus the debit) times 100 per contract, and breakeven is 70 plus the debit, or 72 here.
- Below 70 at expiry: both calls expire worthless and you lose the full debit.
- Between 70 and 75: you gain as the stock rises, breaking even at 72.
- At or above 75: profit is capped at its maximum.
| Scenario at expiry | LEN price | Result per contract (debit of 2) |
|---|---|---|
| Below the lower strike | Below $70 | Lose $200 |
| Breakeven | $72 | $0 |
| At or above the short strike | $75 or higher | Gain $300 |
With Lennar near $75.60, the short strike sits close to the current price. The spread caps your upside near spot, so it profits only from a moderate recovery, and persistent bond stress is the scenario where the full debit is lost. The strikes here are illustrative, and this is education, not personalised advice.
What could make this trade wrong
Further yield climbs, mortgage rates pushing beyond 7.28%, deeper margin erosion or Millrose-related disclosures could all hurt. Past performance does not guarantee future results, and these scenarios are speculative and subject to change.
The bullish counter-case is real, though. Chronic housing undersupply supports sales, large builders can flex incentives and costs, and homebuilders have historically rallied hard when markets price in rate cuts.
Investors exploring protection beyond a single spread will find our dedicated guide to cheap equity hedges useful, with a worked put butterfly example priced around current volatility levels.
What the bond signal changes, and what it does not
Rising yields, a weaker euro and falling long-bond futures point to tighter conditions. Stress tends to concentrate in rate-sensitive pockets like housing before it reaches the indices.
Lennar illustrates that pattern but is one case. The same four-link chain applies to any credit-sensitive sector you hold.
Three variables are worth monitoring: the 10-year and 30-year Treasury yields, the weekly Freddie Mac mortgage rate, and the OAT-Bund spread.
This article is for informational purposes only and should not be considered financial advice. Investors should conduct their own research and consult with financial professionals before making investment decisions.