Most investors treat an ETF sitting near the bottom of its 52-week range as a bargain. FXI closed at $33.19 on 2 October 2026, and a 22-year pattern of rounded tops points toward $27, a level the fund has not yet touched.
A decades-old trend line broke in 2022 and has acted as a ceiling ever since. The question for anyone holding or considering China large-cap exposure is whether the chart is quietly signalling more downside.
Here is a way to read long-term patterns and trend lines on a single ETF, along with an honest view of where the bearish case can fail. FXI technical analysis works best when you know both what the chart says and what it cannot know.
What 22 years of rounded tops and a broken trend line show
iShares China Large-Cap ETF (FXI) tracks the FTSE China 50 Index, roughly 50 of the largest Hong Kong-listed Chinese companies. It launched on 5 October 2004, and held about $3.85 billion in assets as of 2 October 2026.
Over that history, the same shape keeps recurring. Price climbs, loses momentum gradually, rolls over and falls a long way.
Multi-year chart timeframes filter out short-term noise, which is why a 22-year view of FXI can reveal repeated rounded tops that a six-month chart would hide entirely.
- Rounded tops: repeated across two decades, each followed by a substantial decline.
- A broken trend line: a line that supported price for decades gave way in 2022.
- A resistance retest: price has since rallied to just under that line and stalled.
How rounded tops form
A rounded top is a gradual fade in buying momentum rather than a sudden spike and reversal. Buyers keep pushing prices higher, but each push is weaker, until sellers take control.
The 2007-2009 drop was the sharpest example. The mildest instance featured many false starts, yet still ended meaningfully lower.
One analyst’s reading: According to the presenter’s chart analysis, no past instance of this pattern failed to produce a decline. Treat that as one chartist’s view, not a rule.
Why the 2022 break matters
A trend line that held for decades as support, then broke in 2022, now works as resistance. On a zoomed view, the latest price peak and the line sit very close together.
That flip tells you the market has repriced what the old floor is worth. Rallies toward that line are better treated as tests than as breakouts.
When big ASX news breaks, our subscribers know first
Where is FXI now, and is 27 a realistic target?
The current structure is lower highs and lower lows. The presenter expects a multi-month slide toward about $27, with an original timeline pointing to roughly February or early the following year.
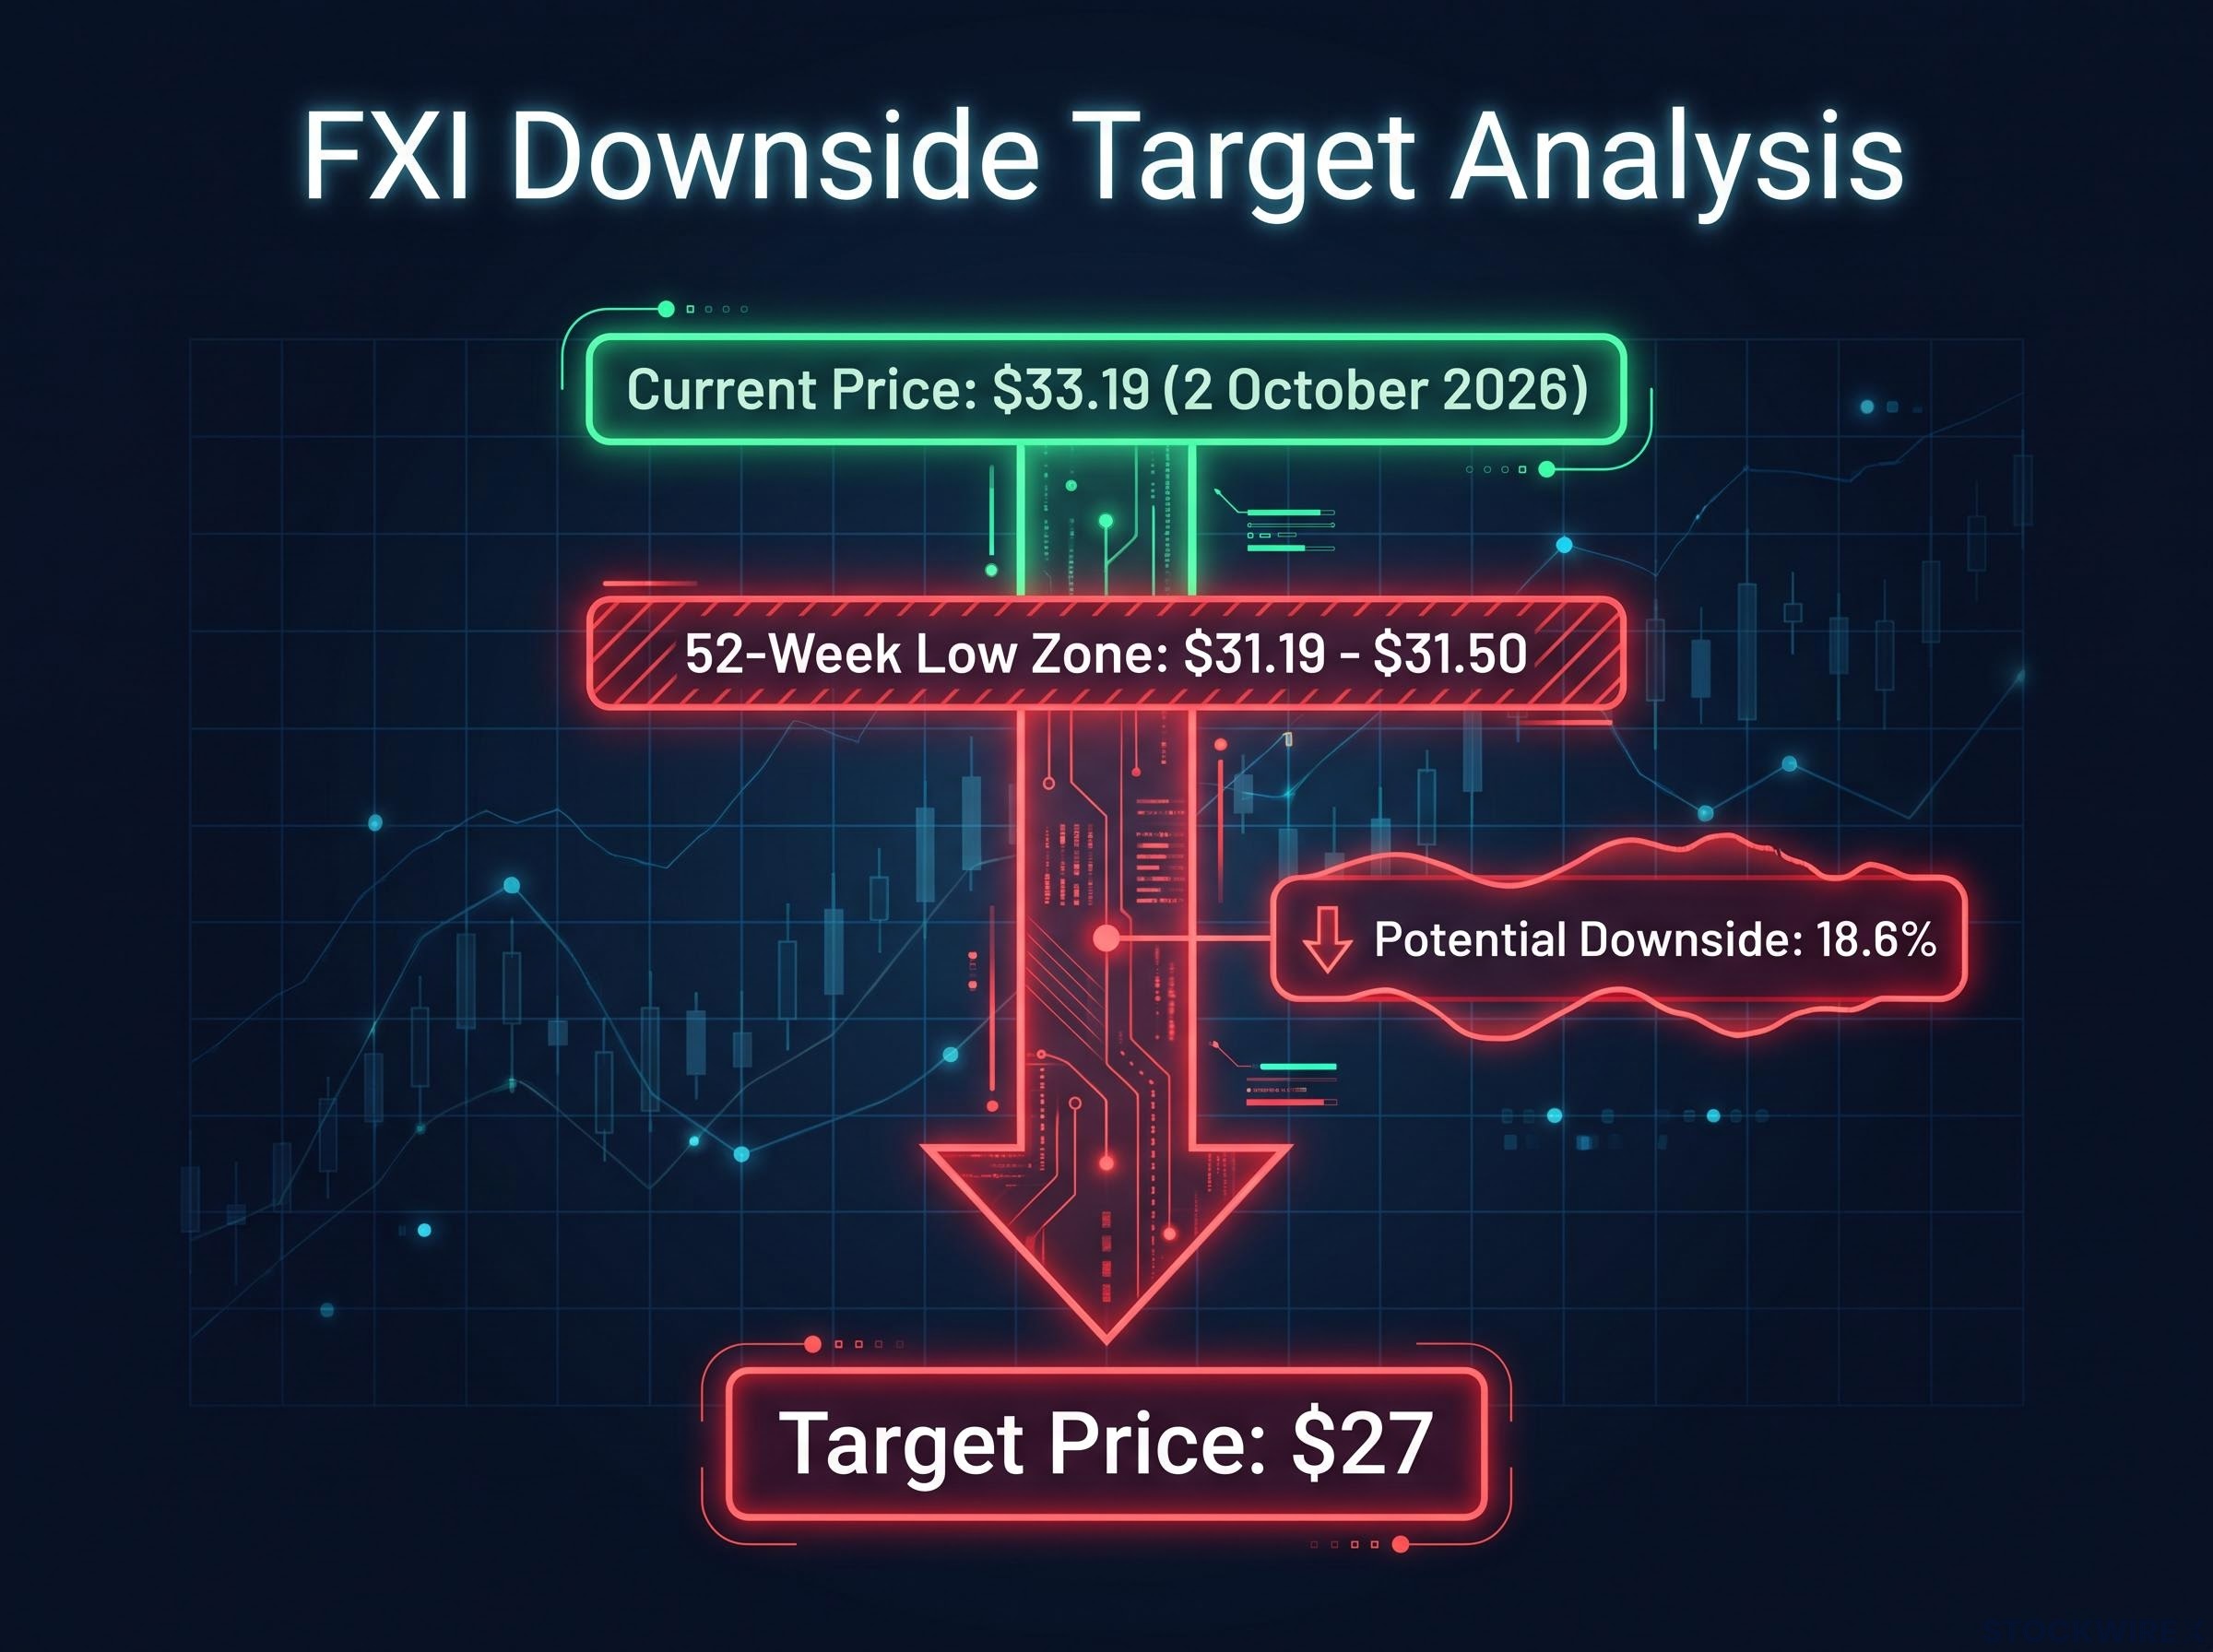
Past top-to-bottom moves took many months, and so far the price has moved from about $36 to about $34 over two months before the recording. FXI closed at $33.19 on 2 October 2026, within an intraday range of $33.08-$33.36.
The Hang Seng Index closed at 23,972 that day, down 640 points (2.6%), losing the 24,000 level. That is a weak backdrop for Hong Kong-listed large caps.
From $33.19, a move to $27 is roughly 18.6% of downside. The 52-week low sits at about $31.19-$31.50, so most of that fall has not happened.
Sources differ on the range, mainly because of NAV (net asset value) versus market-price bases and data timing.
The iShares fund data confirm the benchmark, launch date and asset base, and also publish the NAV-based 52-week range that explains why the low sits at $31.50 on the issuer’s page but nearer $31.19 on market-price feeds.
| Source | 52-week low | 52-week high |
|---|---|---|
| iShares (NAV) | 31.50 | 41.84 |
| Yahoo Finance | 31.19 | 41.55 |
| MarketBeat | 31.19 | 41.63 |
| MarketWatch / CNBC | 31.19 | 42.00 |
The gap between price and target shows how much downside the thesis requires. A target is a hypothesis to monitor, not a forecast to act on blindly. Three conditions would strengthen or weaken it:
- A lower low below $31.19.
- A rejection at the broken trend line.
- Continued Hang Seng weakness.
Why China’s low correlation with US stocks is real but conditional
The appeal is easy to see. The presenter overlaid SPY, the S&P 500 ETF, on FXI and found the two moved largely independently, resembling each other only in very large moves.
History adds a warning. In 2007-2009, FXI collapsed with global markets despite different domestic fundamentals.
| Episode | Driver | Correlation behaviour | Diversification result |
|---|---|---|---|
| 2007-2009 | Global financial crisis | Spiked | Limited protection |
| 2015 | A-share bubble and crash, driven by margin financing and retail speculation | Domestic leverage cycle dominated | Technical levels failed |
| 2021-2022 | Regulatory crackdown | Independent on regulatory news, higher in global risk-off | Mixed |
No realised correlation statistics for 2025-2026 were found, so none are cited here.
Takeaway: FXI’s low correlation to US markets is real but conditional.
For you, that means FXI may cushion a US-specific shock but should not be counted on as a hedge when all risk assets fall together.
What could break the bearish setup
The chart carries conviction, but policy can override it. Stimulus, regulatory easing or state-linked “National Team” buying can push price back above broken trend lines, sometimes abruptly.
Policy support has not materialised so far, with the PBoC’s no-easing stance following a record credit miss in August, which weakens the case for an abrupt stimulus-driven rally.
Long-history charts also have structural limits. Index composition has shifted toward technology and consumer names, FXI is quoted in US dollars while its holdings are influenced by HKD and CNY, and about 50 names mean a few mega-caps can dominate.
| Risk | How it can override the chart | Practical response |
|---|---|---|
| Policy surprise | Stimulus or state buying lifts price above resistance | Define an invalidation level |
| Short squeeze | Crowded bearish trades unwind on minor good news | Size the position to survive a sharp rally |
| Composition and currency | Moves reflect index changes or currency, not sentiment | Treat old trend lines with caution |
Institutional opinion is split, and the commentary below is generalised and dated through 2024.
- Bullish: Goldman Sachs, UBS and JPMorgan have periodically cited deep valuation discounts, alongside policy support and a shift toward technology and consumer.
- Bearish: Property overhang, regulation and geopolitics, demographics and disinflation, and foreign outflows.
The chart sets the odds, but policy sets the timing.
A framework for applying this to your own chart work
The method transfers to other single-ETF trades:
- Identify repeated tops.
- Mark the long-term trend line.
- Note any support-to-resistance flip.
- Confirm lower highs and lower lows.
- Set a target and an invalidation level.
Weighing the 27 target against the risks you can actually size
The long-term pattern, the 2022 trend-line flip and the lower-high structure all lean bearish. The untested $27 target and policy risk keep the outcome open.
Three variables help you decide whether FXI fits your view: a break below the $31.19-$31.50 zone, a rejection at the broken trend line, and any policy shift that changes the narrative.
Technical analysis is conditional on macro and policy context, not an independent forecasting tool. These statements are speculative and subject to change based on market developments, and past performance does not guarantee future results.
This article is for informational purposes only and should not be considered financial advice. Investors should conduct their own research and consult with financial professionals before making investment decisions.