The arithmetic of the current artificial intelligence (AI) build-out does not resolve the way most investors assume it should. The four largest US hyperscalers are guiding to roughly $720-745 billion in combined capital expenditure in 2026, and Bank of America projects that aggregate free cash flow across the major AI-exposed firms will swing from around +$180 billion in 2025 to approximately negative $64 billion in 2026.
That capital is building infrastructure that mostly benefits someone else. A user paying a modest monthly subscription to an AI lab that lost tens of billions last year is receiving a heavily subsidised service.
The real question for a finance-literate reader is not whether AI is real. It plainly is. The question is who captures the surplus it creates, and the counterintuitive answer running through the hyperscalers, the frontier labs, and even the altcoin market is that it is not the companies spending the money.
What follows is a practical map of where the money is actually going, and where it is not. By the time you finish, you should be able to sort any AI-adjacent investment into one of three buckets: value creators for customers, value destroyers for shareholders, or structurally obsolete, and know which variables to watch next.
The free cash flow squeeze hiding inside the AI capex boom
Start with the scale. Combined 2026 capital expenditure guidance for Amazon, Alphabet, Microsoft, and Meta has reached roughly $720-745 billion, up approximately 77% from the $410 billion spent across the group in 2025.
That spending is outrunning the cash these businesses generate. Across Microsoft, Alphabet, Amazon, Meta, and Oracle, capex is projected to rise by about $534 billion between 2025 and 2027, against only a $340 billion increase in operating cash flow over the same window. The gap has to be funded somewhere, and increasingly that somewhere is debt.
Bank of America’s forecast captures the inflection most sharply.
Goldman Sachs placed the AI capex vs monetisation gap in starker terms still, projecting that hyperscaler spending will consume 93-94% of operating cash flow in 2026, up from 33-40% in 2022-2023, leaving almost no room for buybacks, dividends, or financial flexibility.
Aggregate free cash flow across eight major AI-exposed companies is projected to swing from an estimated +$180 billion in 2025 to roughly negative $64 billion in 2026, with further deterioration expected across 2027-2028.
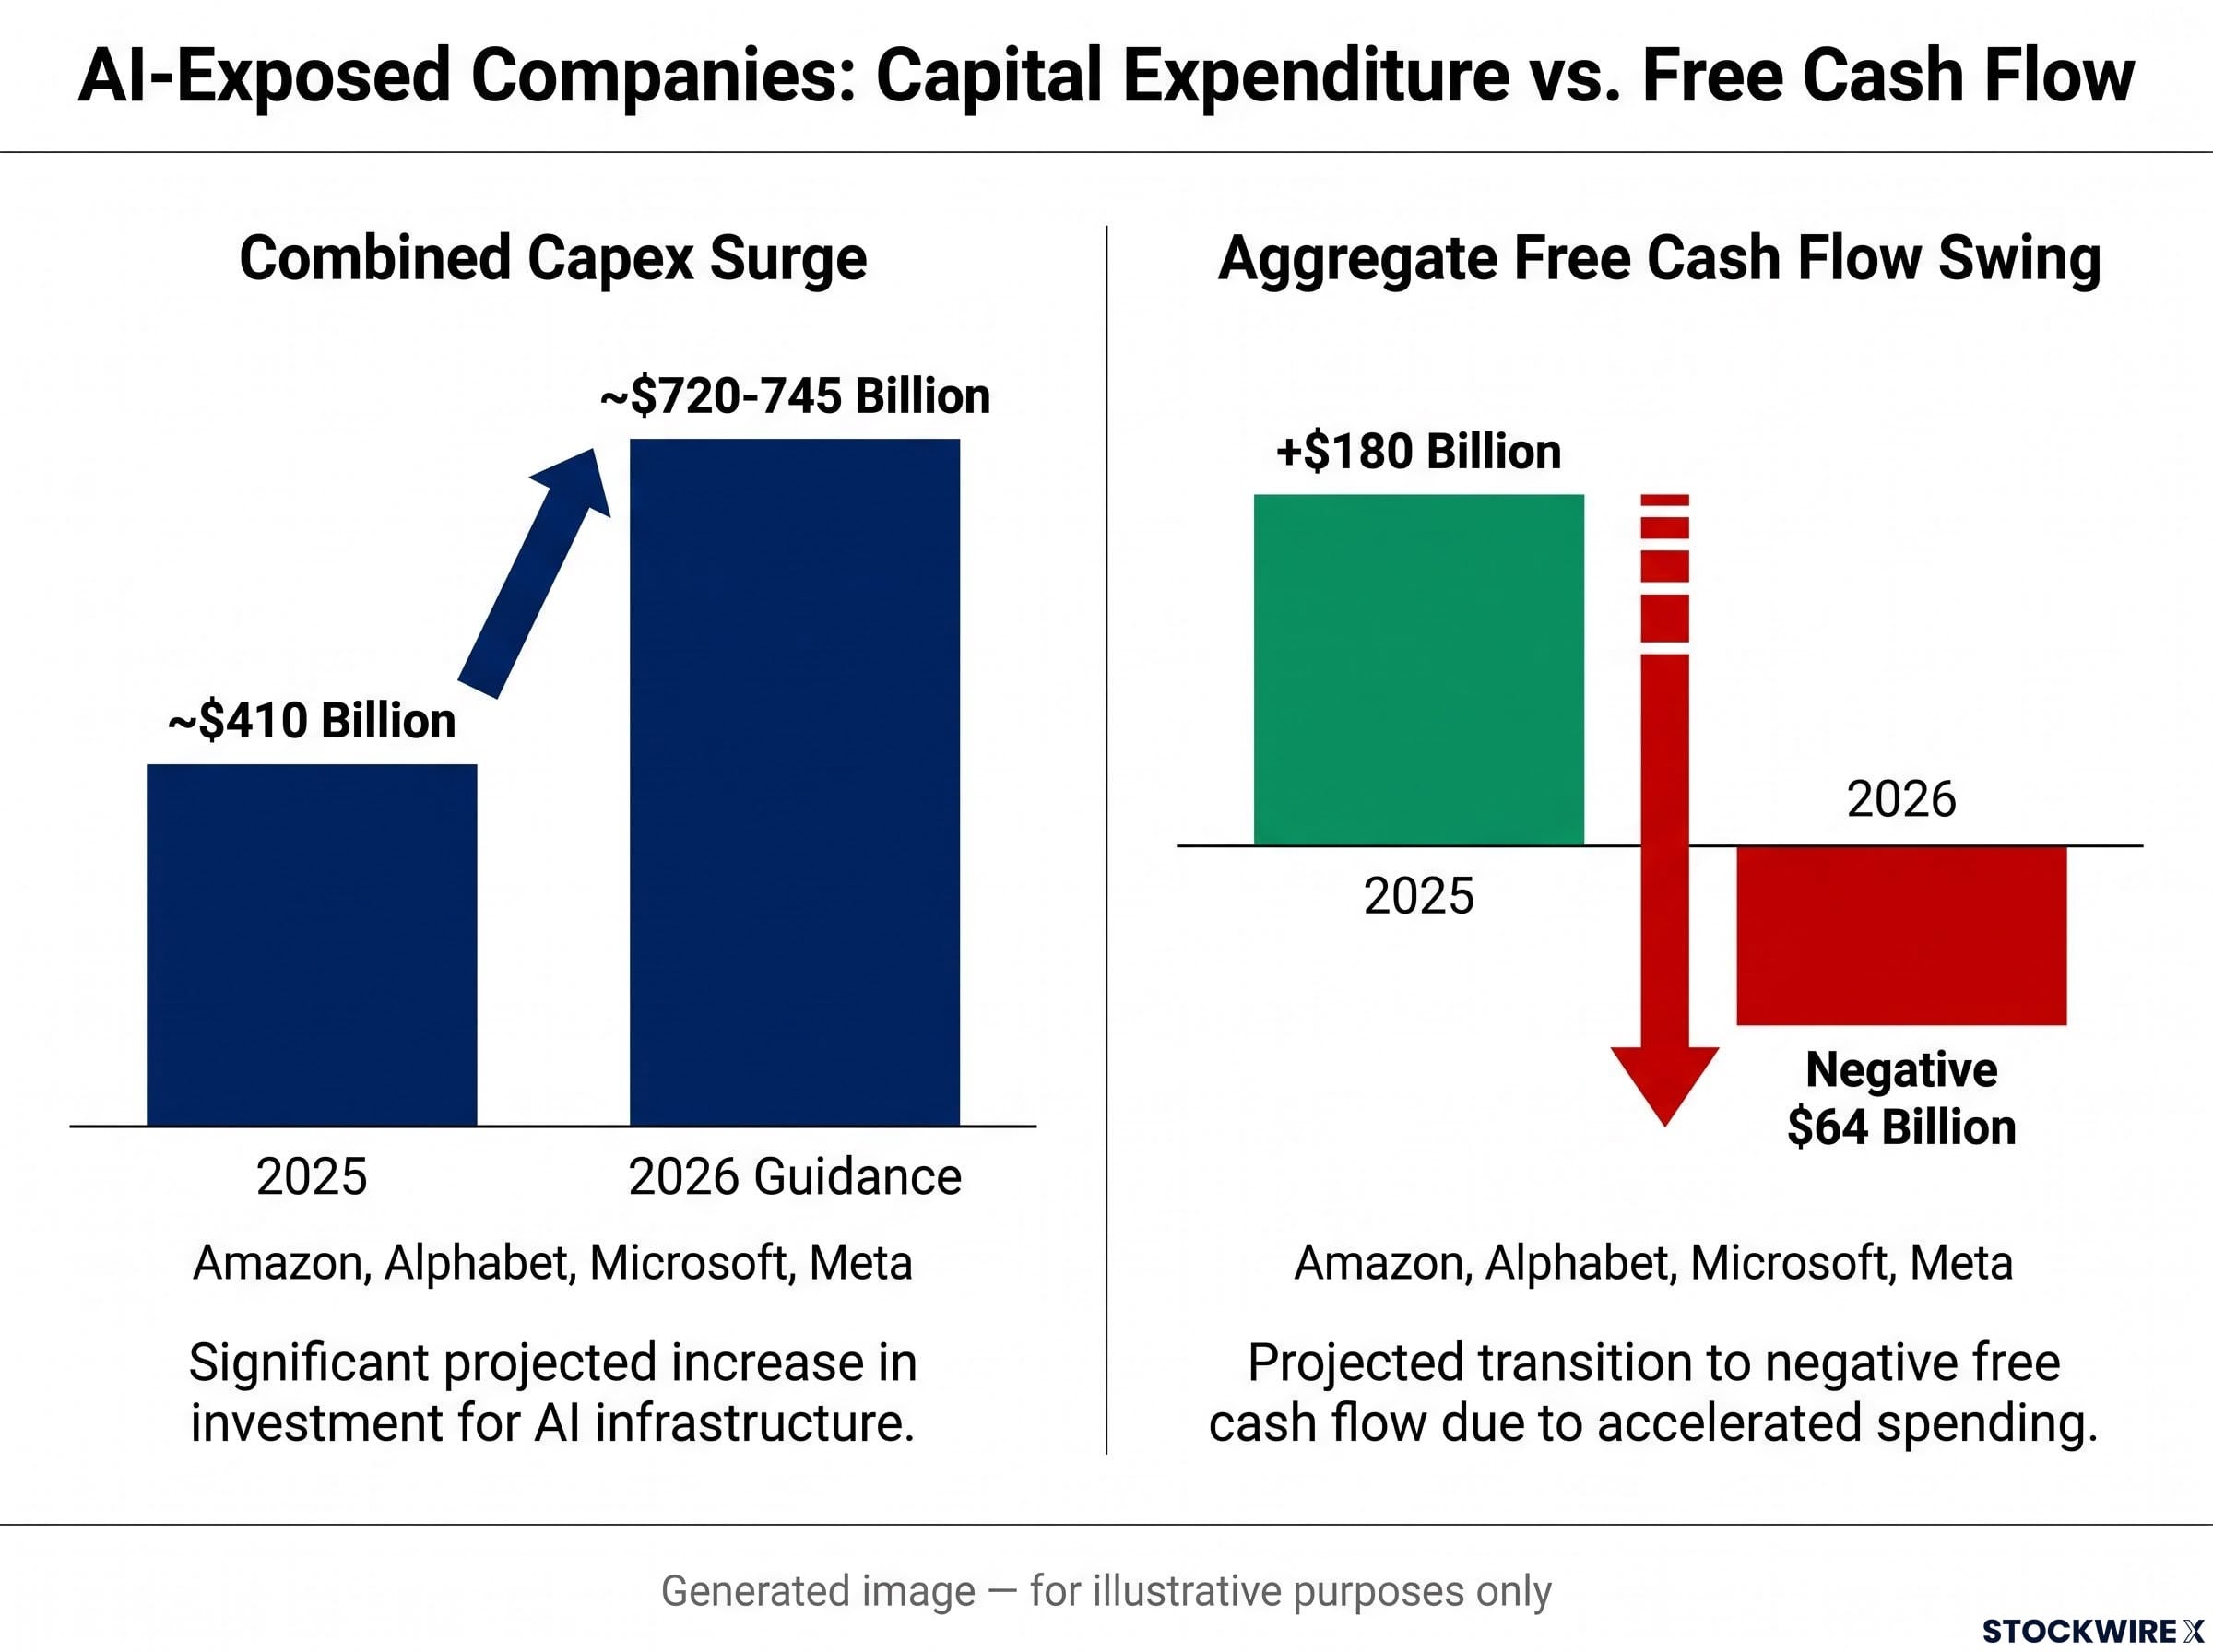
A consensus-estimate synthesis puts AI capex at close to 94% of operating cash flow after dividends and buybacks across the group in 2025-2026, with the shortfall plugged by borrowing. That is the “debt trap” risk in plain terms: if monetisation does not catch up to the spending, shareholders are financing a build-out whose payback is measured in years, not quarters. The swing from strongly positive to deeply negative free cash flow tells you this spending has crossed from opportunistic to obligatory. No major player can step back without ceding ground, which means the cost of the infrastructure sits on shareholders while the benefit flows to customers.
Company by company, the same pressure
| Company | 2025 Capex | 2026 Capex Guidance | 2025 Free Cash Flow | Direction of Travel |
|---|---|---|---|---|
| Alphabet | ~$80-91B | $195-205B | ~$73.3B | Q2 2026 FCF turned negative (~-$5.9B) |
| Amazon | Property/equipment up ~$50.7B YoY | Rising | ~$11.2B (down from $38.2B) | TTM FCF now ~-$7.6B |
| Microsoft | ~$94B | ~$175B | Pressured | 4-year AI spend to exceed $300B |
| Meta | $72B | $130-145B | ~$43.6B | Projected to fall to ~$8.5B |
| Group total | ~$410B | ~$720-745B | Net positive | BofA sees group swing to negative FCF |
The pattern repeats across different balance sheets and business models. Amazon’s free cash flow fell from $38.2 billion to roughly $11.2 billion in 2025, and on a trailing twelve-month basis it has since turned negative at around negative $7.6 billion, even as operating cash flow climbed about 30% to $148.5 billion.
Alphabet generated roughly $73.3 billion of free cash flow in 2025, yet its 2026 guidance of $195-205 billion dwarfs that figure, and it recorded negative quarterly free cash flow of about negative $5.9 billion in Q2 2026. Meta’s free cash flow is projected to collapse from $43.6 billion toward $8.5 billion.
Microsoft is lifting AI capex toward $175 billion this year against slower-than-expected monetisation. Four companies, four capital structures, one outcome: cash generation is being consumed by the build-out, and the equity holder is the one absorbing the squeeze.
When big ASX news breaks, our subscribers know first
Frontier labs are subsidising their own customers
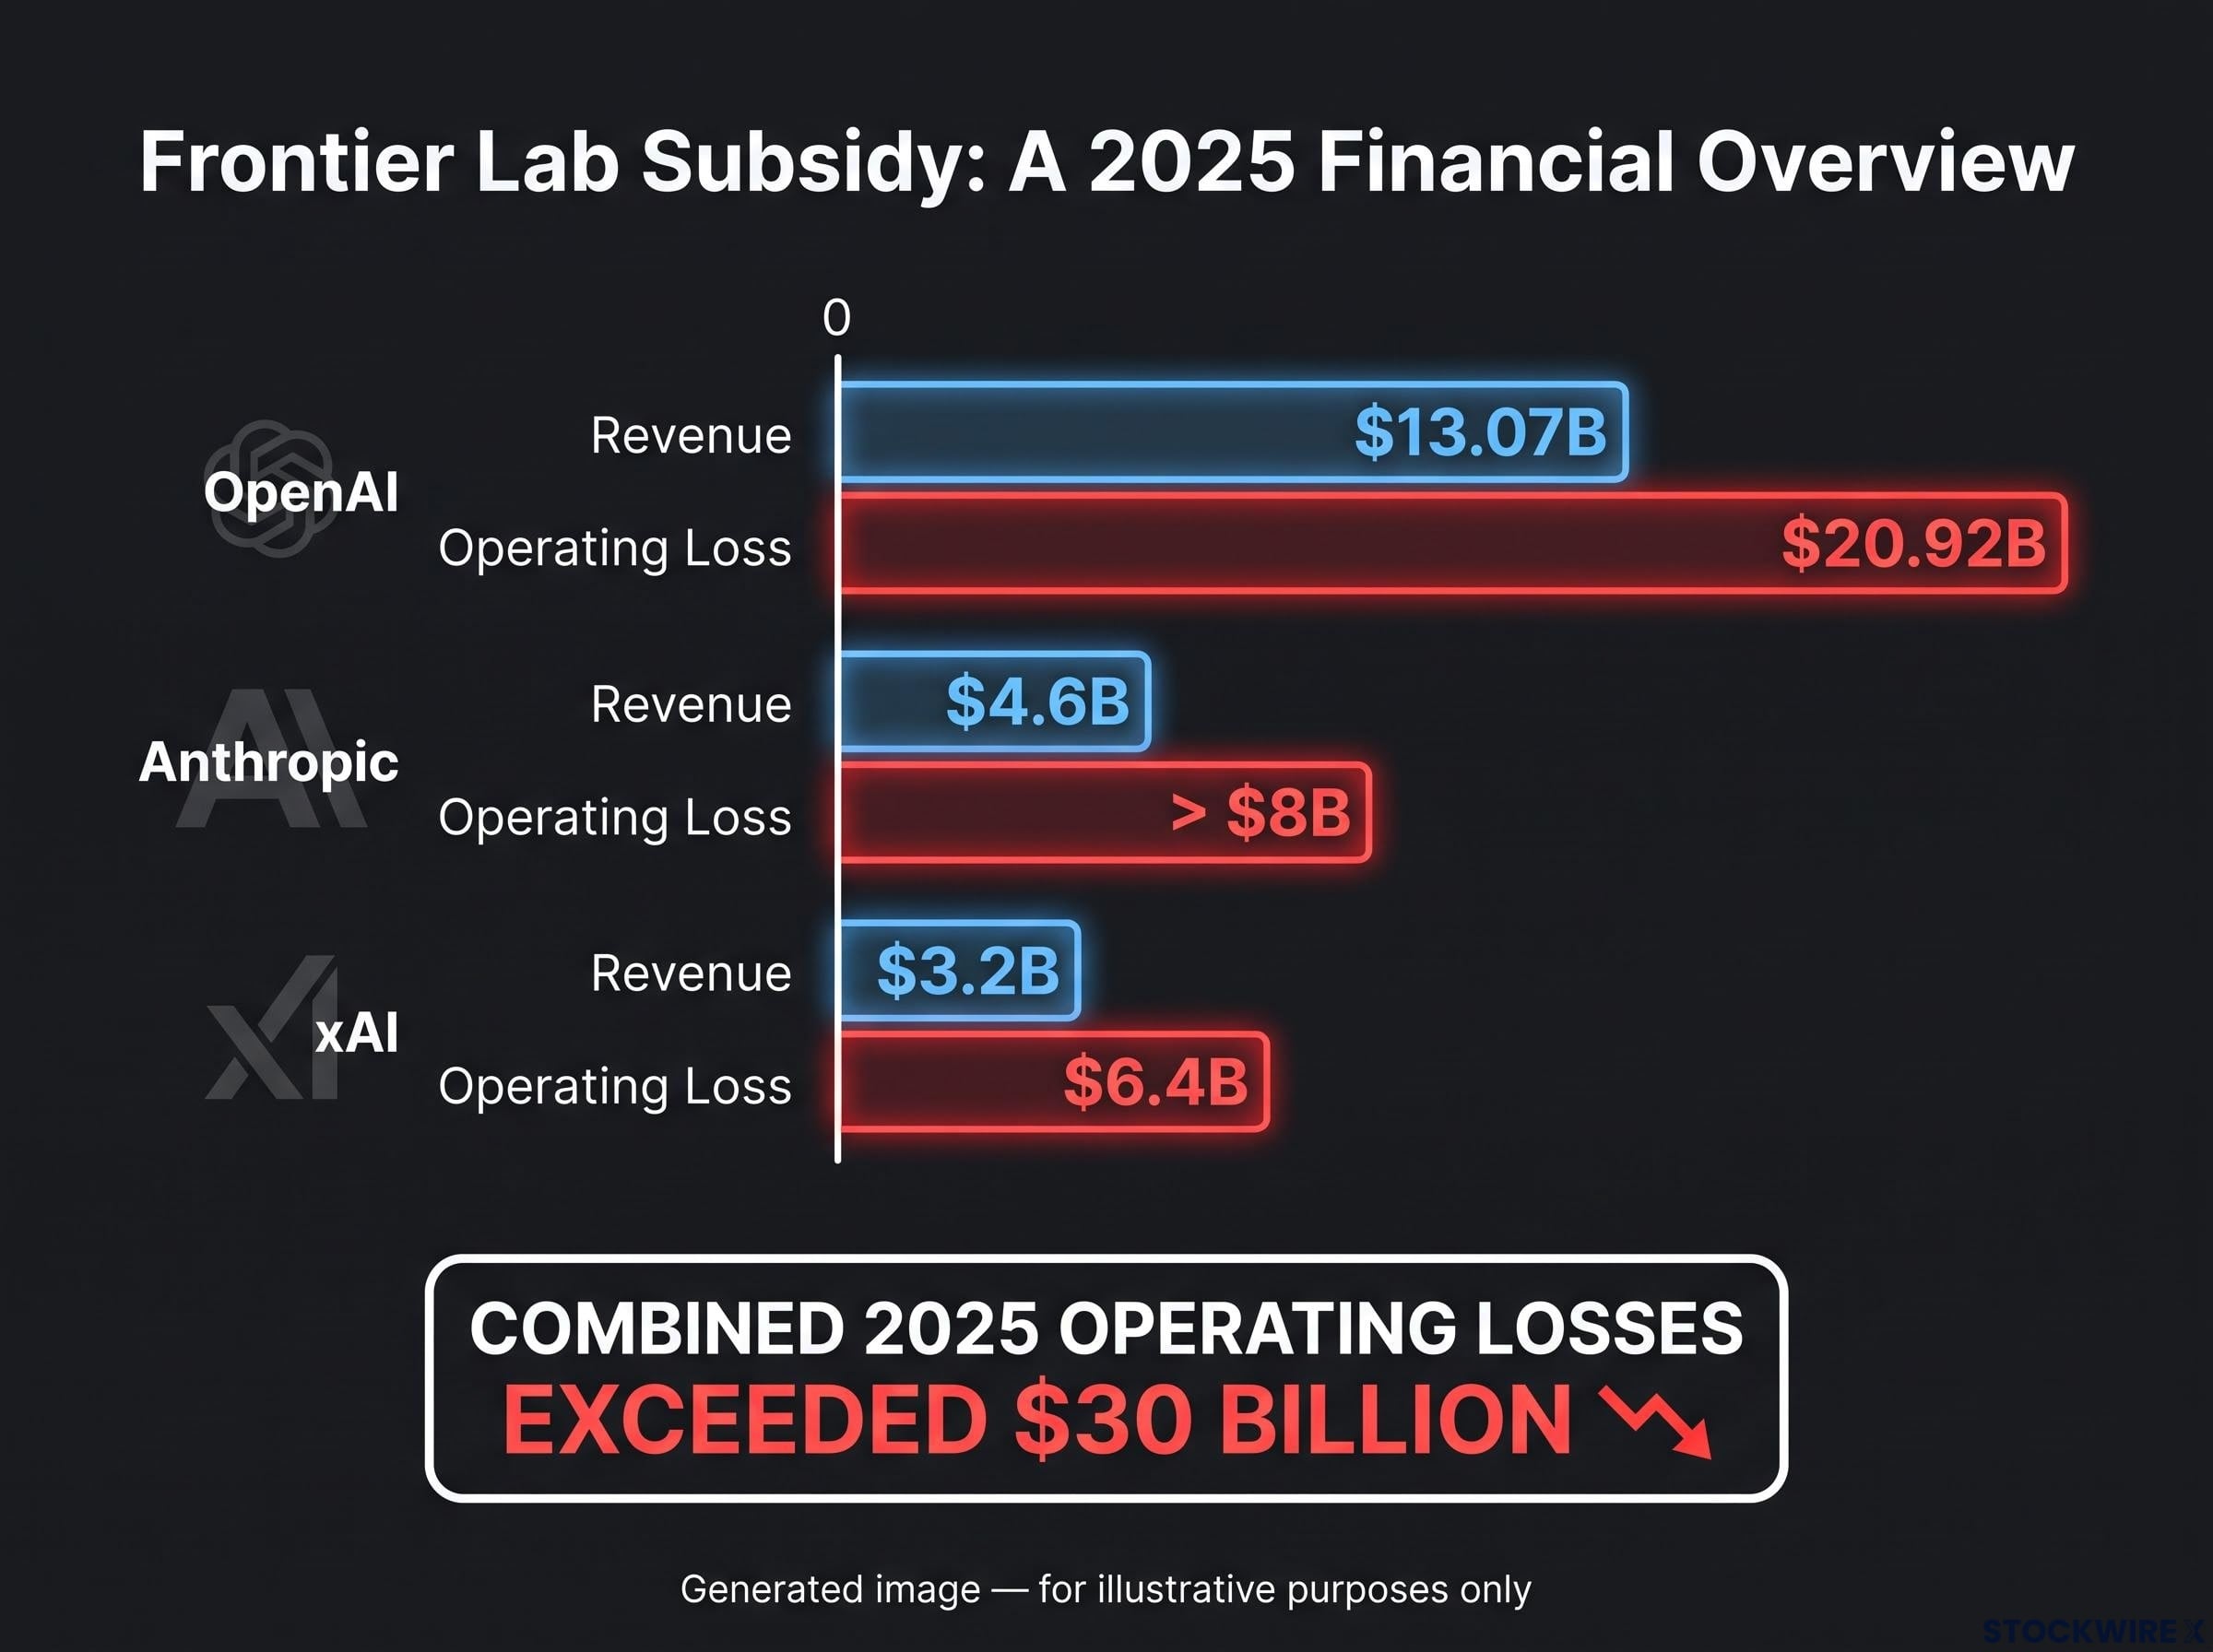
The frontier labs look like a failure story until you read them correctly. Across OpenAI, Anthropic, and xAI, combined operating losses in 2025 exceeded $30 billion on combined revenues in the low-to-mid teens of billions. The losses comfortably outran the revenues.
That is not simply a business losing money. It is a transfer mechanism. Every customer buying inference at a price that does not cover its cost is receiving a subsidy, and the labs are financing it through venture capital and strategic investment.
| Lab | 2025 Revenue | 2025 Operating Loss | Key Financing Metric |
|---|---|---|---|
| OpenAI | ~$13.07B | ~$20.92B | ~$122B raised (March 2026) at ~$730B valuation |
| Anthropic | ~$4.6B | >$8B | >$64B total funding; $518B future compute obligations |
| xAI | ~$3.2B (directionally indicative) | ~$6.4B (directionally indicative) | Figures conflict across sources |
Anthropic’s IPO prospectus, released in September 2026 and reported by Reuters, is the clearest case. The company grew revenue roughly twelvefold to nearly $4.6 billion in 2025, yet booked more than $8 billion in operating losses and a $42 billion GAAP net loss. Most of that headline figure is a non-cash accounting charge of about $34 billion tied to the value of convertible financing, not a cash burn, but the operating loss alone is real.
Anthropic has committed to approximately $518 billion in future cloud, computing, and infrastructure obligations, against 2025 revenue of nearly $4.6 billion.
The GAAP-versus-cash distinction matters at OpenAI too. Its 2025 GAAP net loss of roughly $38.5-39 billion includes a non-cash charge of about $30-41 billion related to its for-profit conversion; the adjusted cash operating loss is nearer $8 billion. Still substantial against $13.07 billion in revenue, and OpenAI paid Microsoft around $17.2 billion for compute in 2025 alone.
Here is why the subsidy is durable in the near term. Open-weight model alternatives, rapid benchmark progress, and fierce competition are commoditising the model layer. That commoditisation caps what any lab can charge. If OpenAI or Anthropic raises prices aggressively, customers defect to cheaper or open alternatives. So the subsidy to end users holds precisely because the labs cannot escape it, even as it remains unsustainable for the investors financing it.
Open-weight model pricing is the structural mechanism enforcing that ceiling: median open-weight API costs run at approximately $0.53 per million tokens versus $2.41 for proprietary models, a roughly 78% discount that pulls market-wide pricing downward regardless of whether enterprises self-host.
What the altcoin market cap plateau actually signals
The altcoin market looks like it has recovered. Aggregate altcoin market capitalisation reached roughly $1.5-1.65 trillion in early 2025, nearly matching the 2021 cycle peak, and Google Trends data showed cryptocurrency search volumes running about 190% higher than the prior year.
On the surface, that reads as renewed demand. The structure underneath says otherwise.
Venture capital funding volumes and the number of funded projects are materially lower than in 2021, even though aggregate prices have retraced to similar levels. Capital is more concentrated and more engineered. Many 2024-2025 projects launched at fully-diluted valuations of $1-5 billion while floating only 5-10% of tokens at launch, a low-float, high-FDV structure rather than broad retail inflow. Treat those launch mechanics as directionally indicative rather than precisely verified, but the direction is clear: similar prices are now spread across more tokens backed by a thinner demand base.
High-FDV, low-float mechanics and what they mean for retail holders
Fully-diluted valuation (FDV) is the token price multiplied by the total eventual supply, not just the portion trading today. When only 5-10% of tokens circulate at launch, early insiders and funds set the price against scarce float, then face selling pressure as lockups expire. Retail holders who buy into the tight early float tend to absorb that pressure.
AI-driven on-chain analytics sharpen this imbalance. These tools make whale positioning and liquidity visible to sophisticated participants while retail holders rarely have the same read, concentrating the downside in the least-informed hands.
The deeper structural change from 2021 is the interest rate backdrop. The zero interest rate environment that fuelled the last altcoin cycle has been replaced by one of real positive rates, and that puts decentralised finance (DeFi) yield in direct competition with conventional interest-bearing instruments.
A 5% annual DeFi yield implies a roughly 20-year return profile, during which a single smart-contract exploit could wipe out principal, a risk conventional instruments simply do not carry.
Not everything in crypto sits inside this bearish read. Three categories deserve separate treatment:
- Bitcoin and store-of-value assets: explicitly outside this assessment, occupying a different risk and return profile.
- Altcoins and VC-coin tokens: flat aggregate prices, weaker VC support, and high-FDV mechanics point to 2021 as the structural high watermark rather than a launchpad.
- Tokenised real-world assets: a distinct category, viewed more favourably, particularly for users in countries with limited access to global capital markets.
For a reader holding altcoins, the implication is that price recovery may be a distribution event rather than the start of a new cycle. The macro conditions that created the last run are gone.
Where AI value is actually going: the end-user and enterprise capture thesis
Put the previous three sections together and the positive case assembles itself. Labs are absorbing operating losses. Hyperscalers are burning free cash flow. Altcoins are stuck. In each case the surplus is leaving the asset you might think to buy.
So where does it land? With whoever uses the services cheaply. Enterprises and individuals integrating AI into operations are receiving tools priced below cost, and the combined lab operating losses exceeding $30 billion on low-to-mid-teens-of-billions revenue in 2025 is the quantified scale of that subsidy.
Lyn Alden, founder of Lyn Alden Investment Strategy, has argued that end users and businesses integrating AI into operations are the likely primary beneficiaries of this wave. The best-positioned adopters are businesses with locked-in, defensible customer relationships that can lower their internal cost base without handing the saving to competitors. Research cites AI compressing costs in white-collar services such as translation and editing while widening access to them.
AI-native enterprise pricing models are already converting the subsidy into visible competitive disruption: startups are entering enterprise markets at 80-90% discounts to incumbent SaaS costs, forcing analytical software vendors into a repricing cycle that favours consumption-based billing over seat licences.
That points to a useful three-bucket framework:
- AI infrastructure providers: high capex, compressed free cash flow, long payback. Watch for free cash flow stabilisation as the signal the cycle is peaking.
- AI end-user adopters and integrators: access to subsidised tools, margin expansion potential, lower capital intensity. Watch for evidence of cost compression converting into retained margin.
- Crypto and adjacent digital assets: mostly structurally challenged, with Bitcoin, stablecoins, and tokenised real-world assets as distinct exceptions. Watch VC activity as the leading demand signal.
The historical parallel sharpens the point. The dot-com fibre-optic build-out of the late 1990s generated enormous infrastructure investment with thin near-term returns for the builders, while enabling a decade of internet business models built on top. The question is whether you want to own the infrastructure or the businesses running on it.
The risk to this thesis is concentration. Steve Eisman has warned that the collapse of a major AI company such as OpenAI could carry systemic economic consequences, a reminder that the subsidy enabling the end-user case rests on a small number of heavily funded players.
AI regulatory capture risk adds a second systemic variable alongside concentration: the three largest frontier labs are quietly building a FINRA-style self-regulatory body, a jurisdictional move that either builds compliance moats around incumbents or invites direct government intervention that compresses valuations across the sector.
Software agents before physical robots: why the timeline matters for investors
Software capabilities are advancing faster than expected, while capable physical robotics are likely to take longer, because real-world environments are categorically harder than digital ones. The persistent struggle to make robotic vacuum cleaners ubiquitous despite decades of development illustrates how hard even simple physical tasks remain.
For investors, the read is that productivity gains from autonomous software agents, systems executing multi-step tasks on their own, will arrive before gains from physical automation. That favours businesses deploying software-based AI workflows over those banking on hardware-based automation to lift output.
Making a durable call when the infrastructure cycle and the hype cycle overlap
The bearish framing has a serious counter-argument, and it deserves fair weight. Alphabet’s $195-205 billion in 2026 capex is anchored in Google Cloud revenue backlogs and the defence of search dominance, not speculative excess. At the level of the economy, the infrastructure bet is rational: AI capability will expand and be used.
The harder question is not whether the investment is sensible but whether it is correctly priced into current equity valuations. The economy-level bet and the stock-level bet are two different things. The $534 billion projected capex increase against a $340 billion operating cash flow increase between 2025 and 2027 is exactly where that tension lives.
Three variables will tell you which way the framework should tilt over time:
- Monetisation velocity at frontier labs: whether revenue growth can approach the scale of operating losses within a two-to-three-year window.
- Hyperscaler free cash flow recovery: a return toward positive group free cash flow would signal the capex cycle is peaking.
- Crypto VC activity: rising funding and project counts would signal genuine demand recovery rather than financial engineering.
In a commoditisation cycle, the surplus flows through the infrastructure to the user. The investor’s job is to be on the user side of that transfer, not the infrastructure side.
This framework is not bearish on AI as a technology. It is cautious on the equity of infrastructure providers relative to the equity of businesses integrating AI cheaply, and that distinction will remain the core sorting mechanism until monetisation data changes the calculus. The infrastructure investors of the late 1990s were not wrong about the internet. They were wrong about the payback timeline.
This article is for informational purposes only and should not be considered financial advice. Investors should conduct their own research and consult with financial professionals before making investment decisions. Past performance does not guarantee future results, and financial projections are subject to market conditions and various risk factors. These statements are speculative and subject to change based on market developments and company performance.