
You pull up a ticker, spot an IV Rank reading up near the top of the scale, and sell premium thinking the environment is rich. Weeks later you realise the number was lying to you. A single volatility spike six months ago reset the ceiling of the 52-week range, and ever since, every reading has looked artificially low. The premium you ignored last month was richer than the one you just sold.
This is the trap waiting for anyone learning to screen for options-selling opportunities. If you trade on platforms like Tastytrade or thinkorswim, you see both IV Rank and IV Percentile sitting side by side, and most traders do not know which number to trust or why the two sometimes disagree by a wide margin.
The stakes are practical. Misreading volatility context means selling premium when it is not actually rich, or walking past a genuine opportunity because one metric is compressed.
Here is what each metric is really measuring, why they sometimes contradict each other, and which one to lean on when they do.
What IV Rank and IV Percentile are actually measuring
Both metrics give you a number between 0 and 100. That is where the similarity ends. Behind those identical-looking readings sit two completely different mechanical processes, and until you understand how each one produces its figure, you cannot compare them fairly.
Both metrics ultimately express something about implied volatility basics, specifically where current collective market expectations about future price movement sit relative to history, which is why misreading either number has direct consequences for premium pricing and strategy selection.
How IV Rank positions current volatility within its annual band
IV Rank answers one question: where does today’s implied volatility sit between its highest and lowest points over the past year?
The highest implied volatility reading in the prior 52 weeks sets the ceiling. The lowest sets the floor. Current IV is then expressed as a position between them, using the formula documented by Tastytrade and mirrored across retail options education:
IV Rank = (Current IV − 52-Week IV Low) ÷ (52-Week IV High − 52-Week IV Low) × 100
A reading of 50 means current IV sits exactly at the midpoint of its annual range. A reading approaching 100 means IV is near the top of that band. And the scale can break its own boundaries: a reading above 100 signals a new 52-week high is being set, while a reading below zero signals a new 52-week low.
Tastytrade’s IV Rank formula, published in its official Help Center documentation, confirms the calculation: current IV minus the 52-week low, divided by the difference between the 52-week high and low, multiplied by 100, with IV Percentile defined separately as the count of days where IV was lower than today’s level divided by 252.
How IV Percentile counts days instead of measuring distance
IV Percentile asks something entirely different: on what proportion of the past year’s trading days was implied volatility lower than it is today?
Instead of measuring distance within a range, it counts days. The standard formula, documented by TradeAlgo and Schwab’s thinkorswim materials:
IV Percentile = (Days with IV below today’s level ÷ Total days in lookback window) × 100
The standard lookback window is 252 trading days, roughly one calendar year, per thinkorswim community scripts. An equivalent community formula, countBelow divided by countAbove plus countBelow, produces the same result.
This is the root of every disagreement between the two. One is a range-position tool. The other is a frequency tool. Choosing between them is really a choice about which question is more useful for your screening purpose.
| Dimension | IV Rank | IV Percentile |
|---|---|---|
| What it measures | Position of current IV within its 52-week high-low range | Proportion of days IV was below today’s level |
| Formula inputs | Current IV, 52-week IV high, 52-week IV low | Count of days below today, total days in window |
| What a reading of 80 means | Current IV sits 80% of the way up its annual range | IV was lower than today on 80% of past days |
| Lookback mechanism | Two extreme points (the high and the low) | Every single day counted equally |
When big ASX news breaks, our subscribers know first
The spike problem that makes IV Rank unreliable
Here is where IV Rank starts to work against you. Because the metric is anchored to just two numbers, the 52-week high and the 52-week low, a single extreme event can poison the entire scale for a year.
Think through the mechanism. When implied volatility spikes hard, even for a few days, that spike sets a new 52-week high. That high becomes the denominator in the IV Rank formula. Enlarge the denominator, and every reading that follows gets compressed, even if volatility stays genuinely elevated relative to most of the year.
Consider a concrete case. Say a stock’s IV normally ranges between 20 and 40. With current IV at 35, IV Rank would read 75, signalling a rich environment.
Now a brief spike pushes the 52-week high to 80. Nothing has changed in the current volatility environment. Current IV is still 35. But the IV Rank formula now reads 25, because the ceiling moved. The same conditions that looked rich now look middling.
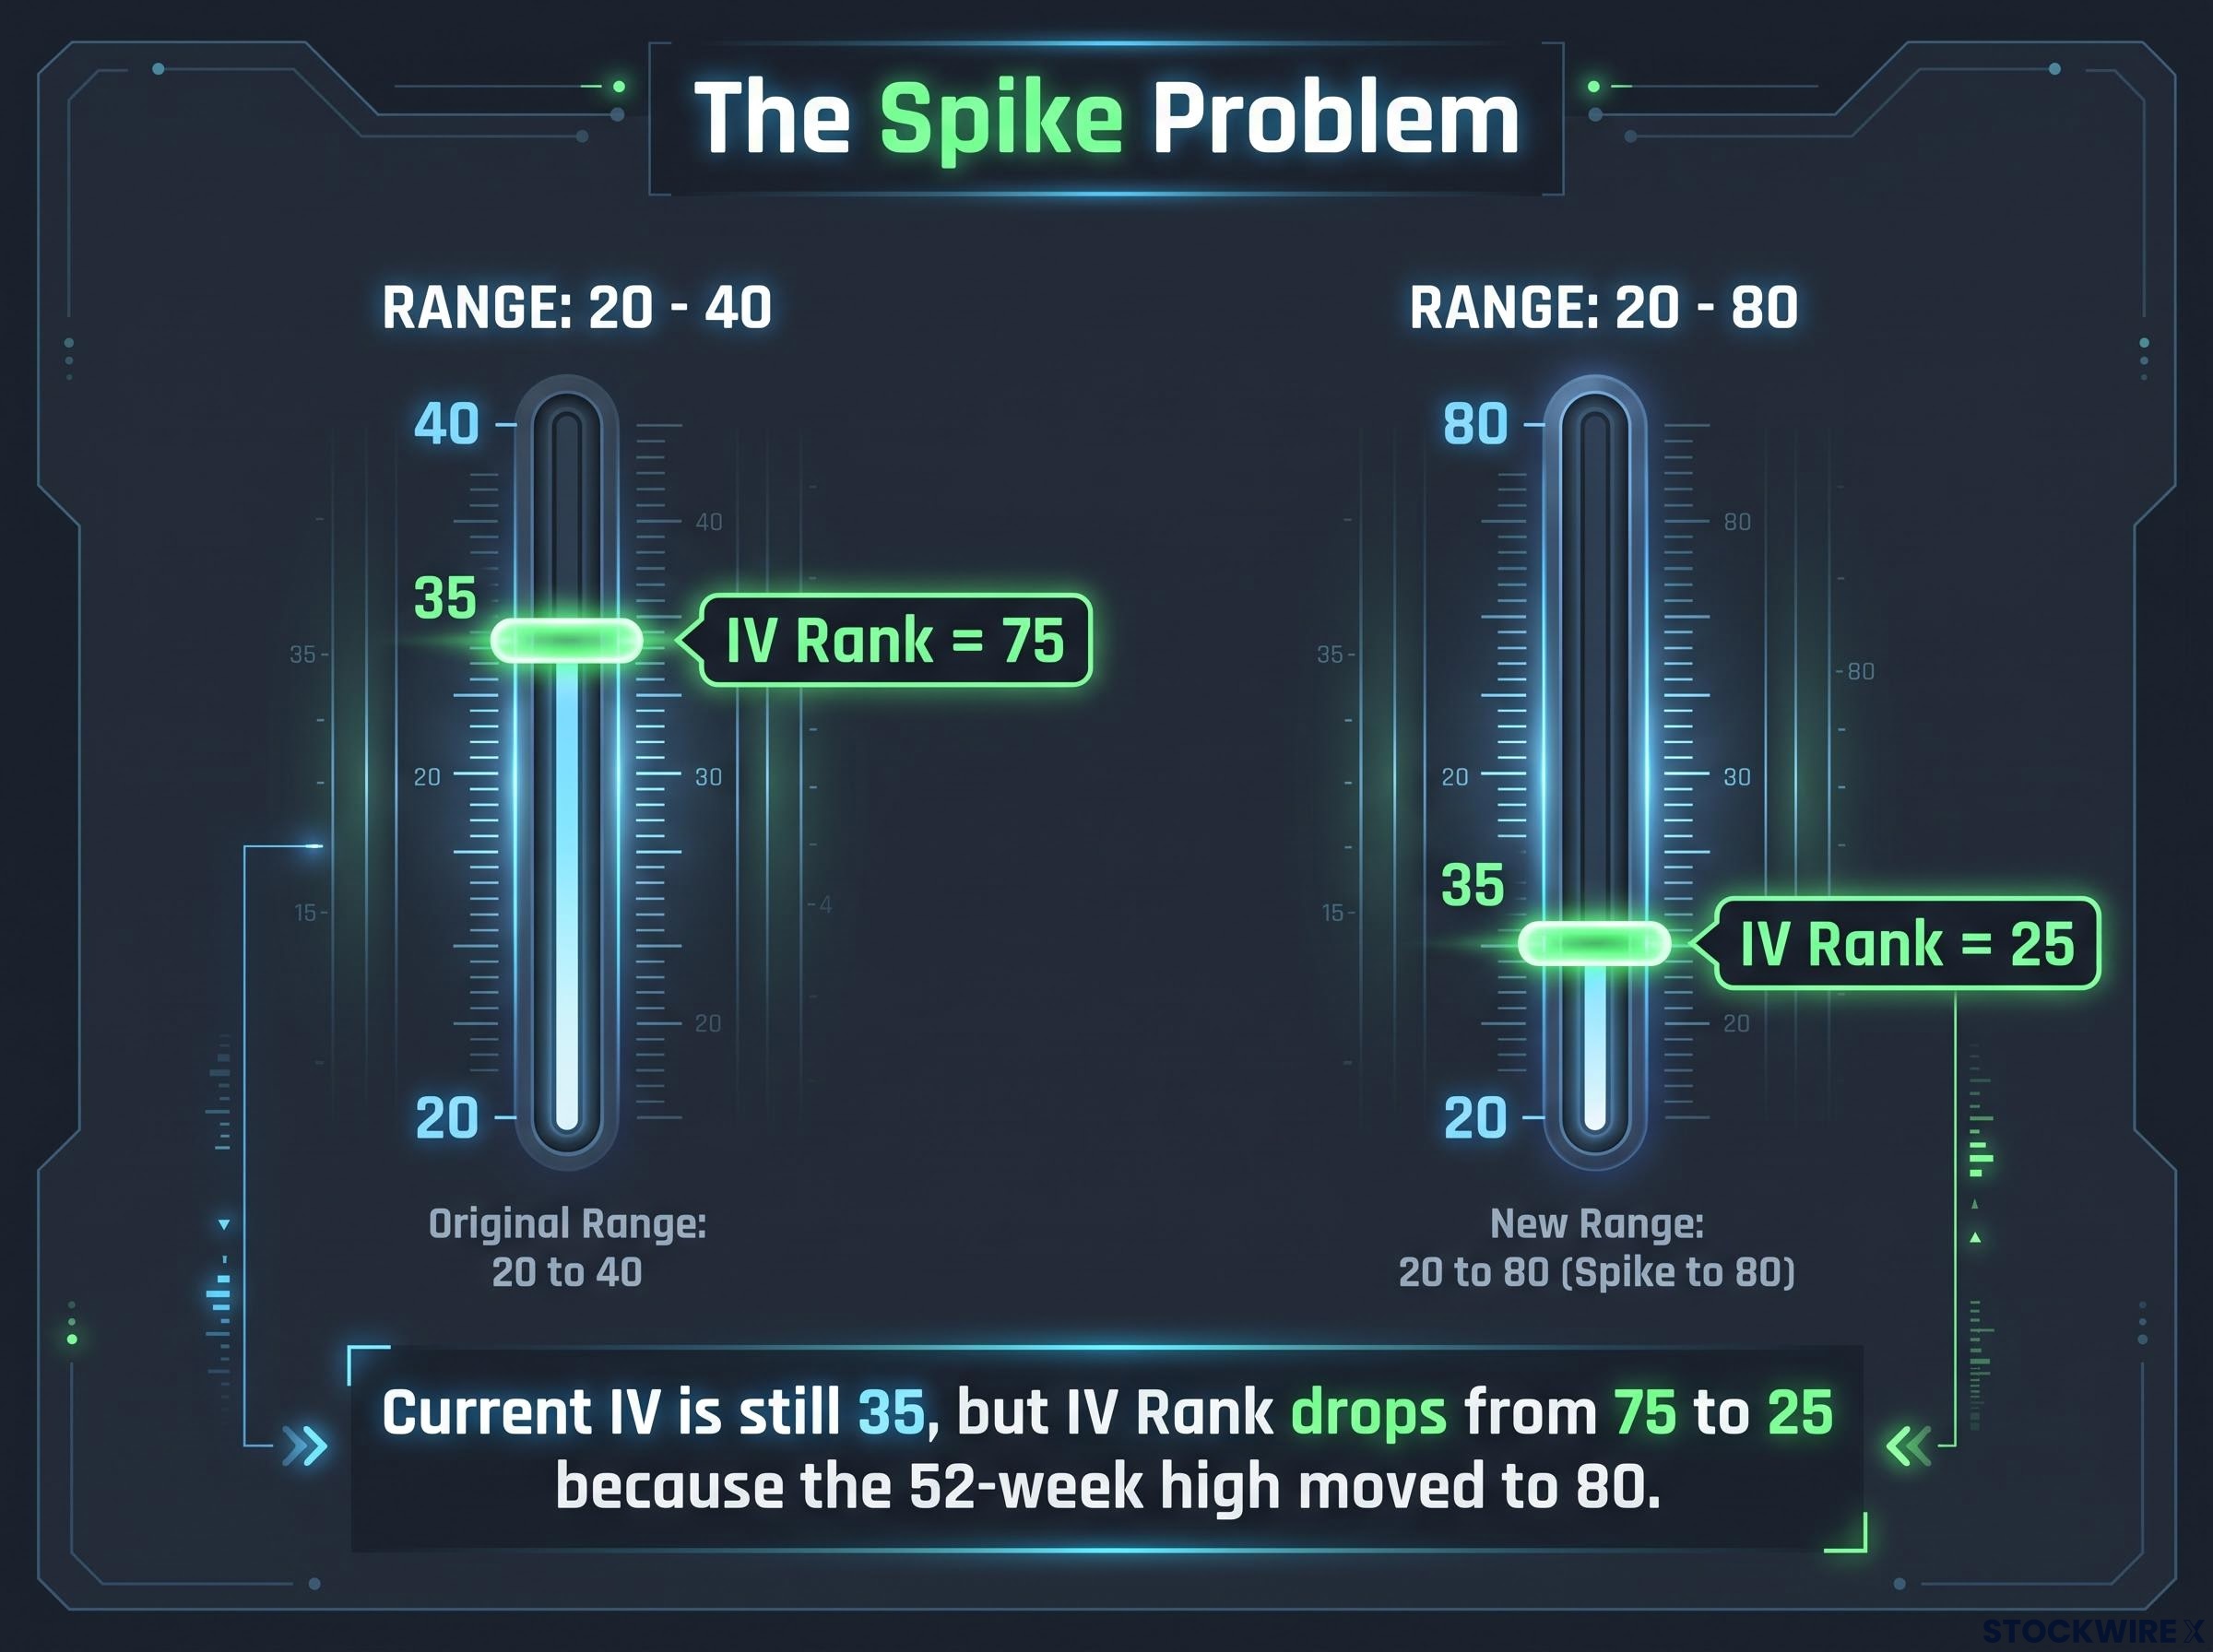
That is the distortion documented in VolatilityBox and TradeAlgo educational materials, which frame it as IV Rank’s core structural weakness. A reading that would once have registered near 100 can collapse to around 50 purely because the range got stretched.
The worst part is the duration. Once a spike resets the 52-week high, that ceiling holds for the full 52-week window. A volatility event lasting only days can suppress IV Rank for up to a year.
The conditions that produce the worst distortion are specific:
- A brief but extreme spike occurred within the past 52 weeks
- Current IV is elevated but sits below that spike level
- The spike has not yet rolled out of the lookback window
When all three line up, IV Rank actively misleads you. An IV Rank of 45 looks like a lukewarm environment you should skip. But if that number has been artificially compressed by a six-month-old spike, you may be staring at a genuinely rich premium opportunity the metric is training you to walk past.
That is not an abstract flaw. It is the difference between using the metric correctly and being steered away from the exact trades you are hunting for.
Note: available educational materials describe this problem in general structural terms rather than anchoring it to a specific named market event.
Why IV Percentile holds up where IV Rank breaks down
The day-counting mechanism is not just a different way to measure. It is a direct structural fix for the problem IV Rank creates.
Here is the reason it holds up. A single extreme spike contributes exactly one day to a total observation count of roughly 252. One day out of 252 cannot mechanically drag every subsequent reading downward. The spike is just one dot among hundreds.
Return to the earlier scenario. The spike pushed IV Rank from 75 down to 25, even though current IV never moved. IV Percentile would behave differently. If most of the other 251 days had lower IV than today, IV Percentile would still read high, accurately reflecting that premiums are rich right now.
That is why volatility-focused educators treat IV Percentile as the better gauge of genuine extremes. A reading near 99 means implied volatility exceeded today’s level on fewer than 1% of historical trading days, per Tastytrade and TradeAlgo documentation. That is a far cleaner signal than a range metric a single spike can corrupt.
The two metrics do not always disagree. In a thinkorswim educational example using Blackstone Inc. (BX), the platform displayed IV Rank at 95% alongside IV Percentile at 100%. Both confirmed the same thing: a genuinely extreme volatility environment. When they agree, your confidence should be high.
Reading divergence between the two metrics
The divergence between them is not a contradiction you resolve by picking the number you prefer. It is a diagnosis.
When IV Rank reads moderate while IV Percentile reads high, that gap tells you a spike has compressed the rank scale, while the frequency measure is still showing an elevated environment. The divergence itself is the signal. Here is how to read the main scenarios in plain language:
- IV Rank high, IV Percentile high: Both confirm a rich environment. Strongest signal.
- IV Rank moderate, IV Percentile high: A spike has compressed the rank scale. The frequency measure is the more reliable read.
- IV Rank high, IV Percentile moderate: Current IV is near the 52-week high, but this has not historically been a high-IV name, so the elevated reading is relative to a quiet baseline.
When your platform shows IV Rank at 45 and IV Percentile at 80, do not average them and do not ignore one. The range metric is compromised; the frequency metric is giving you the more honest read on whether premiums are actually rich today.
IV Percentile earns its keep precisely where a premium seller needs it most: after brief volatility events that spike and fade fast, leaving IV elevated against most of the year but not against the distorted ceiling. The thinkorswim community script that plots both metrics together was built specifically to surface these divergence moments.
How to use both metrics in a practical screening workflow
Understanding the metrics in isolation is not the same as using them well. The practitioner approach treats them as sequential tools in a disciplined process, not as rivals competing for your trust.
The two-step logic runs like this. Use IV Rank as the initial filter to narrow your watchlist to names where current IV is elevated relative to the annual range. Then use IV Percentile to validate that the environment is genuinely rich on a frequency basis before you commit.
On Tastytrade, IV Rank is displayed on every watchlist and trade page, with a default “High IV Rank” watchlist, making it the natural first screen. On thinkorswim, “Current IV Percentile” sits under Today’s Options Statistics, giving you the validation layer. The thinkorswim Stock Hacker tutorial uses an IV Rank filter of greater than 35 up to 100 as a starting screen.
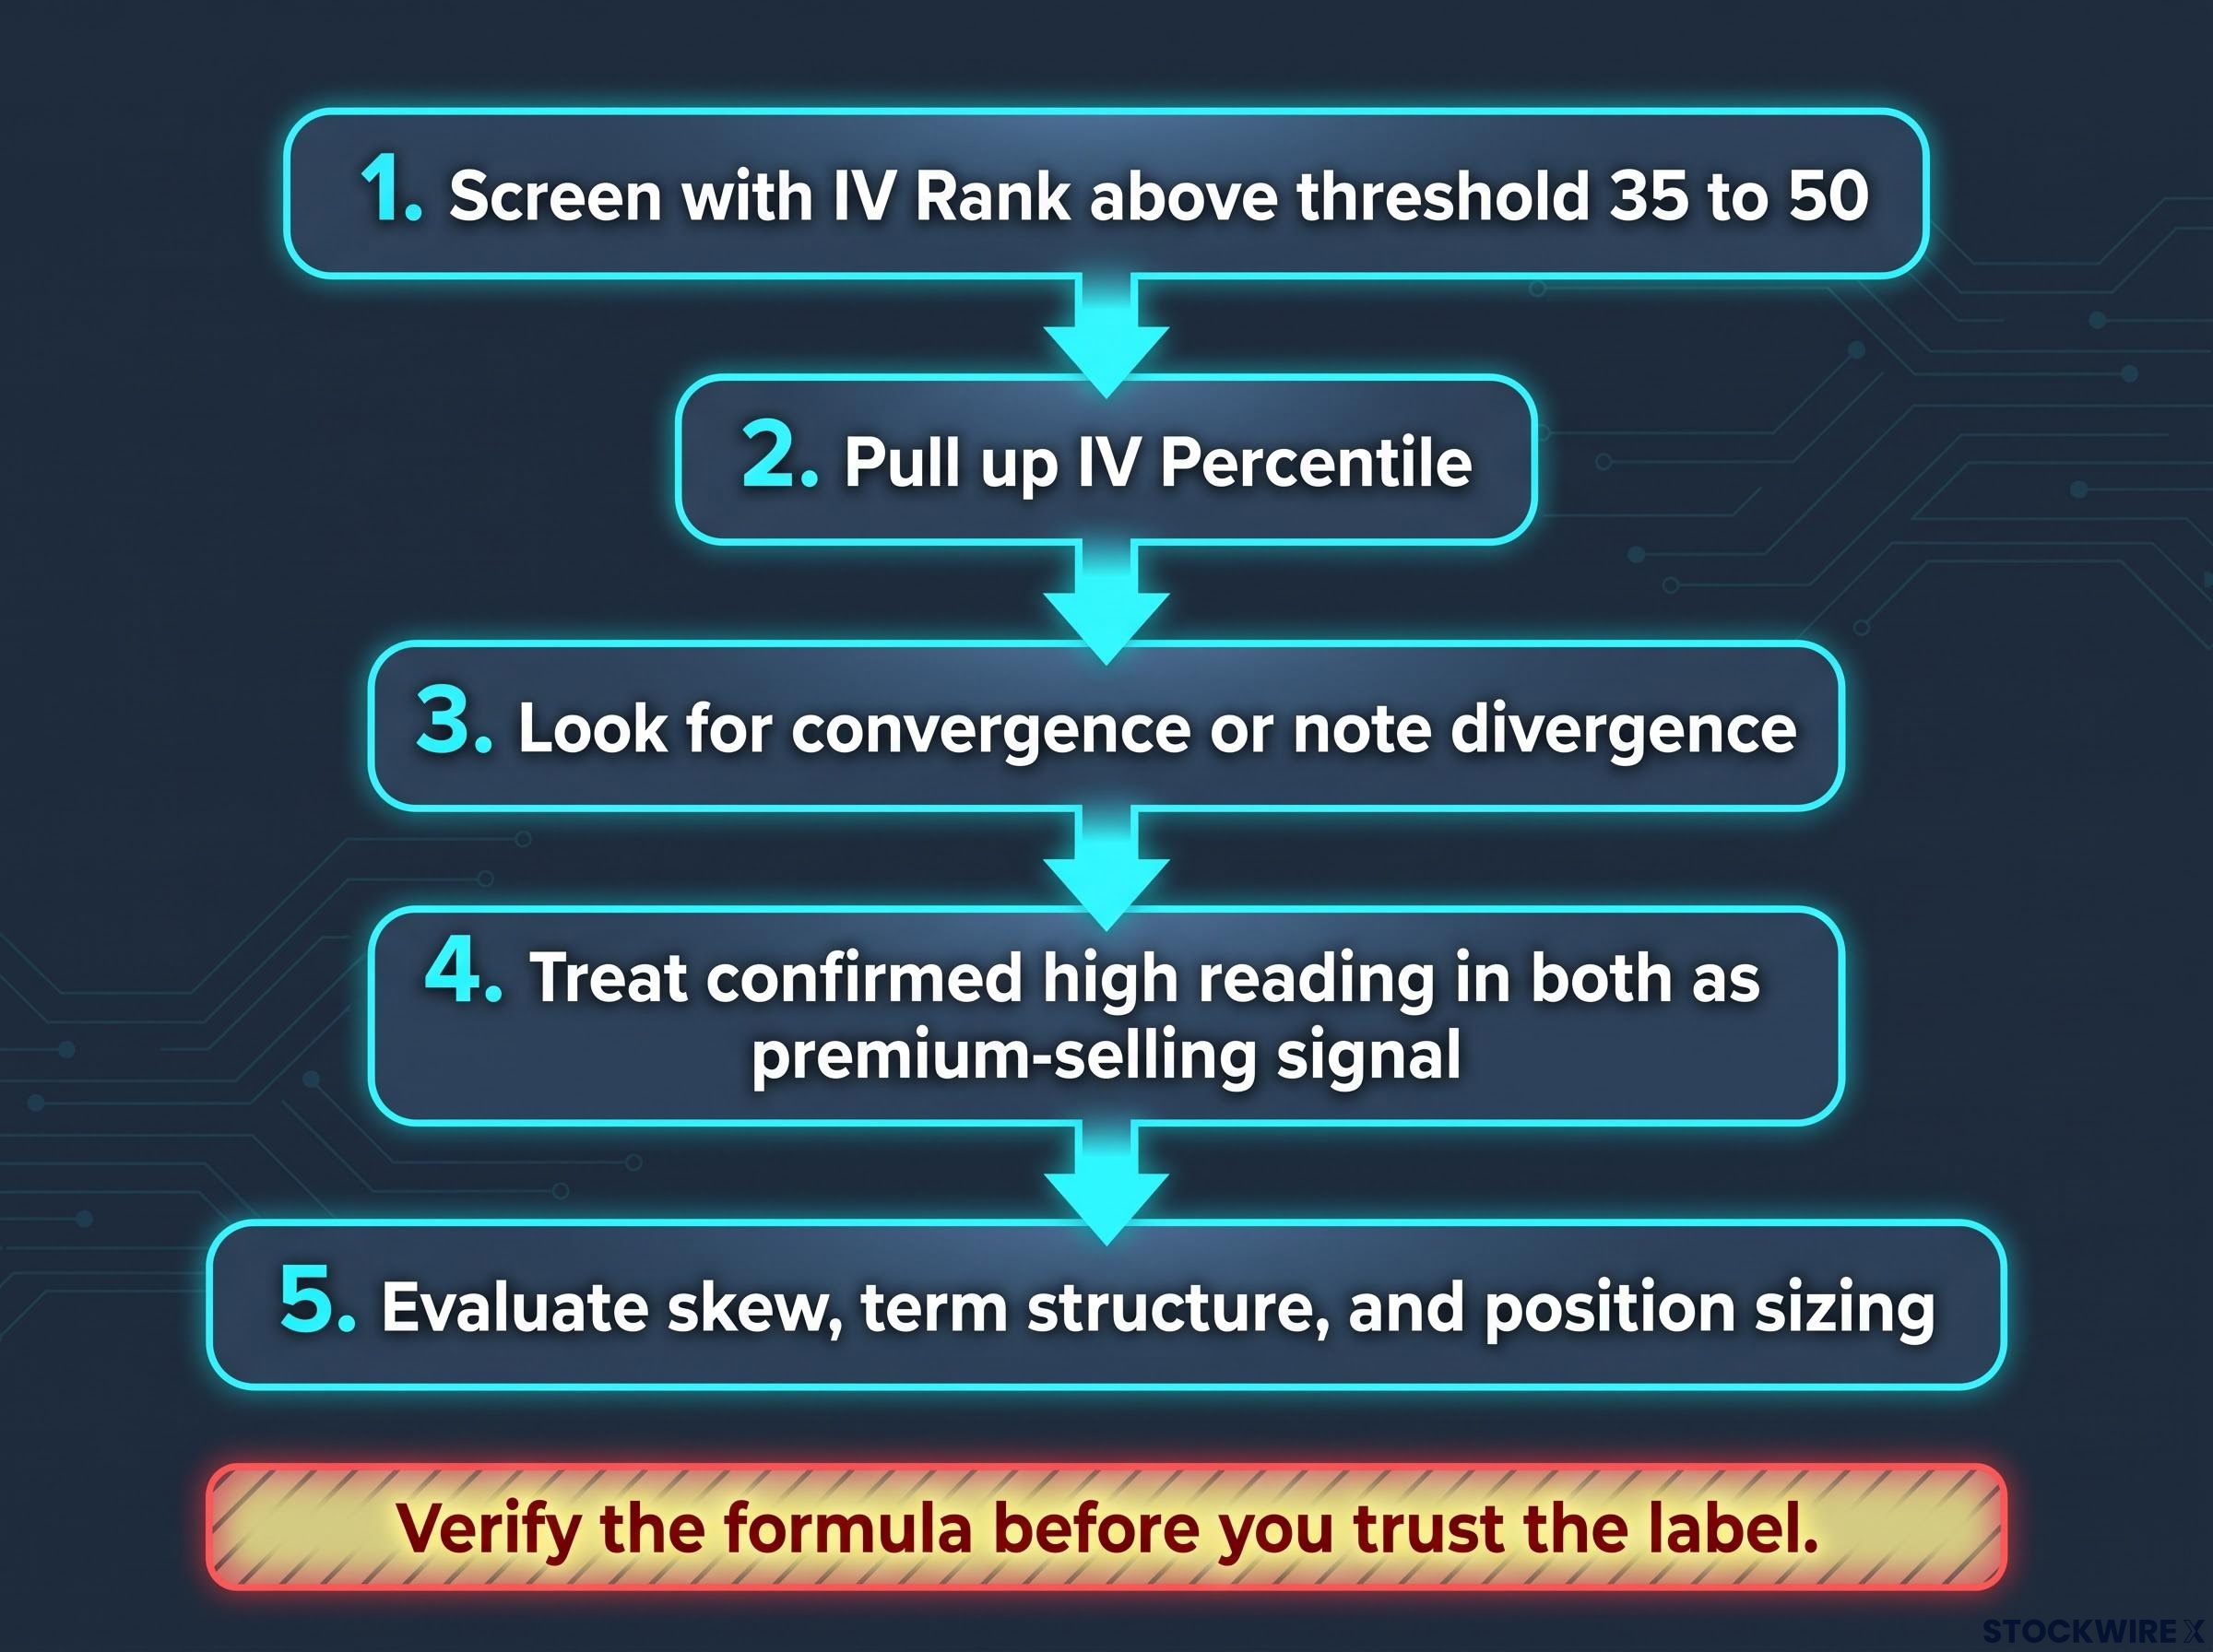
Here is the full workflow:
- Screen with IV Rank above a threshold such as 35 to 50 to generate candidates
- Pull up IV Percentile for each candidate
- Look for convergence, or note the type of divergence
- Treat a confirmed high reading in both as a premium-selling context signal
- Proceed to evaluate skew, term structure, and position sizing independently
There is one trap that undermines all of this if you miss it.
Verify the formula before you trust the label. TradeAlgo cautions that some platforms label a statistic “IV Percentile” while running a high-low range formula closer to IV Rank, and some label a metric “IVR” while computing a percentile. Check your broker’s documentation. The label is not a guarantee of the calculation.
That verification step matters because everything downstream depends on it. A trader who confirms the actual formula, screens with IV Rank, then validates with IV Percentile is working with a more robust signal stack than one who adopts a favourite metric and applies it blind.
One scope boundary to keep in mind. Schwab frames these metrics as tools for understanding how much a stock could move and where current IV sits in its historical distribution, not as mechanical entry triggers. High readings in both metrics confirm premiums are rich. They do not tell you whether to enter the trade. Skew, term structure, underlying fundamentals, and position sizing all remain separate decisions you make on your own.
Which metric to reach for, and when to use both
So which number should you trust when they disagree? The direct answer: for spotting genuine implied volatility extremes where a spike may have distorted the scale, IV Percentile is the more reliable tool, because its day-counting mechanism is structurally resistant to the range-compression problem that corrupts IV Rank.
That does not retire IV Rank. Its intuitive simplicity and deep integration into options-seller workflows, especially on Tastytrade with its built-in “High IV Rank” watchlist and default screener, make it a reasonable first filter when speed matters and you understand its limitation.
The forward-looking principle is where the real discipline lives. Whenever the two metrics diverge meaningfully, treat that divergence as the most important signal in the pair. Do not average them. Do not quietly drop the one that looks less attractive. Investigate what produced the gap before you act. The thinkorswim “TastyTrade IV Rank” community script plots both simultaneously for exactly this reason: to make those divergence moments visible.
| Approach | Use case | Strength | Key limitation |
|---|---|---|---|
| Lead with IV Rank | Fast initial screen for names where IV is near its yearly high | Intuitive, built into Tastytrade watchlists and screeners | A single spike can compress readings for up to a year |
| Lead with IV Percentile | Confirming a genuine volatility extreme before selling premium | One spike is just one day in 252, so distortion is minimal | Less prominent on some options-seller platforms by default |
The mental rule to carry away: default to IV Percentile for confirmation, use IV Rank for speed, and treat any meaningful divergence as a reason to investigate rather than a reason to pick the prettier number. Applied consistently, that framework helps you catch premium-selling environments a single-metric approach would miss, particularly in the weeks after a brief spike has quietly distorted the 52-week range.
For readers wanting to extend the volatility screening workflow into live market scanning, our full explainer on reading unusual options activity covers the structural markers that separate genuine institutional premium flow from noise, including how IV context shapes whether unusual volume is meaningful.
This article is for informational purposes only and should not be considered financial advice. Investors should conduct their own research and consult with financial professionals before making investment decisions.