Most retail traders scan for a bullish stock, spot a put spread, sell it, and consider the analysis finished. A real bullish put spread strategy requires more discipline than that, and a recent executed trade on TD SYNNEX (SNX), walked through live on tastylive, shows exactly what the quick version leaves out.
What it leaves out is three filters that have nothing to do with whether the stock goes up. They tell you whether the trade has a structural edge before you ever place the order.
A bullish put spread is one of the most widely used defined-risk strategies in retail options trading. A put spread involves selling one put option and buying another at a lower strike to cap your loss, collecting the difference as a credit. Simple as it sounds, the setup hides a sequence of decisions that separate a probability-backed trade from a directional bet wearing options clothing.
Here is the checklist, built trade by trade. Using the SNX position as the working example at every step, this walks through the repeatable evaluation sequence you can apply to your own next put spread candidate, in the order a practitioner actually makes the calls.
Why implied volatility rank matters more than the IV number itself
The first number most new traders fixate on is the absolute implied volatility reading, often shown right on the options chain. Implied volatility (IV) is the market’s estimate of how much a stock might move, expressed as an annualised percentage. A reading of 65% looks high, and the instinct is to treat it as a green light for selling premium.
Every Greek and probability figure on your options chain is a downstream output of implied volatility basics: the single input that drives delta, theta, and the probability estimates your platform displays, recalculated in real time as market prices shift.
That instinct is wrong, or at least incomplete.
The NBER research on implied volatility functions established that implied volatilities vary systematically across strike prices and expirations, the foundational finding that explains why a single absolute IV reading tells you nothing about whether premium is genuinely rich or cheap for a given name.
Absolute IV tells you nothing about whether the current reading is high or low for that specific stock. A 65% IV might be unusually rich for one name and completely ordinary for another. On its own, the number has no context.
That is the exact problem IV rank solves.
- Absolute IV: The raw implied volatility percentage. It measures the market’s current expectation of movement, but it does not say whether that expectation is high or low by the stock’s own standards.
- IV rank: Where current IV sits within the stock’s own range over the past year, scored from 0 to 100. A reading of 50 means IV is at the midpoint of its recent history; above 50 is generally considered favourable for selling premium, below 30 much less so.
A high absolute IV with a low IV rank tells you the stock has been even wilder recently. You are not selling expensive options; you are selling options that are normal for this stock.
Reading the SNX volatility setup in practice
At the time of the SNX trade, absolute IV sat around 65%, elevated by any surface reading. But IV rank was roughly 24%, placing volatility in the lower quarter of its own recent range.
That gap reframes everything. The mean-reversion argument, the idea that you sell rich options and profit as IV falls back toward normal, barely applies when volatility is already near normal for the stock.
For comparison, by late September 2026 SNX showed absolute IV near 37-39% with an IV rank around 3%. Lower absolute number, but relatively even cheaper premium against its own history. This is why the rank, not the raw figure, is the signal you trade off.
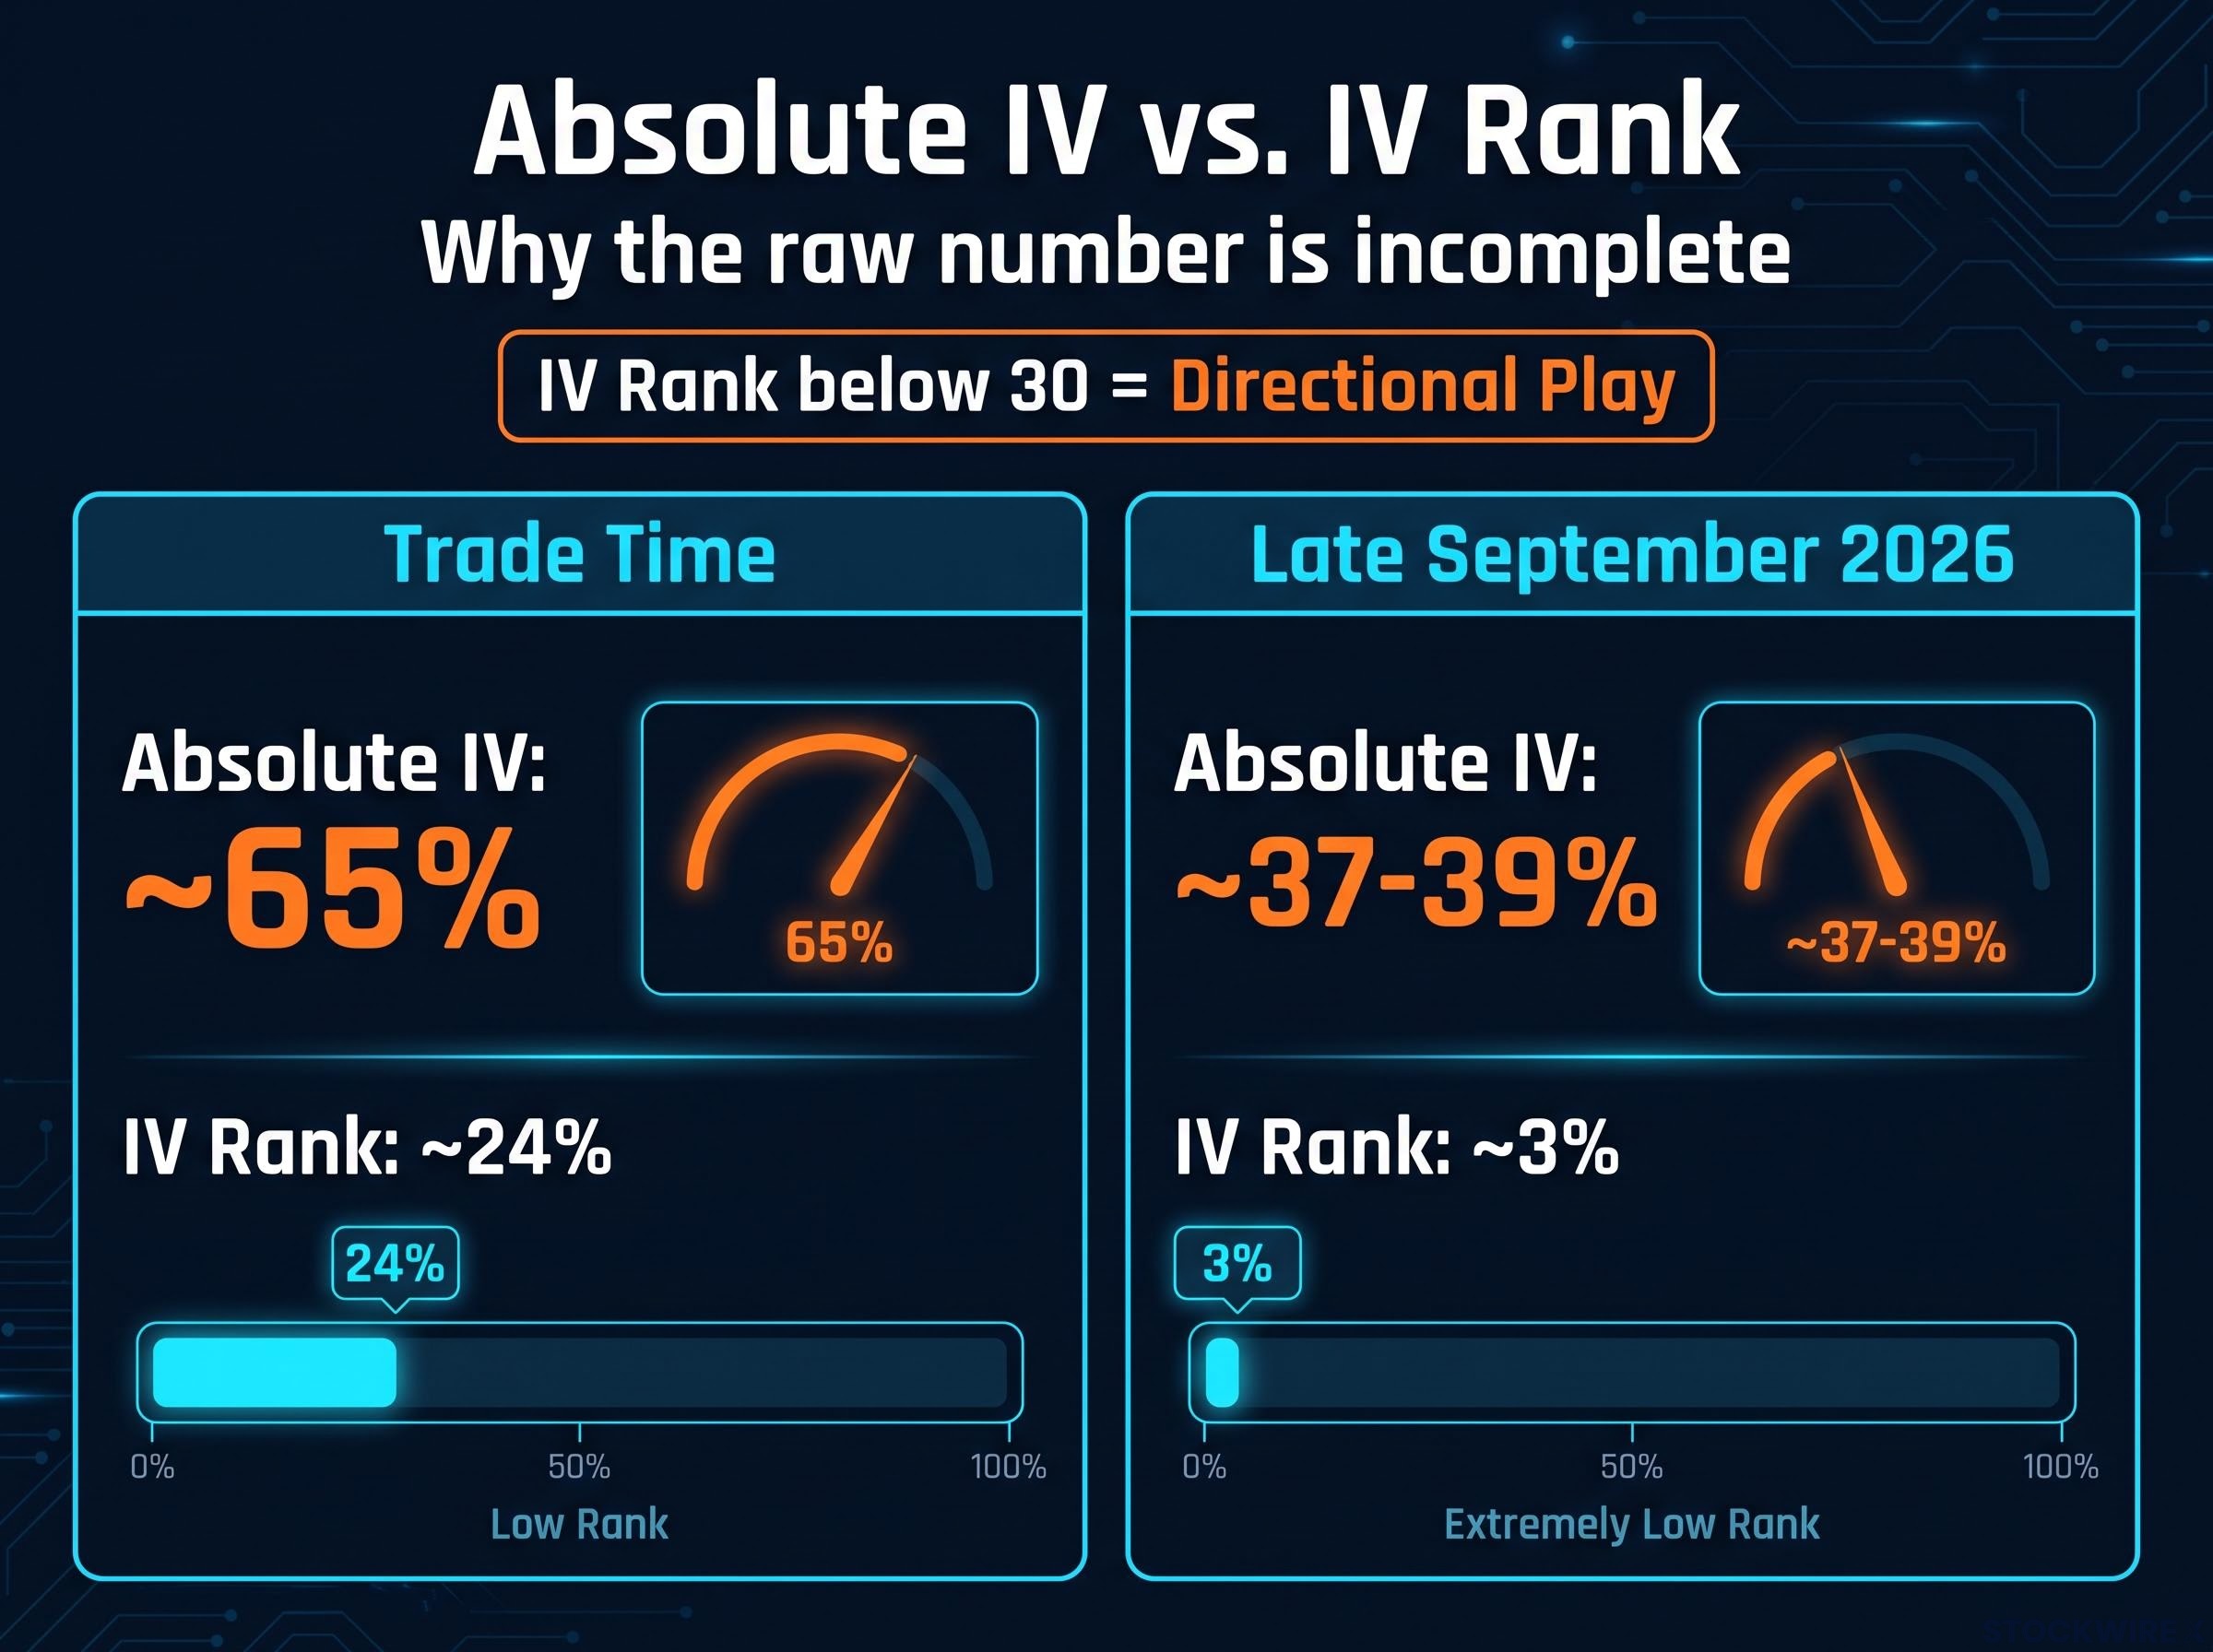
When IV rank sits below 30, you are no longer running a volatility-edge trade. You are consciously taking a directional play, and your position size should shrink to reflect that.
When big ASX news breaks, our subscribers know first
What volatility skew reveals about market sentiment on a stock
Skew is a signal the market broadcasts to anyone willing to read the options chain, and most retail traders walk right past it.
Volatility skew is the pattern of implied volatility across different strike prices. For most equities, the default state is downside skew: out-of-the-money (OTM) puts carry higher IV than comparable OTM calls, because investors constantly buy puts as insurance and that demand bids up their price.
Upside skew is the exception. When OTM calls carry higher IV than comparable puts, the market is paying up for upside exposure, which strategists read as a bullish sentiment signal.
On the SNX trade, the skew was oriented toward the upside. That was the directional signal the co-analyst, referred to as Sue on the tastylive session, used to justify the bullish thesis.
Here is the honest part. Deploying a bullish put spread into an upside-skew environment aligns you with market sentiment, but it quietly reduces your structural edge, because the downside puts you are selling are no longer unusually rich.
| Feature | Downside skew (equity norm) | Upside skew (the exception) |
|---|---|---|
| What it looks like on the chain | OTM puts priced with higher IV than OTM calls | OTM calls priced with higher IV than OTM puts |
| What it signals | Hedging demand, caution on the downside | Demand for upside, bullish positioning |
| What it means for a bullish put spread | Puts are richer, more premium-selling edge | Sentiment aligns with you, but less structural edge |
Skew reflects current positioning, not guaranteed future direction. Crowded bullish positioning can precede sharp reversals, so treat skew as a secondary filter, not a trigger.
For your own candidate, upside skew means the market is already leaning the same way you are. That is useful confirmation, but it is not a reason to oversize the position or skip your other filters.
How to select strikes and choose an expiration that match your thesis
Strike selection and expiration are the two variables most retail traders treat as afterthoughts. Get them wrong and you have built a poor risk-reward profile before the trade even opens.
Start with probability. Short-premium setups typically target a 60-80% probability of profit (POP), the estimated chance the trade finishes at maximum gain. That POP range aligns with selling the short put at roughly 0.20-0.30 delta, moderately out-of-the-money, with the long put placed 2-5 strikes lower to cap your risk.
Delta here is a rough proxy for the probability an option finishes in-the-money, so a 0.30-delta put has roughly a 30% chance of ending in-the-money and about a 70% chance of expiring worthless, which is what you want as the seller.
Probability of profit on a defined-risk spread can be calculated in seconds using the credit-to-width formula: divide the credit received by the total strike width and subtract from 100%, though that shortcut misses bid-ask friction costs and the gap between the probability of expiring worthless and the probability of the short strike being tested before expiration.
Then apply the credit rule, and here the SNX trade earns its keep as an example.
- Identify your target delta range for the short strike (0.20-0.30 delta for a 60-80% POP).
- Check the credit against the one-third-of-width threshold before accepting the strikes.
- If the credit falls short, adjust the strikes until it clears the threshold, or reject the trade.
The one-third rule, a tastylive benchmark, requires a credit equal to roughly 33% of the spread width. A more conservative benchmark from DataDrivenOptions targets 12-18% of width. The one-third rule produces a max loss roughly twice the max profit, a deliberate risk-reward symmetry that also leaves room to cover transaction costs.
The one-third rule in practice: the SNX adjustment
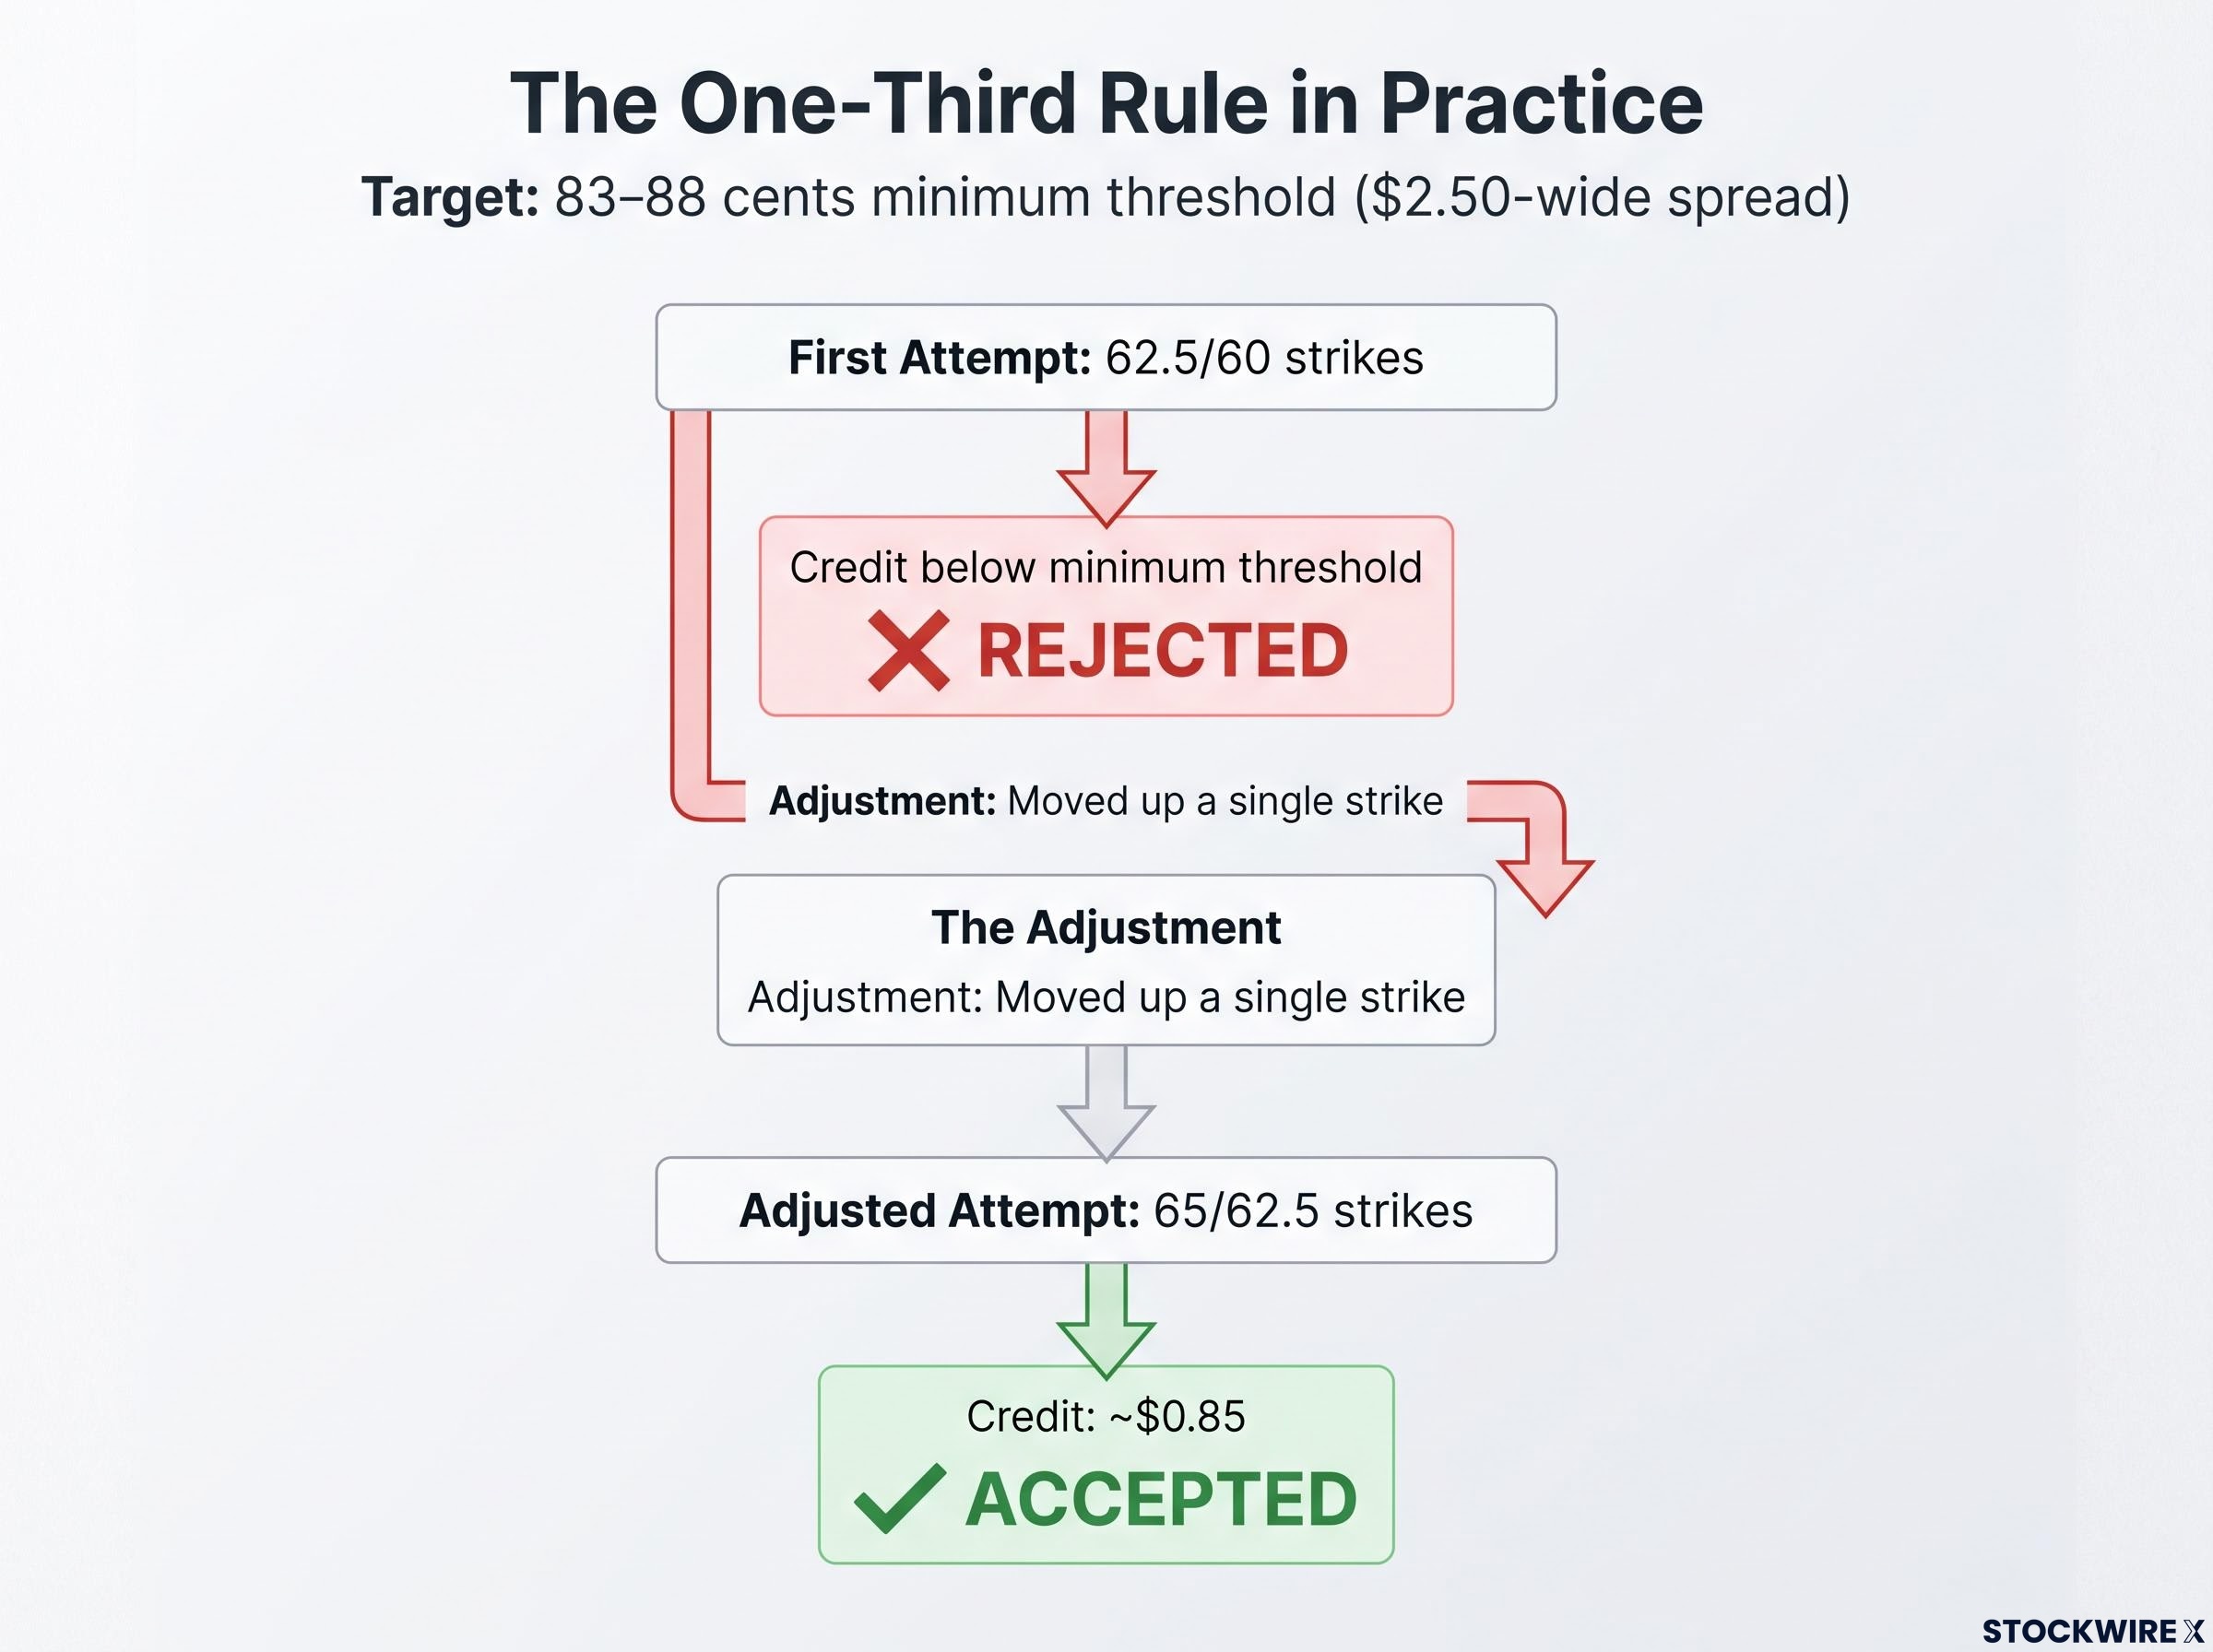
The first SNX attempt used the 62.5/60 strikes on a $2.50-wide spread. The credit came in below the minimum threshold of roughly 83-88 cents, one-third of the width. That spread was rejected on the credit rule alone.
Moving up a single strike produced a credit of about $0.85, clearing the one-third benchmark. The trade became acceptable not because the thesis changed but because the construction improved.
That is the credit rule working as intended. It is a filter, not a preference: if the natural strikes do not meet it, you move strikes until they do or you pass.
Expiration is the second lever. The SNX trade used 14 days to expiration, chosen because the trader expected the move to resolve within one to two weeks. A tastylive duration backtest from 2017 found win rates of 88% or higher across 15, 45 and 75 DTE buckets, which tells you duration shapes how a trade behaves more than it changes the raw win rate.
| Duration | Theta decay | Gamma risk | Capital tie-up | Best-fit scenario |
|---|---|---|---|---|
| 14-15 DTE | Fast | High | Short | Quick resolution expected, like the SNX trade |
| 30-45 DTE | Robust, balanced | Moderate | Moderate | Default for most retail setups |
| 45-75 DTE | Slower | Lower | Longer | High win rate, willing to tie up capital |
The SNX position carried an estimated 71% probability of achieving maximum profit at expiration, consistent with the 60-80% POP target that disciplined strike selection produces.
Risk, reward, and the numbers behind the SNX trade
The risk-reward arithmetic is something you calculate before entry, not something you discover afterwards. Run it first and the trade either justifies itself or it does not.
Here is the SNX position as a trade snapshot:
- Underlying: TD SYNNEX (SNX)
- Spread width: $2.50
- Credit received: approximately $0.85 per contract
- Maximum profit: approximately $85 per contract
- Maximum risk: approximately $165 per contract
- Probability of profit: approximately 71%
- Duration: 14 days to expiration
- Contracts: two, a deliberately light size
A maximum risk of roughly twice the maximum profit is not a warning sign for this structure. It is the expected profile of a well-built credit spread, and you evaluate it against that 71% probability rather than in isolation. A trade that wins 71% of the time while risking two to make one is a sound asymmetry, not a broken one.
The light size, two contracts, connects directly to the low IV rank. Because this was a directional play rather than a volatility-edge trade, a smaller position than you would run in a high-IV-rank premium-selling setup is the correct response.
The directional thesis had support. At trade time, analyst consensus put the average 12-month target near $339.64, with 11 analysts rating SNX a Buy, and UBS raised its target to $379 on 25 September 2026.
Three risks to account for before the trade opens
Assignment risk. The short put can be assigned if it goes in-the-money near expiration, especially once its extrinsic value approaches zero, leaving you with an unexpected long stock position. Close or roll before that happens.
Liquidity slippage. A vertical spread has two legs, so poor liquidity costs you on both entry and exit. Use limit orders and screen for tight bid-ask spreads and healthy open interest, particularly in mid-cap names.
Gap and event risk. Overnight gaps and macro shocks can move the trade past your short strike, and short-duration positions like a 14 DTE spread give you less time to recover. Sizing light and staggering entries both help.
Close or roll the position before extrinsic value on the short put approaches zero, or you risk an unexpected long stock position through assignment.
Managing the position once it is open
The real question is not whether the trade will work. It is what you will do when it moves against you, and that answer has to exist before you place the order.
Management rules defined in advance are the variable that separates a recoverable loss from a maximum-loss outcome. Improvised decisions under pressure are where retail traders consistently hand back their edge.
- Set a profit target of 50-75% of the maximum credit before you enter, and close when you hit it rather than holding to expiration.
- Set a loss threshold at 1.5-2 times the credit received, and close if you reach it.
- Monitor for the underlying breaking through the short strike with conviction, and treat that as an exit signal.
- Close before extrinsic value on the short put reaches zero to sidestep assignment.
Loss exit rules work best when they are mechanised at order entry: setting a Good-Till-Cancelled limit buy order at your buyback threshold the moment you open the short put removes the psychological hesitation that causes retail traders to hold losing spreads to maximum loss rather than closing at a predetermined multiple of the credit received.
The 50-75% profit target, a tastylive guideline, captures most of the available gain while removing the residual risk of holding to the wire. On the SNX trade, the 14 DTE window means theta decay accelerates in the final week, which makes the profit target quick to reach but also compresses the time you have to react to an adverse move.
The loss threshold matters just as much. Holding a losing spread to expiration in the hope of a rebound is the primary retail error, and it converts a manageable loss into the maximum one.
The plan is not a suggestion. Treat it as non-negotiable before you place the order.
That profit target is not a conservative nicety. It is the mechanism that keeps a 71% probability trade from being wrecked by the losing 29%.
This article is for informational purposes only and should not be considered financial advice. Investors should conduct their own research and consult with financial professionals before making investment decisions. Past performance does not guarantee future results, and options trading carries substantial risk.
Applying the SNX framework to your next trade
The point of the SNX trade is not SNX. It is the evaluation sequence, and that sequence transfers to any bullish put spread candidate you look at next.
Run every candidate through five questions before you place an order:
- Where does IV rank sit, and what type of trade does that make this? Below 30 means directional, so size accordingly.
- What does the skew orientation signal about market sentiment, and is it confirming or contradicting your thesis?
- Do the natural strikes meet the credit threshold, or does the trade need a strike adjustment, or rejection?
- Do the maximum profit, maximum risk and POP form a trade profile you would accept on its own merits?
- Are your profit target and loss threshold defined before entry, not improvised after?
The SNX position was deliberately directional because IV rank was low, and that is a legitimate approach. The discipline is simply entering it with that classification explicit in your thinking rather than mistaking it for a volatility-harvesting trade.
Run every put spread candidate through this five-question sequence and you are operating with a structured edge that most retail traders never build. The worked example does the teaching; your own checklist does the rest.
For readers wanting to apply the same five-step framework to an index-based spread with lower capital requirements, our comprehensive walkthrough of XSP put credit spread construction covers strike selection anchored to thesis invalidation levels, the one-third credit threshold in practice, and exit triggers set at order entry.