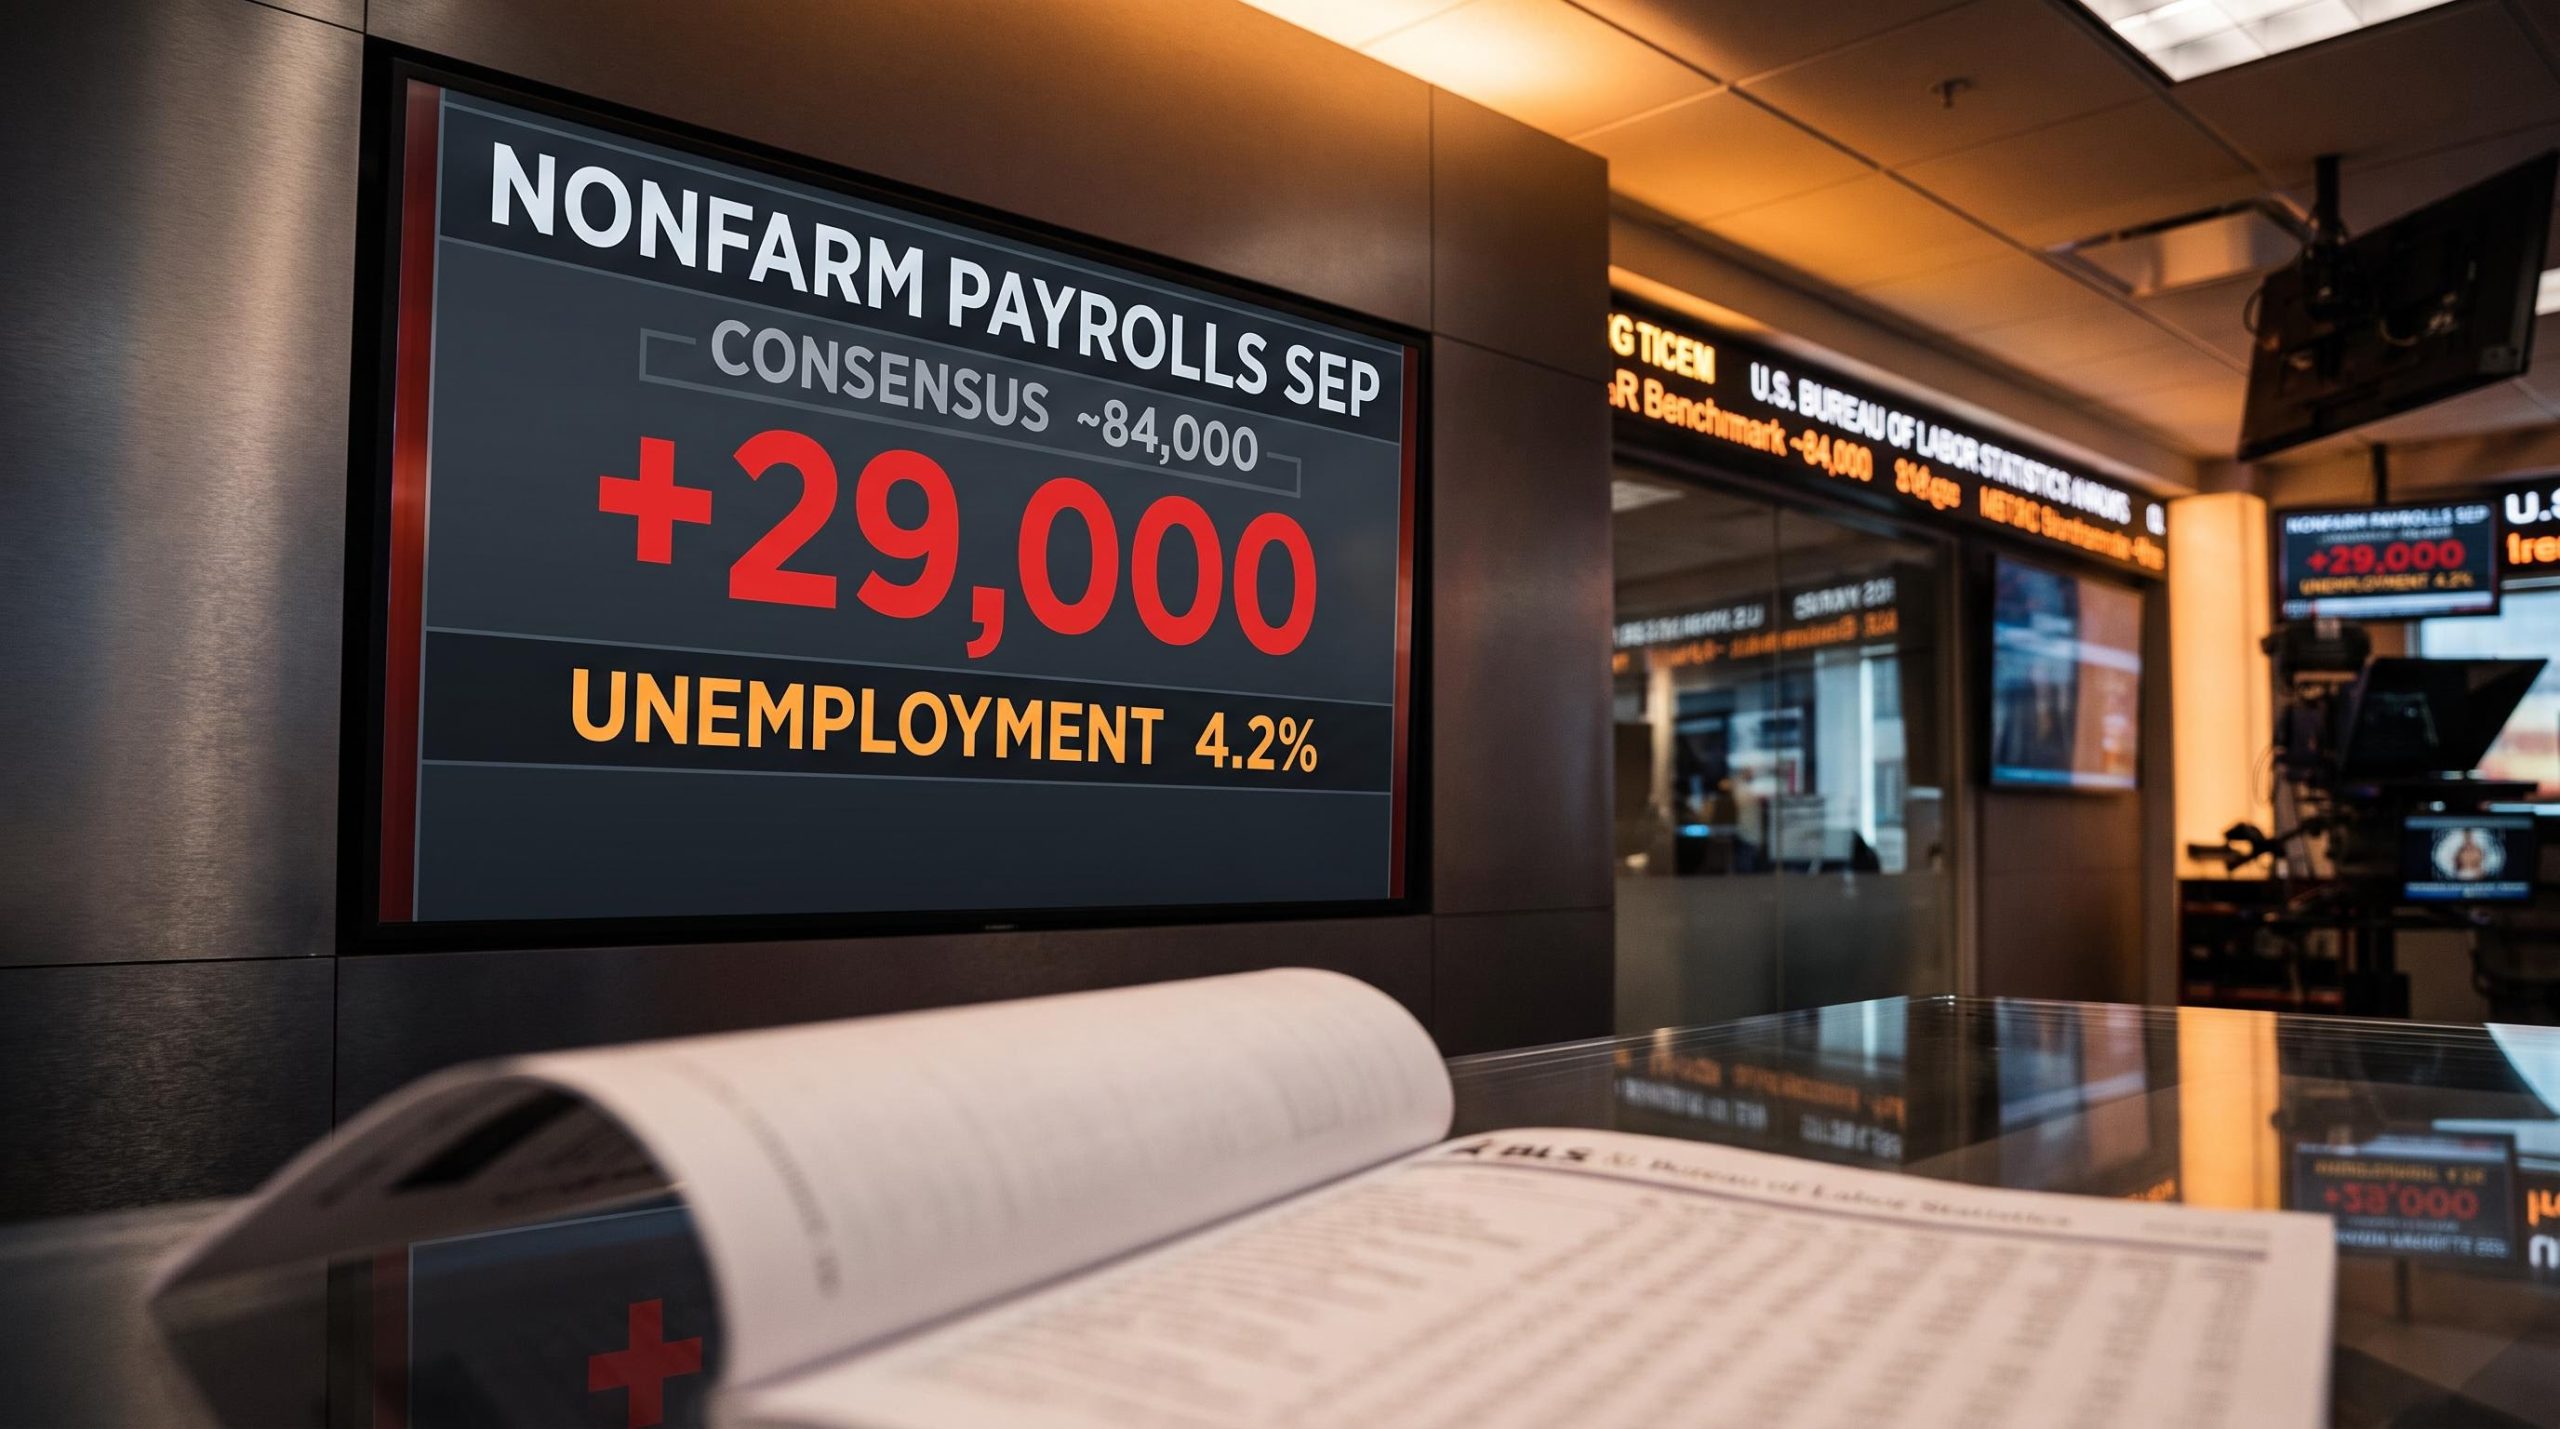
The US economy added just 29,000 jobs in September, roughly one-third of what forecasters had penciled in, and the unemployment rate climbed to 4.2%. Against a Dow Jones consensus of around 84,000, that is a miss large enough to force an uncomfortable question: does a labour market cooling this visibly still justify another Federal Reserve rate hike?
The timing sharpens the stakes. The report, released by the Bureau of Labor Statistics (BLS) on 2 October 2026, lands with the Fed’s October meeting days away and a December move still firmly in play. CME FedWatch markets are pricing a 38.2% probability of an October hike and an 86.7% cumulative probability of at least one more increase by year-end.
It does not arrive alone. August PCE inflation, the Fed’s preferred price gauge, also undershot forecasts, creating a dual softening signal that is already reshaping how major institutions read the rate path. Here is what these specific numbers mean for the Fed’s decision, including the signals buried in the participation and wage data that the headline figure alone will not tell you.
A payroll miss that is larger than it looks on the surface
Start with the raw gap. Payrolls grew by 29,000 against a consensus near 84,000, a shortfall of roughly two-thirds of what economists had expected. In isolation, a single soft print would be easy to wave away as monthly noise.
It is not an isolated print. According to ABN Amro analyst Rogier Quaedvlieg, as reported by FXStreet, prior months were revised lower by a combined 60,000 jobs, and the three-month average payroll gain now sits at just 51,000. September is not a one-month stumble; it is the latest reading in a series that has been trending steadily downward.
The three-month payroll average has been the more reliable policy signal across 2026 than any single monthly print: April’s headline beat of 115,000 masked a three-month average of just 48,000 per month, a pattern consistent with the sustained deceleration that September’s 51,000 average now confirms is the prevailing trend rather than temporary noise.
The core figures at a glance:
- September nonfarm payrolls: +29,000 (BLS)
- Dow Jones consensus: approximately 84,000
- Prior months’ combined revision: -60,000
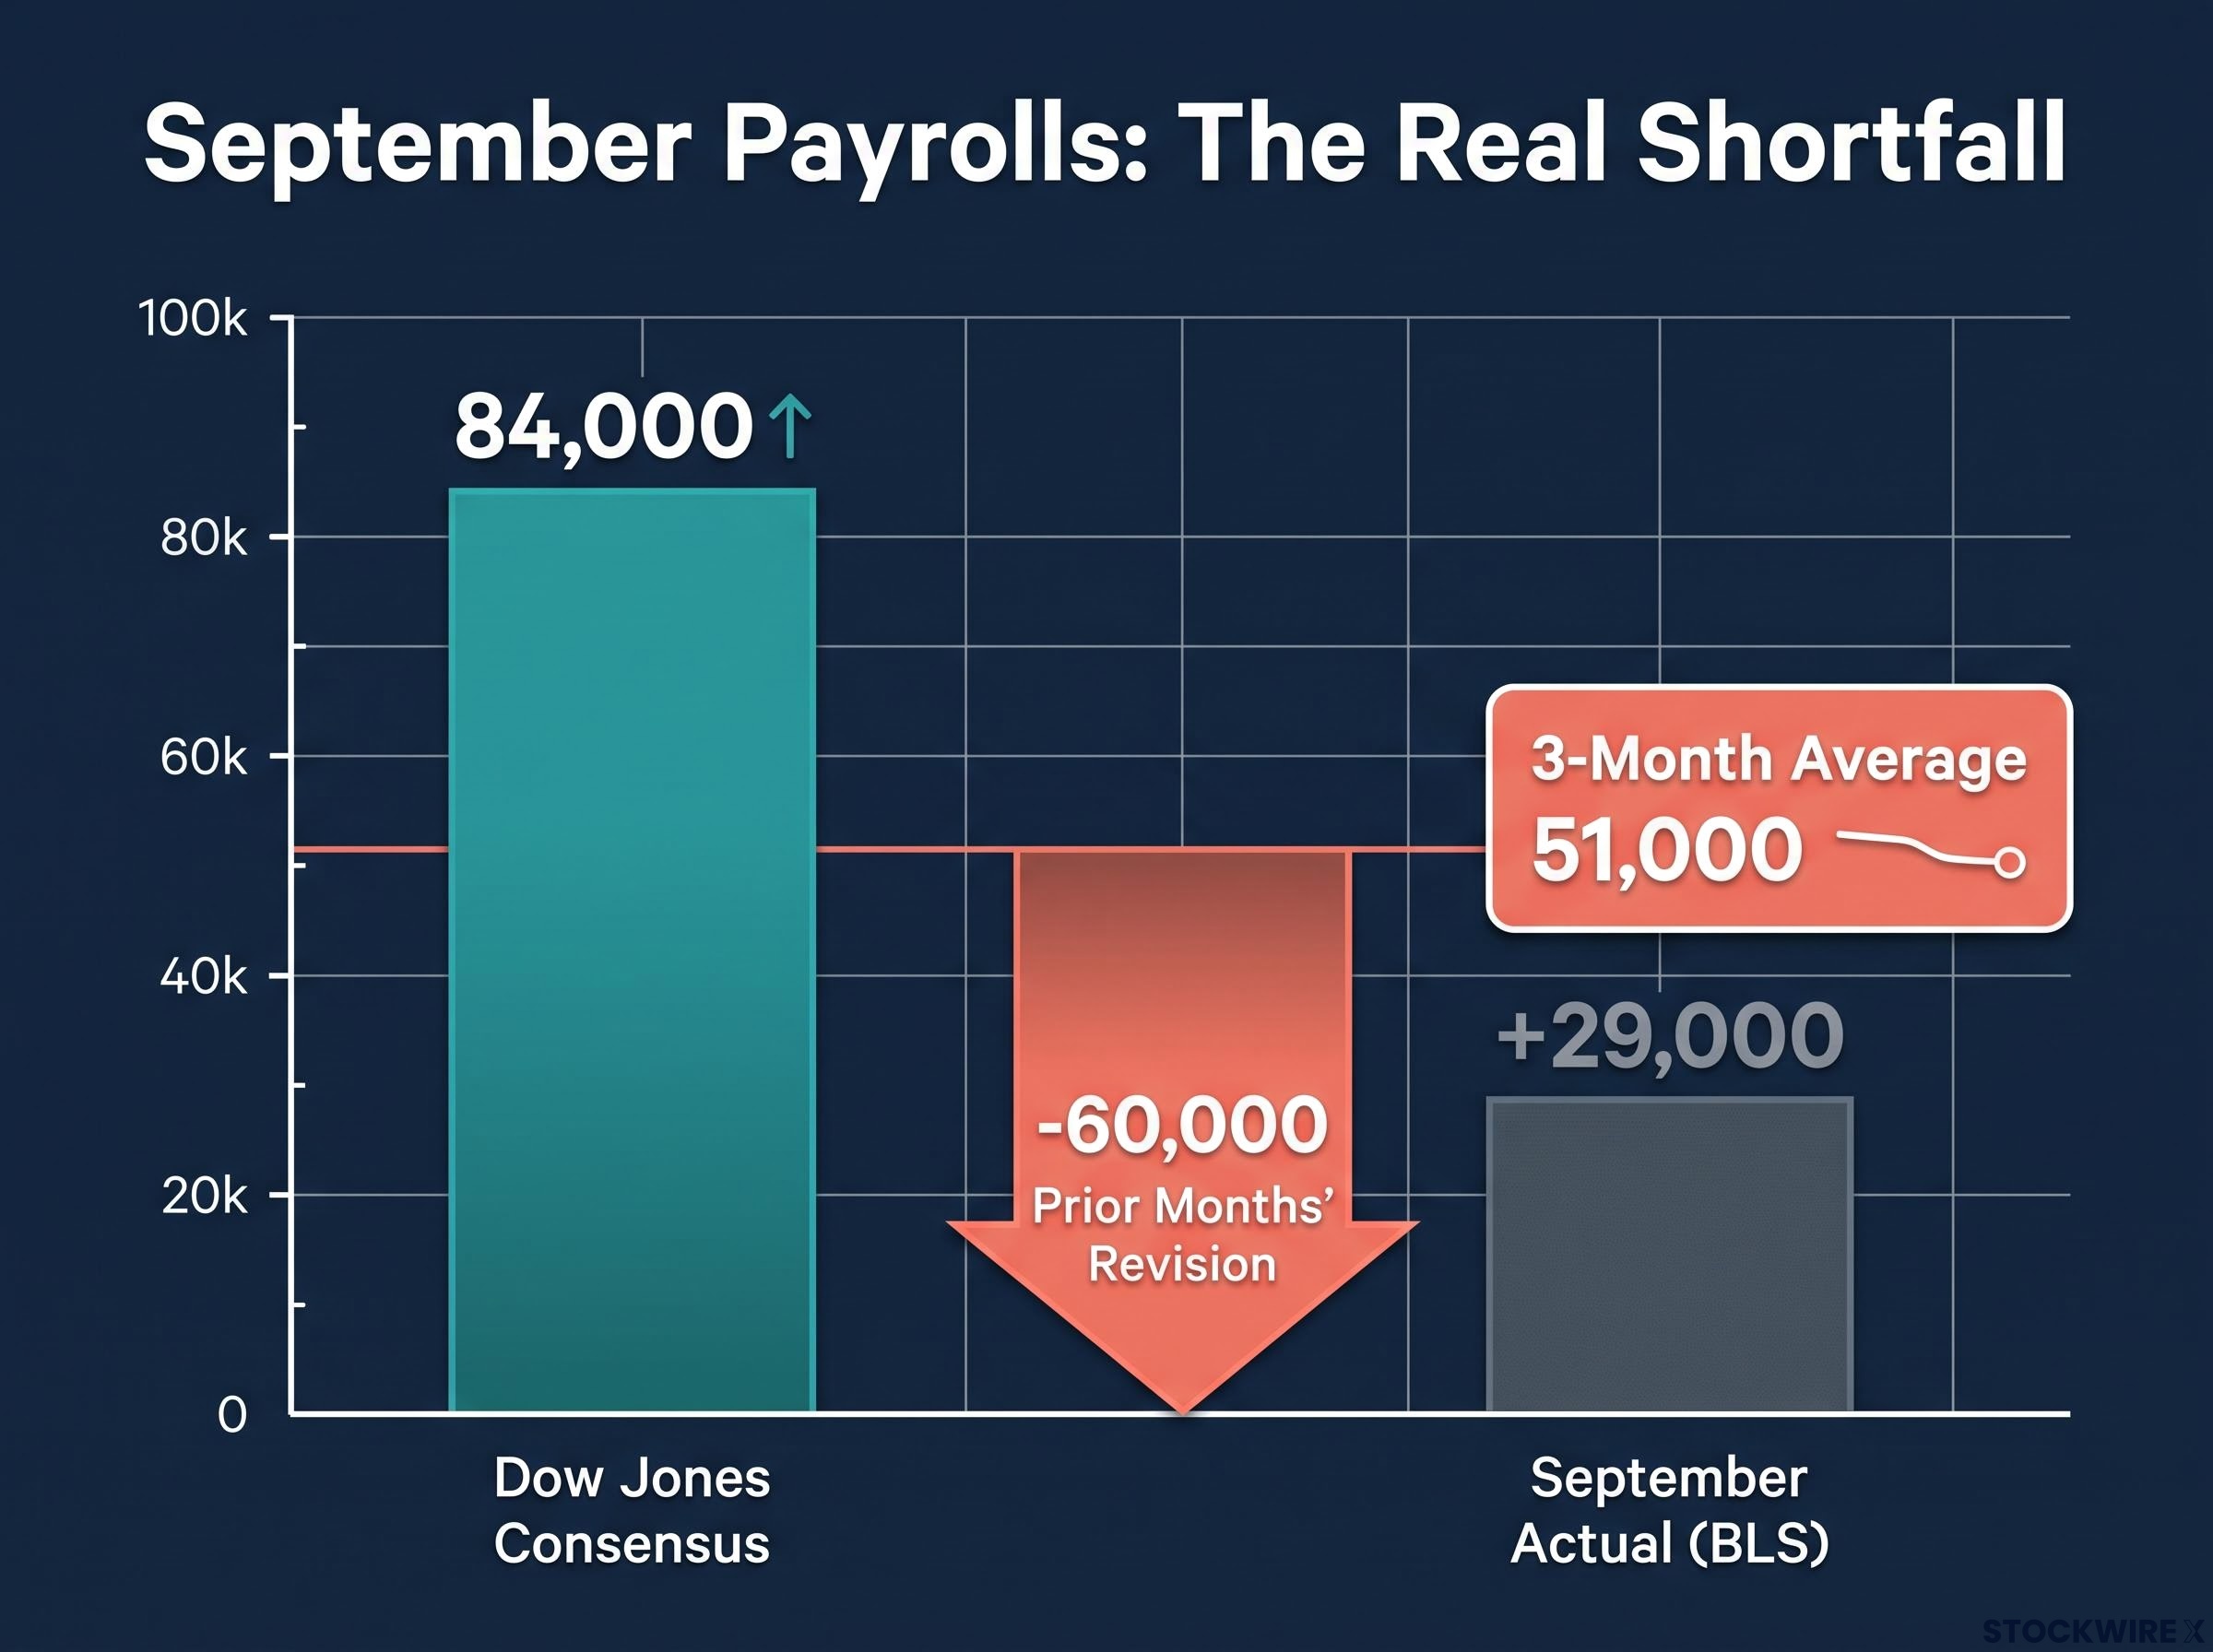
Three-month trend read ABN Amro’s Rogier Quaedvlieg describes the 51,000 three-month average as adequate relative to available labour supply but not indicative of an overheating job market.
The BLS itself characterised September payrolls as having “changed little.” That institutional language matters, because it signals the Fed is likely to read this report as evidence of a labour market losing momentum rather than one in freefall.
For anyone tracking Fed policy, the revision context is the real story. The Fed does not react to single prints; it reacts to trends. A softer-for-longer labour market, confirmed by downward revisions, shifts the central bank’s risk calculus toward caution on further tightening, because the cost of overtightening into a cooling market rises with every weak revision.
When big ASX news breaks, our subscribers know first
Why unemployment rose to 4.2% is not the whole story
The headline unemployment rate ticked up to 4.2%, above the 4.1% economists had expected. On its own, that reads as a warning. The detail underneath it reads very differently.
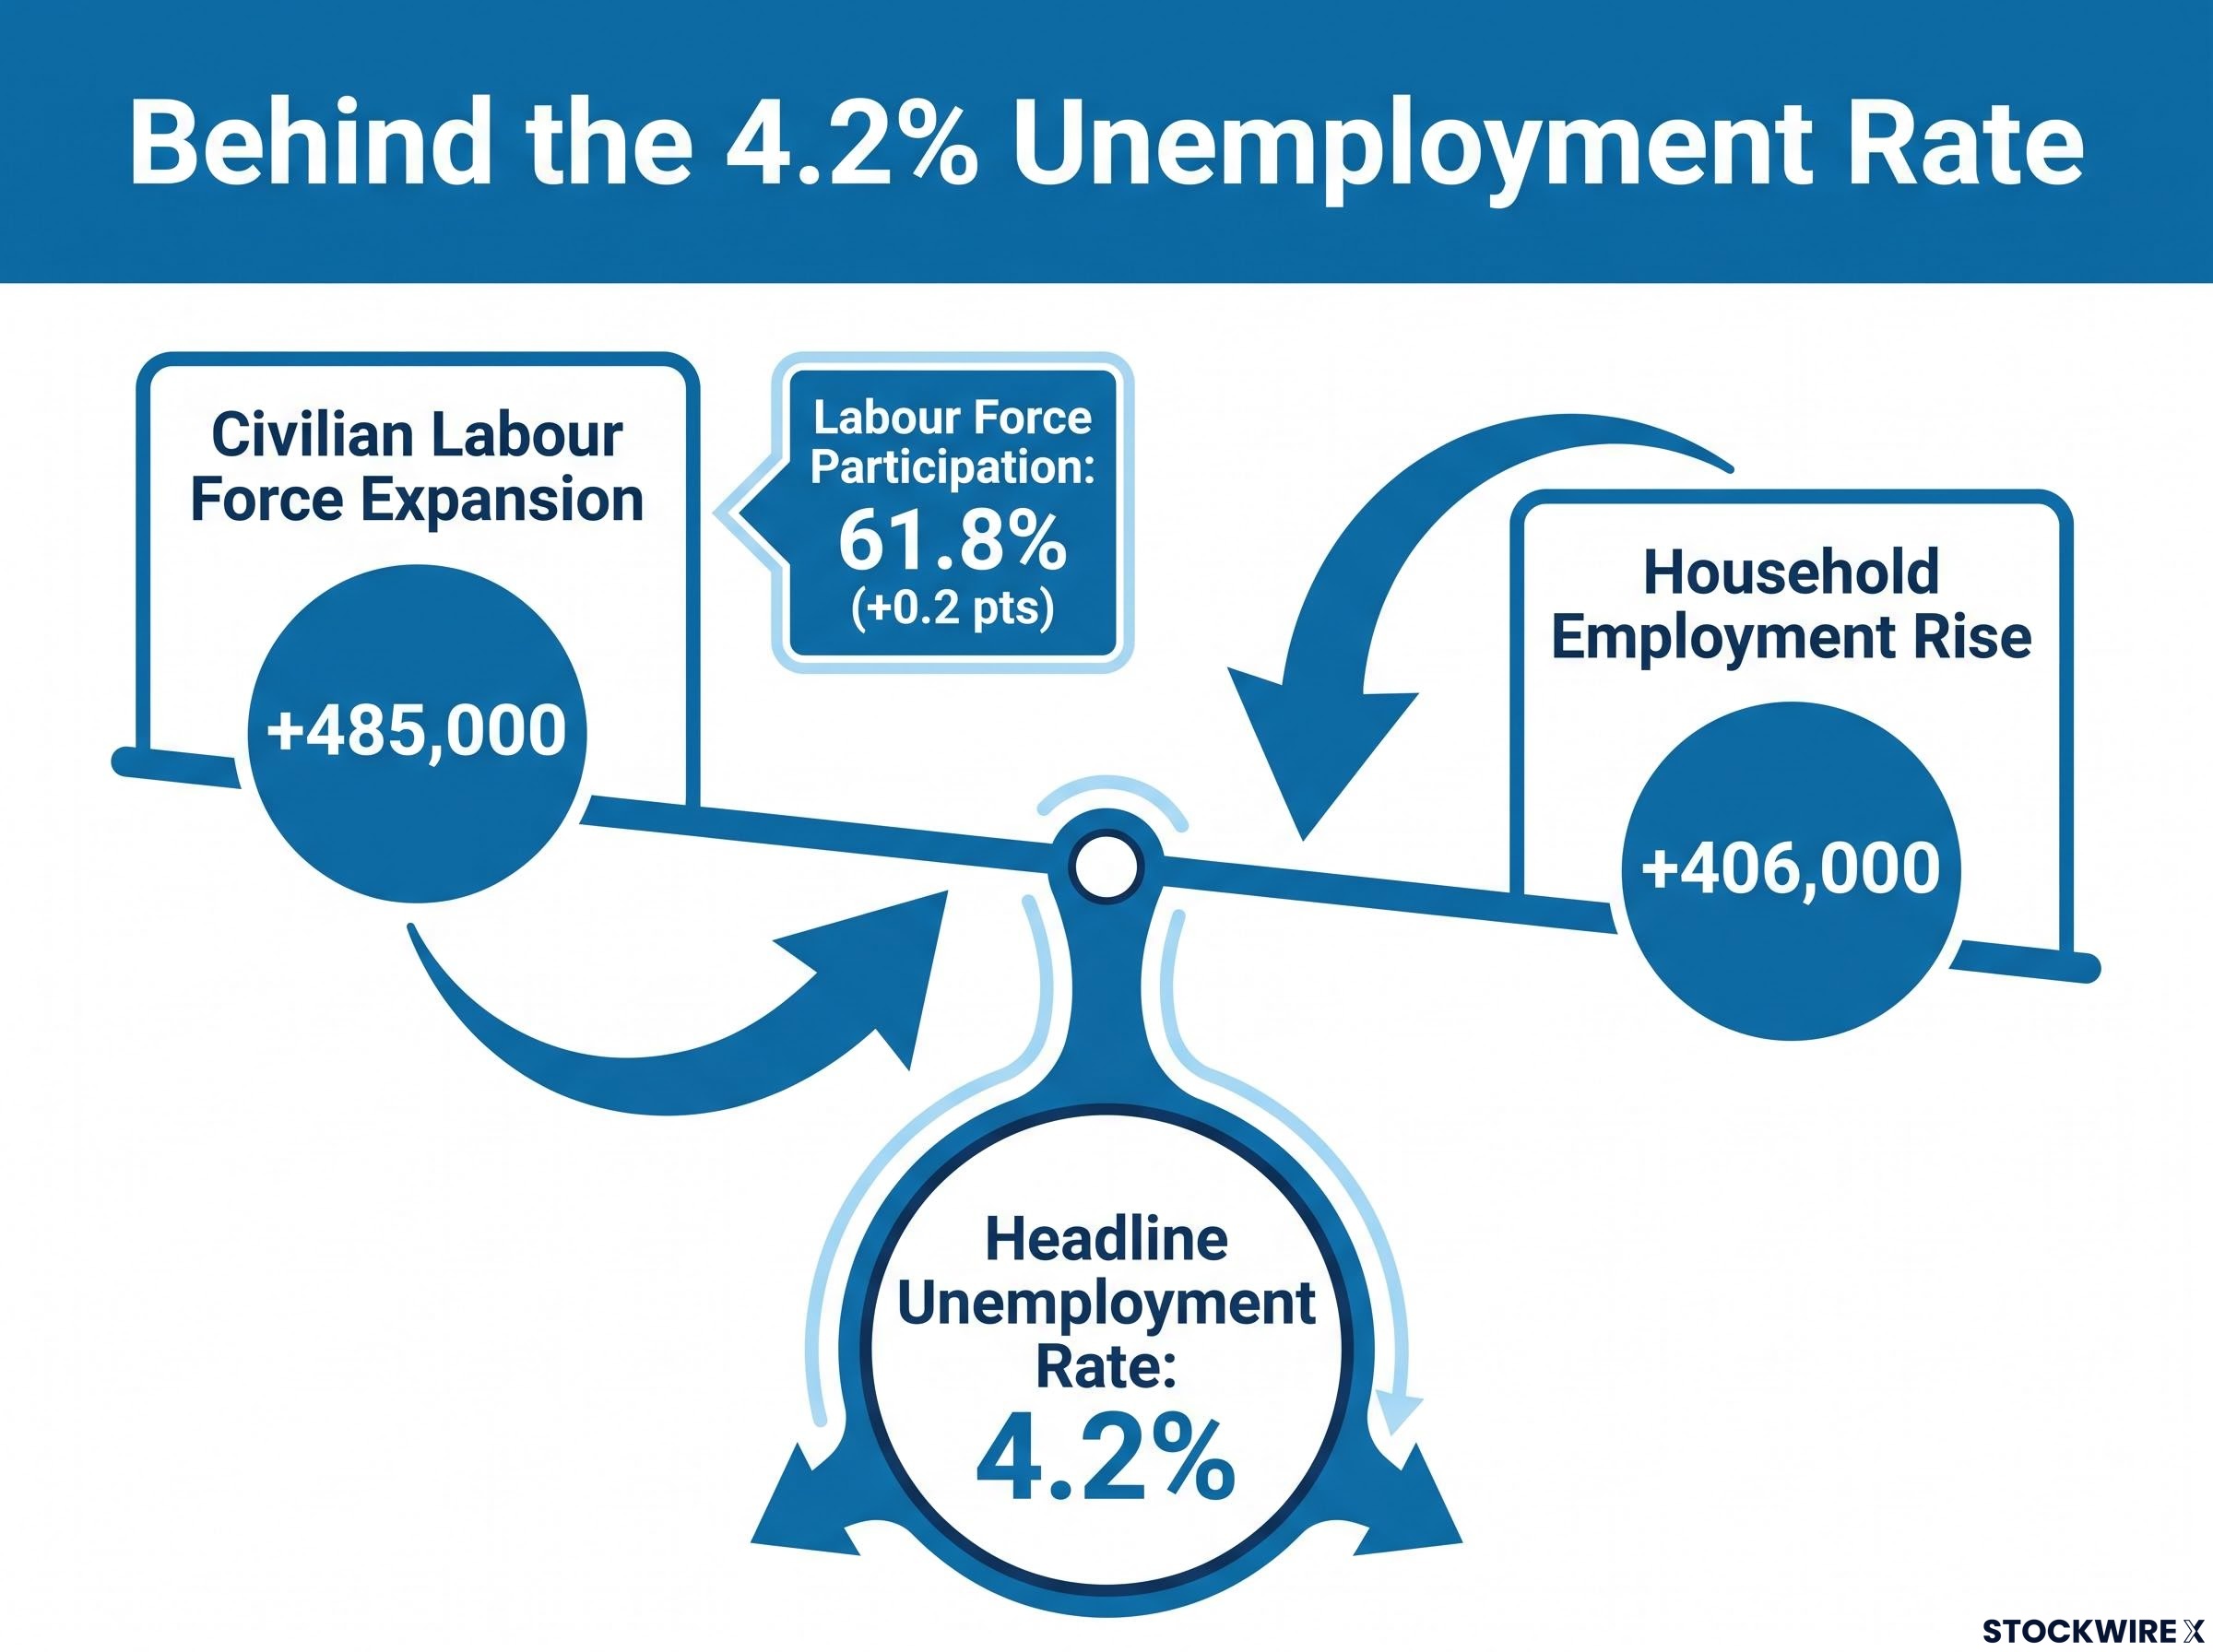
Labour force participation rose 0.2 percentage points to 61.8%. The civilian labour force expanded by 485,000 while household employment rose 406,000. More people entered the workforce than found jobs in that same month, which mechanically pushed the unemployment rate higher.
The unemployment-related figures that matter here:
- Unemployment rate: 4.2% (consensus 4.1%)
- Labour force participation: 61.8%, up 0.2 percentage points
- Civilian labour force expansion: +485,000
ABN Amro’s Quaedvlieg attributes the uptick in part to previously sidelined workers re-entering the labour force and actively seeking jobs. That is a confidence signal, not a distress signal.
Labour force participation tells a more complex story than the headline unemployment rate alone: the roughly 2 million Americans who exited the workforce between December 2025 and August 2026 mean the stable unemployment prints of recent months were partly a statistical artefact of workers stopping their job search rather than finding employment.
What the participation rate actually tells us
When more people join the workforce, the unemployment rate can rise even as the absolute number of employed people grows. The rate measures those looking for work as a share of the labour force, so a surge of new entrants can lift it without a single layoff occurring.
Historically, the Fed treats rising participation as a positive structural signal about labour market confidence rather than a red flag. A participation-driven increase in unemployment is a fundamentally different problem from a layoff-driven one.
That distinction changes everything for how you read this report. A headline that screams “slowdown” becomes, on inspection, a labour market still attracting workers off the sidelines. For the Fed, that means less pressure to respond aggressively to the rise in the jobless rate than the top-line figure might imply.
What subdued wages and softer PCE do to the Fed’s October calculus
Wage growth slowed too. Average hourly earnings rose $0.05 to $37.81, a gain of just 0.1% month-on-month and 3.0% year-on-year. With headline inflation running near 0.3% month-on-month, nominal pay of 0.1% means real wages are being compressed, squeezing household purchasing power.
The inflation side points the same way. According to Bureau of Economic Analysis (BEA) data summarised by Scotsman Guide, August headline PCE rose 0.3% month-on-month and 3.4% year-on-year, against forecasts of 0.4% and 3.7%. Core PCE, which strips out food and energy, came in at 0.2% month-on-month and 3.0% year-on-year, below the 0.3% and 3.3% expected.
Both wages and inflation undershooting at the same time pulls in one direction. CME FedWatch markets now price a 61.8% probability that the Fed holds in October, against just 38.2% for a 25 basis point hike, from a current federal funds target range of 3.75-4.00%.
| Indicator | Actual | Forecast | Source |
|---|---|---|---|
| Nonfarm payrolls (Sep) | +29,000 | ~84,000 | BLS / Dow Jones |
| Unemployment rate (Sep) | 4.2% | 4.1% | BLS |
| Avg hourly earnings YoY | 3.0% | — | BLS / ABN Amro |
| Headline PCE YoY (Aug) | 3.4% | 3.7% | BEA / Scotsman Guide |
| Core PCE YoY (Aug) | 3.0% | 3.3% | BEA / Scotsman Guide |
| Fed funds target range | 3.75-4.00% | — | FOMC |
A soft print is not a resolved problem, though.
Still above target Scotsman Guide observes that core inflation continues “moving in the wrong direction” relative to the Fed’s 2% target, meaning even an undershoot leaves prices rising too fast.
What this tells you is that the Fed’s dual mandate is tilting toward the employment side at the exact moment energy-driven inflation could pull policymakers the other way. That tension is what makes the October decision genuinely live rather than a foregone conclusion.
Where institutions diverge on December, and what the gap tells you
Serious analysts looking at the same data are reaching strikingly different conclusions. Ranked from most hawkish to most dovish, the institutional spectrum looks like this:
- BofA Global Research: Two further hikes, October and December, on the view that above-target inflation outweighs labour softness (Reuters brokerage survey, 15 September 2026).
- JPMorgan / Michael Feroli: A single December hike, a “one and done” move consistent with median FOMC projections (TheStreet, 29 September 2026).
- ABN Amro: One December hike, driven not by labour strength but by energy-related inflation risk (via FXStreet).
- Goldman Sachs: December is most likely, but the bank flags a strong chance that no further hikes prove necessary (The Star, 1 October 2026).
ABN Amro’s logic is worth drawing out. The December hike thesis is not about a hot jobs market; it is about stopping energy-driven headline PCE from unanchoring inflation expectations and feeding into wage demands, the same reasoning that sat behind the Fed’s September increase.
Energy-driven inflation is ABN Amro’s central rationale for a December hike, but the channel through which war-related fuel costs are filtering into core measures is less visible than the headline numbers suggest: diesel prices running approximately 50% above pre-conflict levels are embedding themselves in airfares, logistics, and imported goods in ways that standard CPI and PCE categories do not fully capture.
Goldman sits at the other end of the range.
Goldman Sachs on the December call The bank notes “a strong chance that the FOMC will ultimately conclude that additional rate hikes are unnecessary.”
Market pricing lands in the middle of this institutional spread. CME FedWatch shows an 86.7% cumulative probability of at least one more hike by year-end, with 56.7% priced for a cumulative 25 basis points and 30.0% for a cumulative 50 basis points.
The gap between BofA and Goldman is not forecasting noise to be dismissed. It reflects genuine ambiguity over how the Fed will weigh energy-driven headline inflation against real-economy softness. Where you sit on that spectrum determines how you should read every data release between now and December, and that uncertainty has direct consequences for rate-sensitive assets and borrowing costs through year-end.
What the data combination means before the Fed goes quiet
The Fed’s immediate challenge is one of timing. Two soft data points, jobs and PCE, have landed days before the October meeting blackout period, against a backdrop of core PCE still at 3.0% versus a 2% target and an unresolved energy price picture.
Single monthly reports are imperfect policy signals, and this one carries its own health warning. The 60,000 downward revision to prior months is a reminder that payroll data is noisy and revision risk cuts both ways. Add the real wage compression, nominal earnings of 0.1% against headline inflation near 0.3%, and the read on consumer demand becomes murkier still.
That recalibration is already visible in institutional behaviour: Goldman Sachs moved its next-hike forecast from October to December as the data softened. Interactive Brokers, meanwhile, has flagged unusually wide forecast ranges for PCE, a signal that energy-driven inflation dynamics are genuinely hard to read right now.
Three data points that will settle the December question
- The next PCE print. A further undershoot would strengthen the case for a hold; a renewed energy-led jump toward target-threatening levels would hand the hawks their rationale.
- The energy price trajectory. Sustained fuel price rises keep the December hike alive on inflation-expectations grounds; a reversal removes ABN Amro’s central argument for moving.
- October employment data. A confirmation of September’s softness tilts the balance toward a hold; a sharp rebound or upward revisions would reopen the door to tightening.
For anyone tracking the Fed’s path, the practical takeaway is straightforward. October now looks like a hold, December remains genuinely contested, and the next two data releases, not today’s jobs report in isolation, will be the decisive inputs.
For investors tracking how the Fed’s structural calendar shapes policy windows, our deep-dive into FOMC meeting frequency examines the Warsh proposal to reduce annual meetings from eight to six and what that would mean for how data releases between sessions are weighted by markets.
This article is for informational purposes only and should not be considered financial advice. Investors should conduct their own research and consult with financial professionals before making investment decisions.
Past performance does not guarantee future results. Financial projections and rate-path expectations are speculative, subject to change based on market developments, and dependent on incoming economic data.