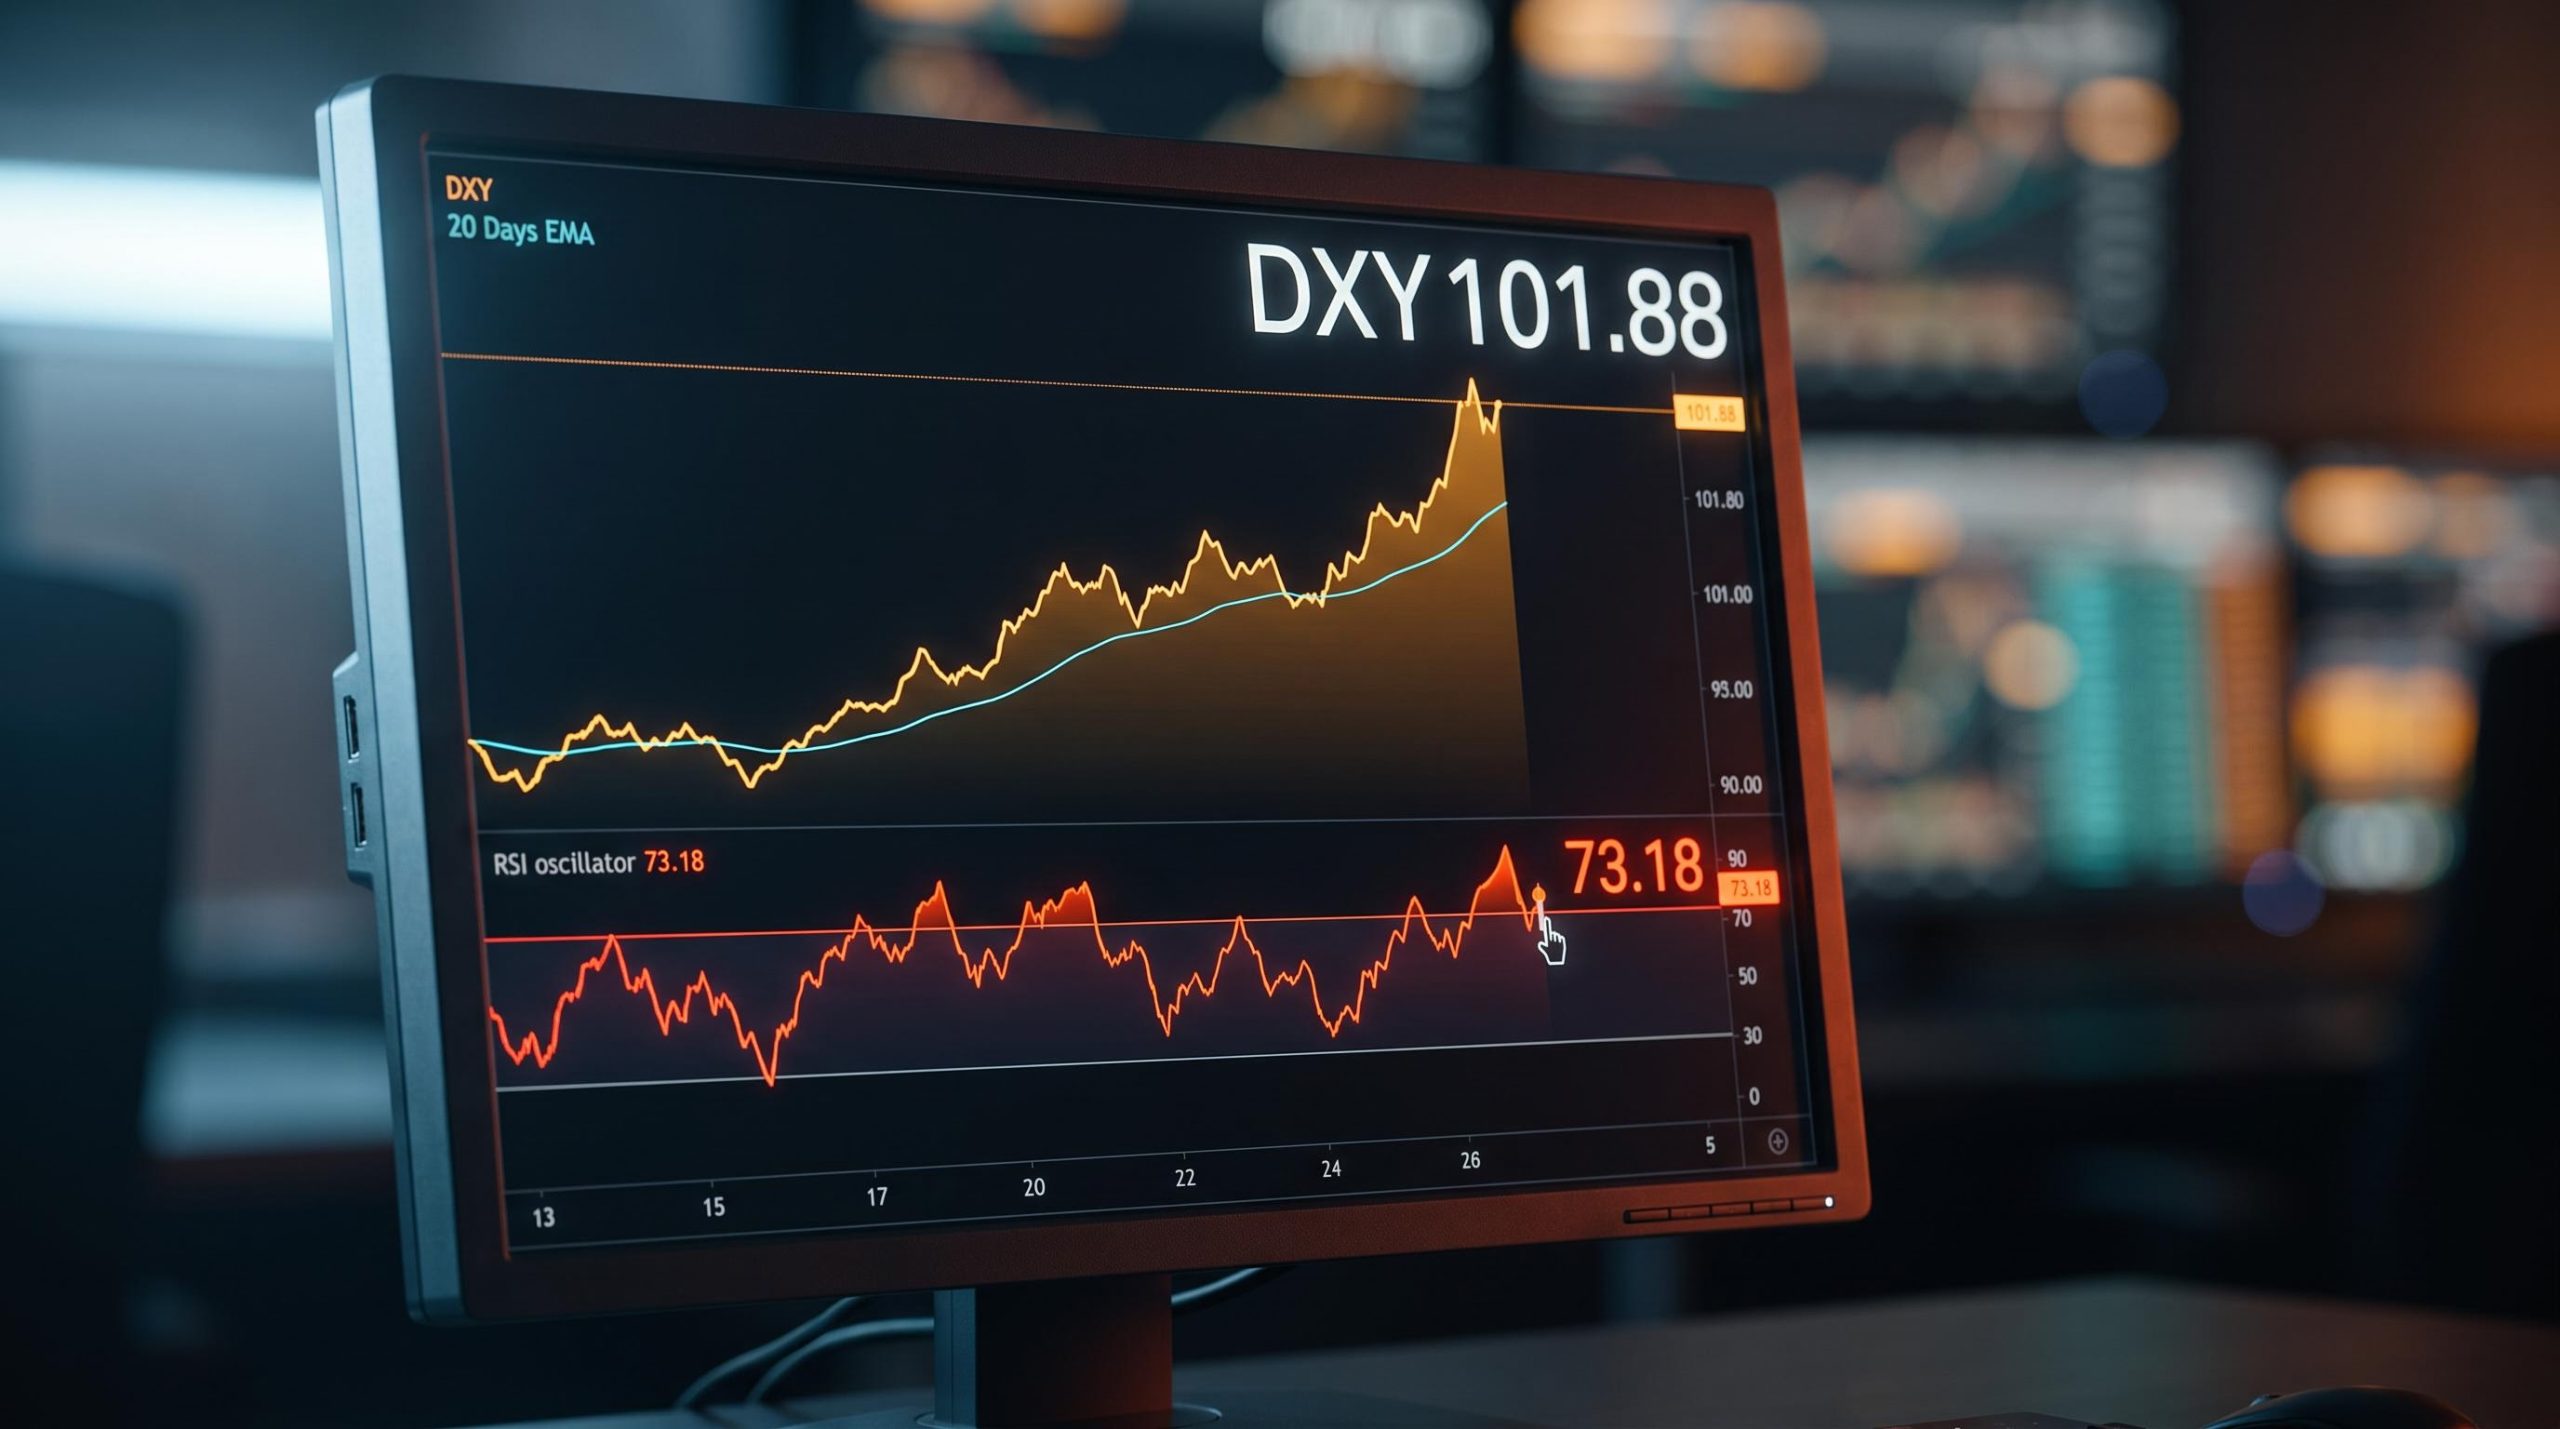
Here is a scenario that trips up more traders than almost any other signal on the charts. The US Dollar Index (DXY) is sitting at a 14-period RSI of 73.18, firmly in overbought territory, and a wave of traders position for the reversal. It does not come.
That single moment holds the whole problem. The dollar sits on one side of 89% of all global foreign exchange (FX) trades, according to the Bank for International Settlements (BIS) 2025 Triennial Central Bank Survey covering April 2025, which means its moves feed directly into your import costs, your international equity returns, commodity prices, and the cost of borrowing. A currency this central does not bend to a single momentum oscillator.
Learning how to read a dollar rally is a skill you will use well beyond this moment. After this, you will know how to tell a technically overextended rally apart from a fundamentally grounded one, and what that difference means for the positions you are weighing right now.
Why the dollar commands the global stage
Before you read any single rally, you need to understand the ground it stands on. The dollar is not just another currency that happens to be large. It is the baseline against which almost everything else in global finance is priced, and that baseline gives it a floor most currencies simply do not have.
That role was not inevitable. The dollar replaced the British pound as the world’s primary reserve currency in the years after World War II, and its final link to gold was cut when the Bretton Woods Agreement ended in 1971. What has held it in place since is structural, not sentimental.
Three pillars carry that dominance:
- Deep US capital markets that can absorb enormous flows of foreign capital without seizing up
- Legal and institutional stability that makes dollar assets a default store of value
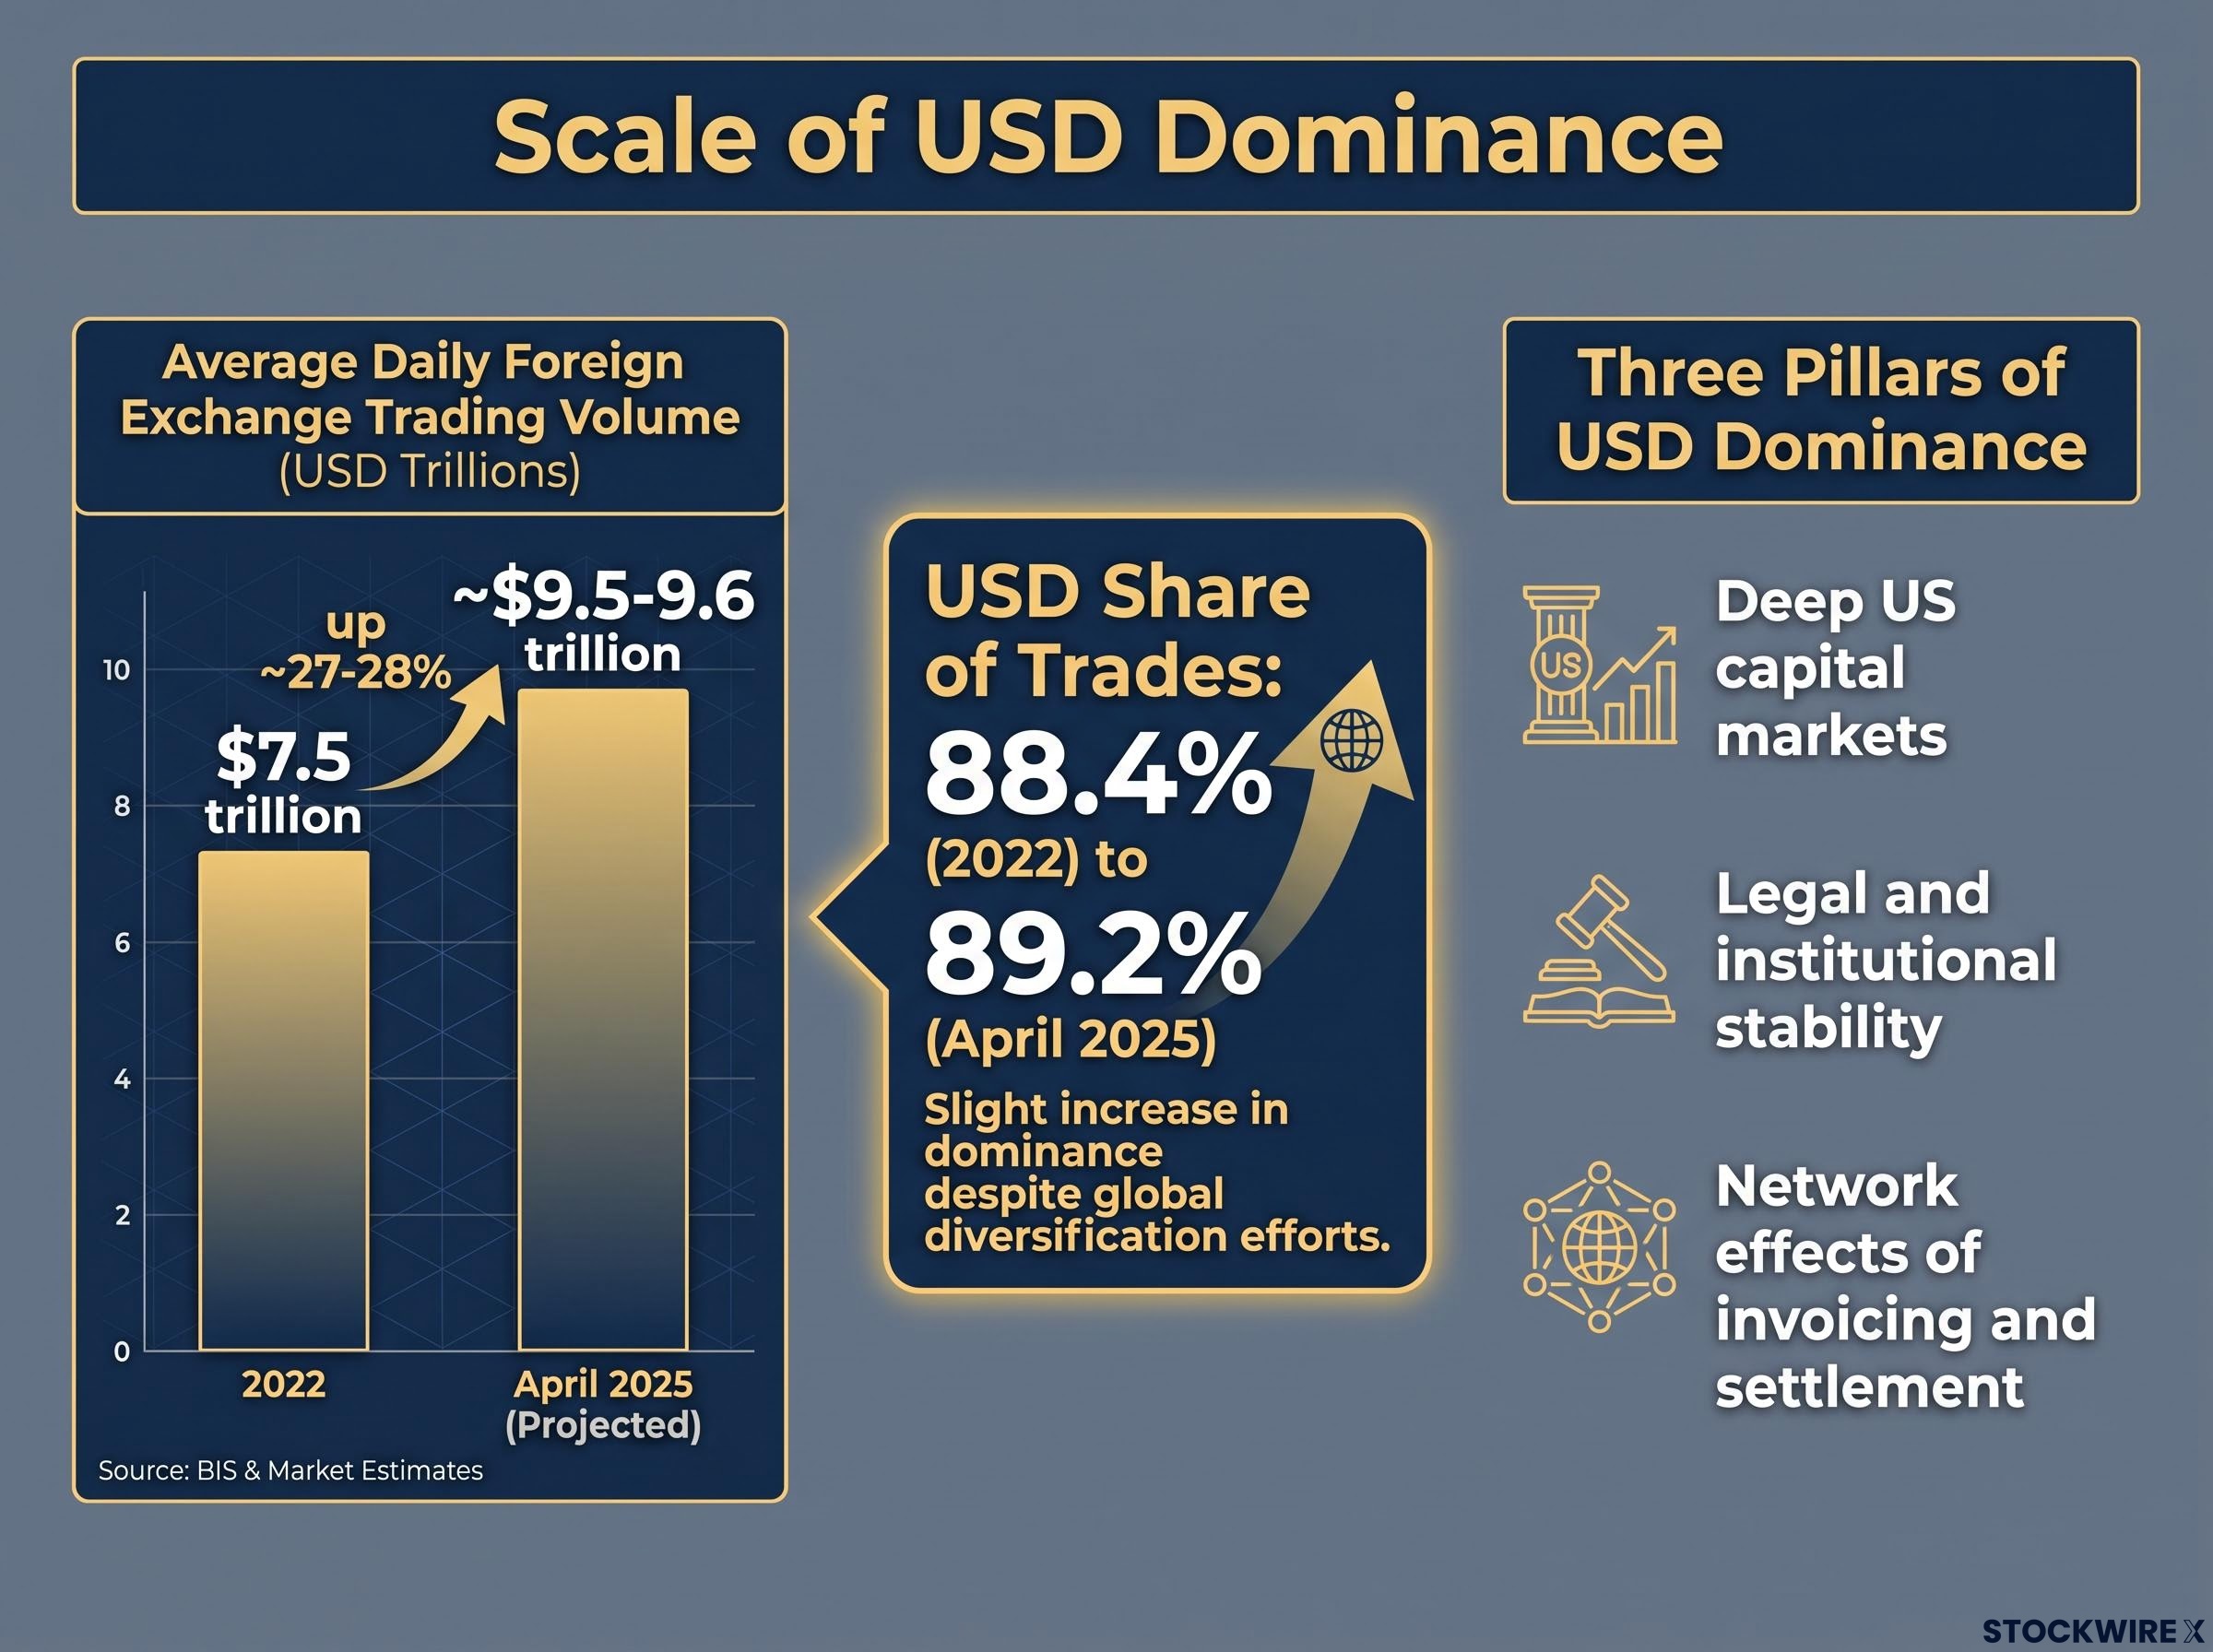
- Network effects of invoicing and settlement, where so much global trade is already priced in dollars that using anything else adds cost and friction
This is not a theoretical construct. It is measurable, and the most recent BIS Triennial Survey puts a number on it.
The dollar’s reserve-currency role extends well beyond the FX market itself: roughly 60% of international debt securities and cross-border loans are denominated in dollars, which means rate moves and dollar strength ripple into corporate balance sheets and sovereign borrowing costs far outside the United States.
The US dollar held its place as the most-traded currency, sitting on one side of 89% of all FX trades in April 2025 (BIS media release). The BIS analytical note “OTC foreign exchange turnover in April 2025” puts the figure more precisely at 89.2%, up from 88.4% in 2022.
The scale behind that share is worth seeing in full.
| Survey Year | Global Daily FX Turnover | USD Share of Trades |
|---|---|---|
| 2022 | $7.5 trillion | 88.4% |
| 2025 | ~$9.5-9.6 trillion | 89% (89.2% per analytical note) |
Daily FX turnover reached roughly $9.5-9.6 trillion in April 2025, up around 27-28% from the 2022 figure of $7.5 trillion. When you watch the DXY move, you are not watching one currency pair. You are watching a signal that reverberates through commodity prices, emerging market debt costs, and international equity returns at once.
The BIS Triennial Survey FX turnover data puts daily OTC FX market volume at $9.6 trillion in April 2025, with the US dollar on one side of 89.2% of all trades, the authoritative benchmark figure that structural and cyclical frameworks both anchor to when sizing the dollar’s global footprint.
Here is why that matters for how you read any rally: even a sharp dollar correction happens inside a structurally dominant regime. Knowing where the floor sits helps you calibrate how alarmed, or how optimistic, any given move should actually make you.
When big ASX news breaks, our subscribers know first
How Fed policy moves the dollar, and why the transmission matters
If structure sets the floor, the Federal Reserve sets the direction over the medium term. The trick is not knowing that Fed hikes and dollar strength tend to move together. It is understanding the sequence that connects them, so you can read the implication of a decision before the price confirms it.
Start with the Fed’s job. It operates under a dual mandate of price stability and maximum employment, and it has three main tools to pursue it: interest rate adjustments, quantitative easing, and quantitative tightening. Rate changes are the headline instrument, and they move the dollar through a clear chain.
The Fed’s dual mandate creates a structural tension that shapes every rate decision: when inflation runs above target while unemployment sits near historical lows, the committee leans hardest on the farthest-off goal, which in the current cycle means price stability has consistently won the priority argument over employment support.
That chain runs in three steps:
- The Fed raises rates above its peers, and the yield differential (the gap between what US assets pay and what comparable assets abroad pay) widens in the dollar’s favour.
- Foreign capital flows into USD-denominated assets such as Treasuries and money-market instruments to capture that higher yield.
- Demand for the dollar itself rises, because buying those assets means buying dollars first.
This is the standard carry and interest-parity logic that currency strategists at JPMorgan, Goldman Sachs, and Citi routinely point to as the primary channel. The most recent live example is concrete.
On 16 September 2026, the Federal Open Market Committee (FOMC) raised the federal funds rate target range by 25 basis points to 3.75-4.00%, with the interest rate on reserve balances set at 3.90% and the primary credit rate at 4.0%. The statement noted that inflation “remains elevated” and framed the hike as supporting a “timelier return” to the Committee’s 2% inflation goal.
A 25-basis-point move widens the yield gap and signals ongoing policy divergence, exactly the environment where professional FX desks expect a sustained dollar bid. There is a second channel worth knowing: the safe-haven dynamic. When Fed tightening slows global growth or lifts volatility, investors shift into US cash and Treasuries, which can push the dollar higher than rate differentials alone would predict.
One caveat keeps this from being mechanical. A hike markets read as the last in a cycle can sometimes weaken the dollar, because traders immediately price the cuts that follow. JPMorgan, Goldman Sachs, and Citi analysts have all flagged this forward-guidance effect. The lesson for you is that direction often sits in the expected path, not just the current rate.
QE versus QT: the balance-sheet tools and their dollar effects
Quantitative easing (QE) is when the Fed expands the money supply by buying government bonds from financial institutions. By increasing the supply of dollars, QE typically puts downward pressure on the currency.
Quantitative tightening (QT) runs the other way. The Fed lets its holdings mature without reinvesting the proceeds, gradually draining liquidity, which tends to support dollar strength.
Right now, neither is running hard. The September 2026 Implementation Note describes a steady-balance-sheet, ample-reserves regime, with principal payments rolled over rather than actively shrunk. When you check the balance-sheet layer today, read it as neutral, not as a tailwind or a headwind.
Reading the technical signals on a DXY chart
Now to what you actually see on the chart. Technical signals are timing tools, and each one behaves in a specific way during a dollar rally. Understanding why they behave that way is what stops you from misreading them.
Start with the moving average. The 20-day exponential moving average (EMA), a line that tracks the average price over the last 20 days and weights recent prices more heavily, acts as a dynamic support floor. In the source snapshot, the DXY sat at 101.88 while holding above its 20-day EMA at 100.70, which kept the short-term bias positive and marked the first line of defence in any pullback.
Then there is momentum. The 14-period RSI (Relative Strength Index), which measures the speed of recent price changes on a scale of 0 to 100, was reading 73.18, above the conventional overbought threshold of 70. The retail instinct is to treat that as a sell signal. The data says otherwise.
Finally, resistance. These are price zones where sellers have historically stepped in, not guaranteed reversal points. Near-term resistance sat at 102.20, the annual peak at the time of the snapshot, with secondary resistance at 103.03, the high from 10 April 2025.
Here are those levels in one view.
| Indicator | Value | What It Signals |
|---|---|---|
| 20-day EMA | 100.70 | Dynamic support floor |
| 14-period RSI | 73.18 | Overbought, but trend intact |
| Near-term resistance | 102.20 | Annual peak |
| Secondary resistance | 103.03 | 10 April 2025 high |
An RSI of 73.18 tells you the rally is extended, not that it is finished. In strong uptrends driven by genuine rate differentials, the index can stay overbought for weeks. The history backs this up: during the 2014-2015 USD bull run, daily RSI registered overbought repeatedly while the trend kept climbing, and USD/JPY in 2022 held deeply overbought for extended stretches before finally reversing on policy signals, not on the oscillator.
So when does an overbought RSI actually earn your attention as a reversal signal? Analysts at Citi, BNP Paribas, and Morgan Stanley point to three conditions:
RSI divergence carries meaningfully more analytical weight than an RSI threshold reading: a 2024 academic study of Nifty 50 equities found that RSI divergence at structural confluence levels achieved an 87.61% success rate across three eight-year windows, compared to threshold signals, which show no proven edge in live trading environments.
- It coincides with a key resistance level
- Momentum diverges, meaning price makes a new high while RSI fails to confirm it
- A clear fundamental catalyst appears, such as a shift in Fed guidance
Knowing what each signal genuinely means, rather than what retail lore says it means, protects you from the most expensive mistake in currency analysis: fading a structurally grounded rally because a momentum gauge flashed red.
Putting the frameworks together: structural, cyclical, and technical in the same view
No single indicator produces conviction. Alignment across frameworks does. Moving from single-indicator thinking to integrated analysis is the step that separates disciplined reading from reactive trading.
There are three layers to hold at once:
- Structural: the dollar’s reserve-currency role and its 89.2% share of global FX trades, which sets the baseline
- Cyclical: the Fed’s stance relative to peer central banks and global risk appetite, which drives medium-term swings
- Technical: moving averages, RSI, and resistance levels, which help you time entries and exits
The 2022 USD rally is the case study where all three lined up. Structural dominance was never in doubt. Cyclically, the Fed was out-tightening peers while the Bank of Japan held yield curve control, creating an extreme rate differential, and global risk-off sentiment amplified the safe-haven bid. Technically, the DXY printed a clean uptrend with breaks above prior resistance. Conviction came from the stack, not any one line.
| Framework | What It Tells You | Key Limitation |
|---|---|---|
| Structural | The dollar’s baseline dominance and reserve role | Slow to change; does not time rallies |
| Cyclical | Fed policy and risk appetite driving medium-term direction | Can reverse quickly on policy signals |
| Technical | Moving averages and RSI timing entries and exits | Lags fundamental shifts; false signals in strong trends |
The cyclical read itself is contested, and the debate is worth knowing:
- Some strategists at JPMorgan, Goldman Sachs, and Citi weight current yield differentials most heavily as the driver of a rally
- Others at BNP Paribas and Morgan Stanley focus on forward terminal rate expectations and the future policy path, arguing that where rates are headed matters more than where they sit
Valuation models add a further check. Behavioural equilibrium exchange-rate (BEER) and purchasing-power parity (PPP) frameworks flag when the dollar looks overvalued, with the important caveat that structural demand can keep it overvalued for a long time.
When the frameworks disagree, and what that tells you
The harder read comes after a major peak. Cyclical and fundamental signals may begin softening, slowing inflation, an expected Fed pause, improving conditions abroad, while the technical trend still looks bullish.
In these episodes, technicals tend to catch up to the fundamental turn rather than lead it. A technically bullish reading becomes a lagging reflection of a condition that may already be changing beneath it.
When macro signals shift but technicals hold, the move is to reduce position size rather than add, and to wait for technical confirmation of the fundamental thesis before acting. The divergence itself is the signal.
Building the habit of multi-signal currency analysis
All of this collapses into a sequence you can run against any DXY chart. The point is not to memorise a framework you will forget by the next news cycle, but to build a repeatable check you reach for automatically.
Run it in this order:
- Assess the structural baseline. BIS turnover data and reserve-currency status tell you the floor is firm. The dollar’s 89.2% share of global FX trades is not shifting week to week.
- Assess the cyclical driver. Look at what the Fed is doing relative to peers and what global risk sentiment is doing. The September 2026 hike to 3.75-4.00%, paired with “inflation remains elevated” language, argues for continued support at this layer.
- Consult the technical picture. Check where price sits against the 20-day EMA, read the RSI, and mark the resistance levels overhead.
The most common error is treating an overbought RSI as a standalone sell signal. As the 2014-2015 and 2022 episodes show, overbought can persist for weeks in a trend driven by rate differentials. An RSI alone will get you stopped out of a valid move.
RSI becomes actionable only at confluence. Give it weight when:
- Price is approaching a key resistance level
- Momentum is diverging from price
- A fundamental catalyst, such as a Fed guidance shift, aligns with it
Apply that to the snapshot. An RSI of 73.18 with price at 101.88 pushing toward resistance at 102.20 is exactly the confluence zone worth watching, but only read against the Fed’s current tightening bias and the structural baseline beneath it. Running this three-layer check before you react to any single signal is what spares you the costly habit of mistaking an extended rally for a reversal.
For readers wanting to see the same moving average, RSI, and macro cross-check framework applied to a live currency pair setup, our comprehensive walkthrough of multi-factor currency analysis uses GBP/USD in September 2026 to show how directional accuracy rises from roughly 60% with one factor to approximately 85% when three analytical families align.
Reading the dollar well is a skill that compounds
The most useful thing you now hold is not the meaning of any one indicator. It is the habit of weighting competing signals when they point in different directions.
Apply it to where the dollar sits today. The structural layer is clear, with the dollar on one side of 89% of global FX trades. The cyclical layer, the September 2026 hike, elevated inflation, and an ongoing tightening bias, argues for continued support. The technical picture, RSI at 73.18 with resistance approaching at 102.20, calls for patience rather than aggression on fresh longs.
What makes this framework self-updating is knowing what would change the read: a clear dovish pivot from the Fed, a narrowing of yield differentials with peers, or a clean break below the 20-day EMA. Those are the variables worth monitoring from here.
This article is for informational purposes only and should not be considered financial advice. Investors should conduct their own research and consult with financial professionals before making investment decisions. Past performance does not guarantee future results, and forward-looking statements are speculative and subject to change based on market developments.