TLT’s implied volatility rank is sitting at 100, or above it on some platforms, and your first instinct is probably to sell premium. That instinct is wrong, and the options chain will show you exactly why if you know where to look.
This is a practical lesson in how a high implied volatility (IV) rank reading on a structurally low-volatility instrument can push you toward the wrong trade, and how the same chain quietly points you toward a more interesting opportunity on the call side.
TLT, the iShares 20+ Year Treasury Bond ETF, currently trades near $79 after falling more than 50% from its August 2020 peak of roughly $179, as long-term yields climbed above 5%. That macro backdrop shapes everything the options market is pricing right now.
US Treasury market risk has been repriced materially since 2020, with the 10-year yield touching 5.01% against total public debt of $40 trillion and major sovereign funds beginning to reduce their allocations, a backdrop that explains why the options market is pricing structural uncertainty into longer-dated TLT contracts rather than treating the current yield level as temporary.
Here is what you will take away: a transferable framework for reading options signals on bond ETFs. How to interpret IV rank when the absolute range is narrow, what call-side skew in longer-dated contracts tells you about market sentiment, and how to think about building directional exposure through long-dated out-of-the-money calls when absolute volatility is modest but the macro setup is lopsided. The framework extends to any low-volatility ETF where rank and absolute IV tell different stories.
What the options chain is actually telling you about TLT right now
Here is the contradiction. TLT’s implied volatility is simultaneously at the very top of its one-year range and modest in absolute terms. Both statements are true at the same time, and the tension between them is the whole puzzle.
Look at the readings across platforms as of late September and early October 2026.
| Platform | 30-day IV | IV rank | IV percentile |
|---|---|---|---|
| OptionCharts | 17.51% | 106.67% | 99.6 |
| OptiView | 16.9% | 100/100 | – |
| ApexVol | 16.4% | – | 100.0 |
| Saxo | 15.4% | – | Higher than all but 3 of prior 252 days |
| Option Alpha | 18.43% | 101.57 | – |
Every platform agrees: IV rank and percentile are pinned at or above the one-year high. Yet the absolute IV sits in the mid-teens, a level that would barely register on a single stock or a high-beta index.
That backdrop matters. With the ETF near $79.42, the 30-year Treasury yield around 5.47%, and the 10-year near 5.25%, TLT has already done most of its moving. The options market is now pricing what comes next.
And it is pricing more than the ETF has actually delivered. Saxo’s data shows 15.4% implied volatility against just 11.6% realised volatility over the prior month.
Implied vs. realised Roughly 15.4% implied volatility against 11.6% realised over the prior 30 days. Options are priced for more movement than the ETF has produced.
That gap is your first signal. The market is charging for a regime that has not yet arrived. Reading these two numbers together, the stretched rank and the modest absolute level, is the prerequisite for everything that follows. Get this wrong at the start and you reach the wrong strategy conclusion.
When big ASX news breaks, our subscribers know first
Why IV rank misleads on a bond ETF, and why premium selling fails here
Start with what IV rank actually measures. According to Barchart’s definition, IV rank compares today’s implied volatility against the highest and lowest readings over the past year. A rank of 100% means current IV equals the one-year high. A rank of 0% means it equals the one-year low. It is a relative measure, not a statement about how volatile the instrument actually is.
The rank and percentile figures only make sense once you have a firm grip on implied volatility mechanics: IV is extracted by reverse-engineering the pricing model from live market prices, making it a real-time measure of collective market expectation rather than a backward-looking summary of what already happened.
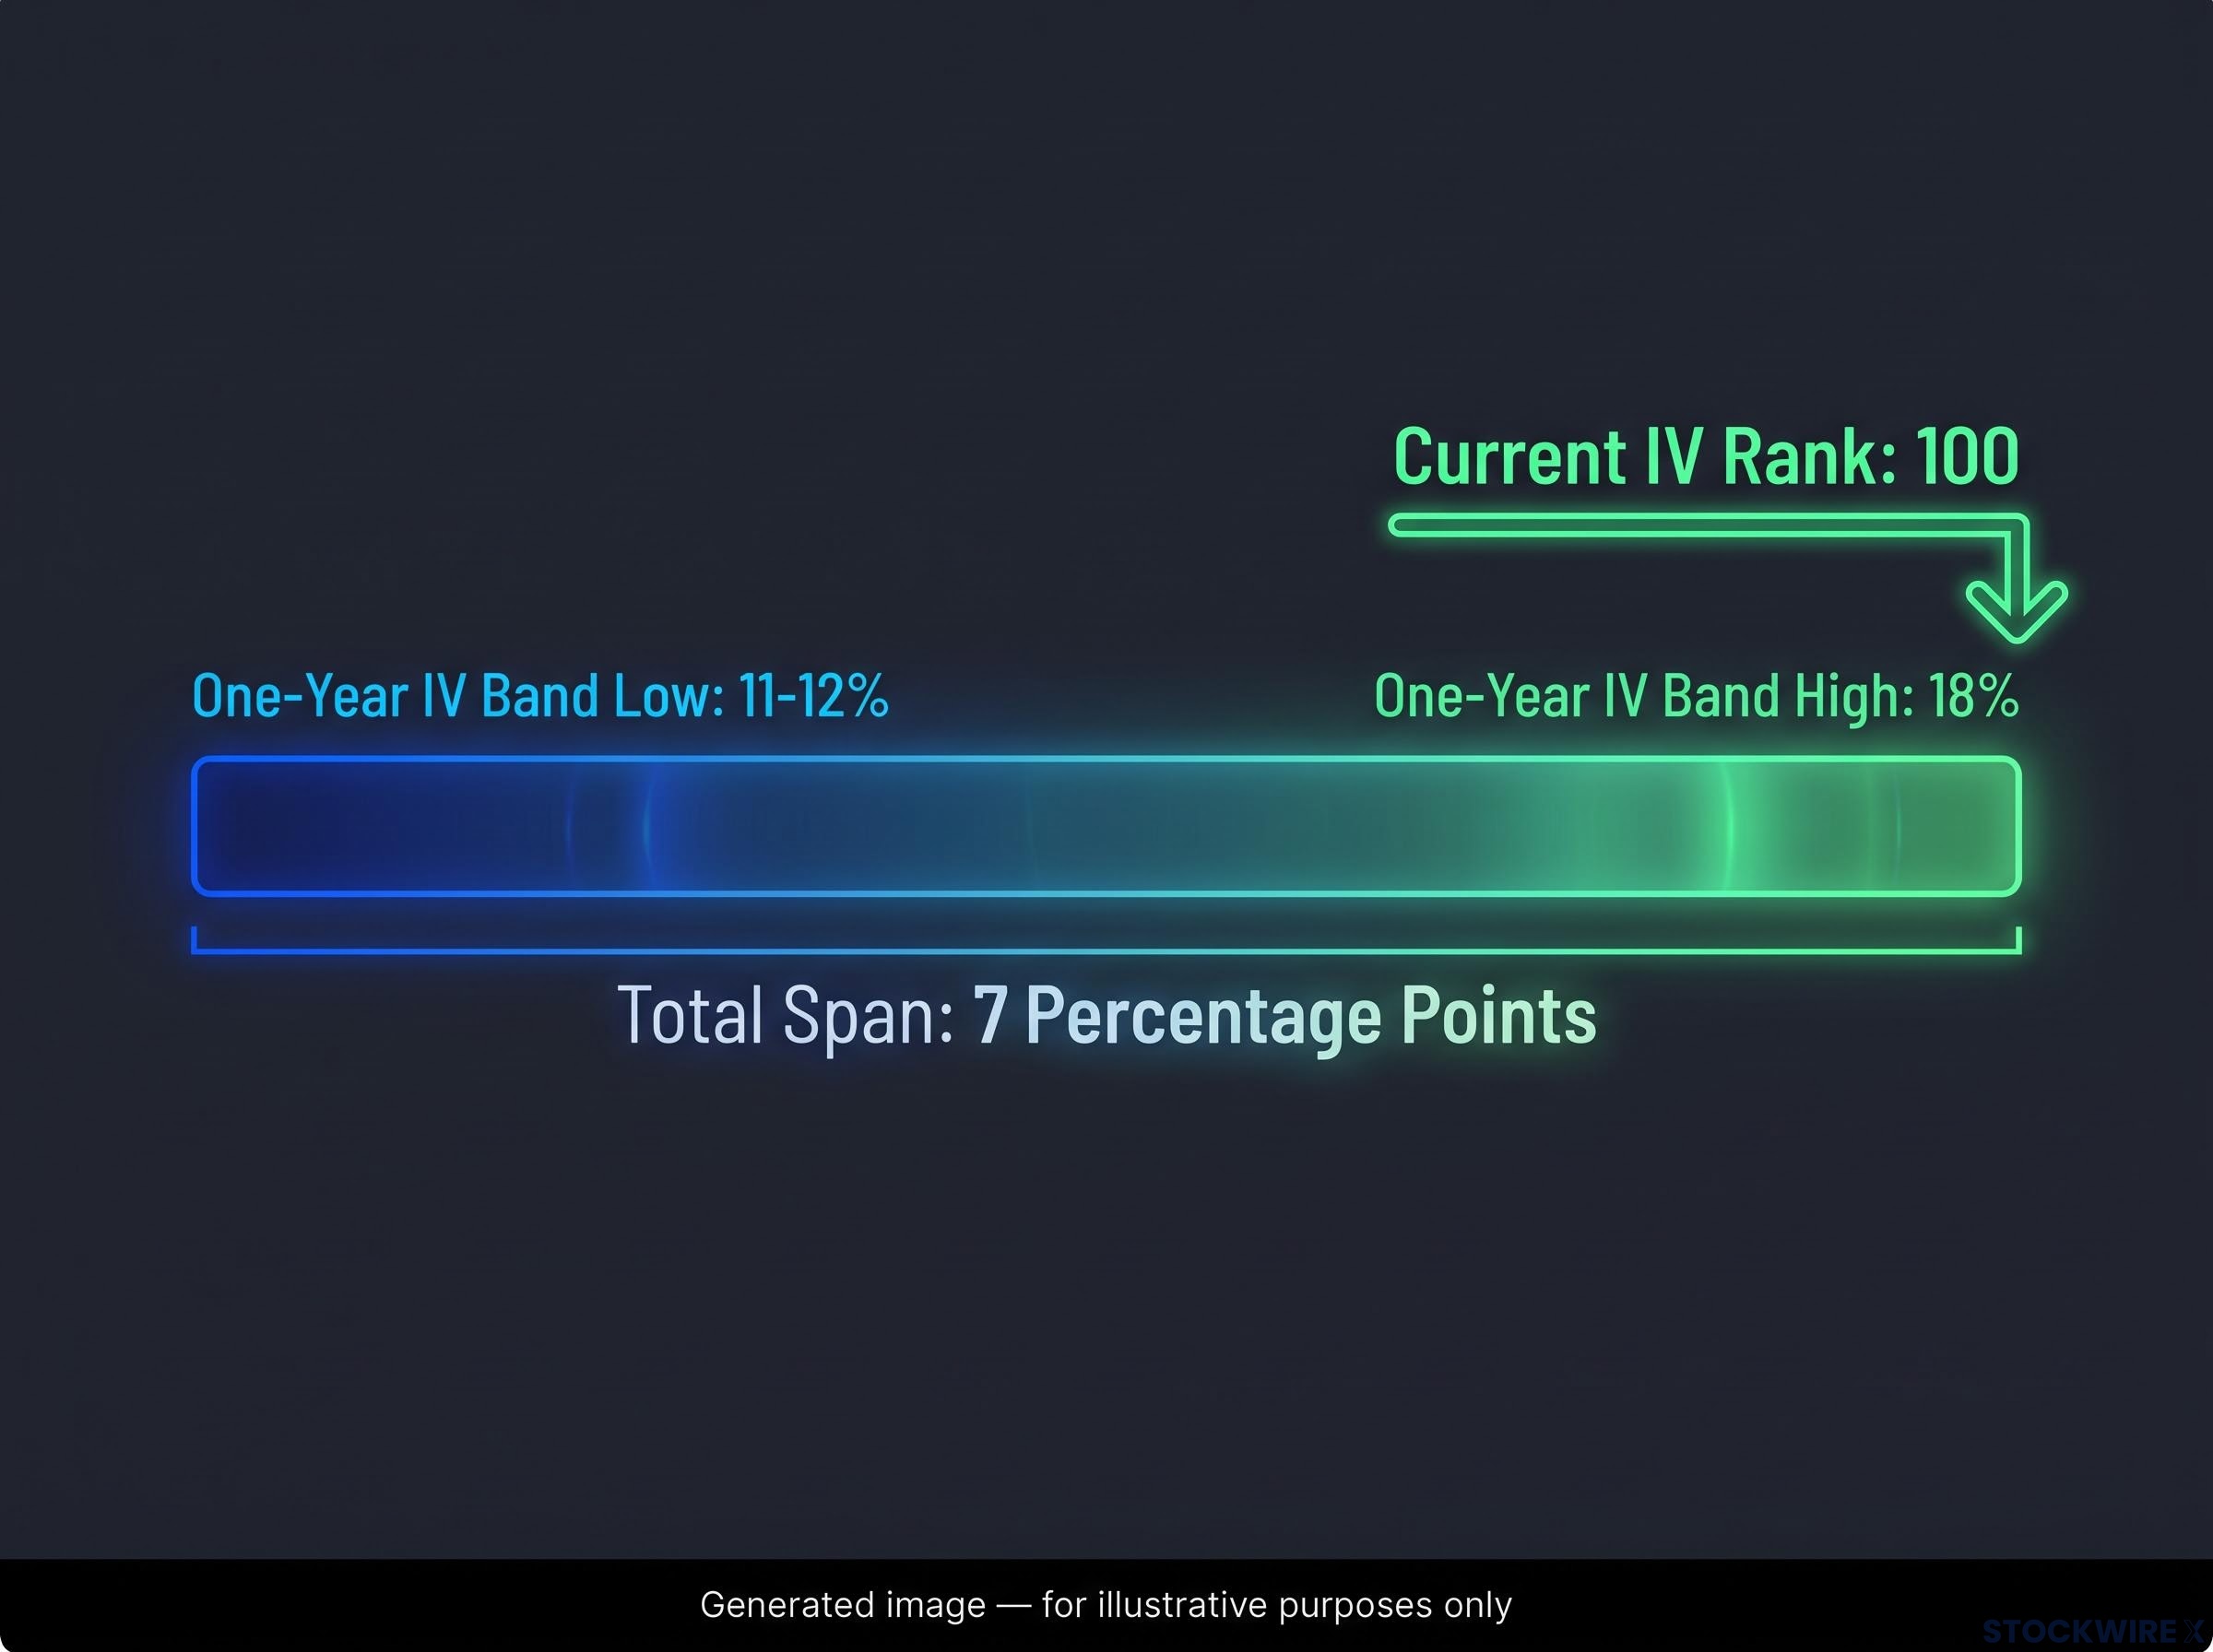
Now make the range concrete. Analysis conducted on the Tasty Trade platform puts TLT’s one-year IV band at roughly 11-12% at the low end and about 18% at the high end. That is a span of only about 7 percentage points.
Sit with that number. A move across the entire one-year range, from rank 0 to rank 100, represents just 7 percentage points of change in absolute volatility. The rank screams, but the underlying shift in expected movement is small.
This is why a “high” IV rank on TLT does not mean what it means on a higher-beta name. IV in the mid-teens implies far smaller expected dollar moves than the same rank reading would on a single stock or equity index, where the one-year range might span many times that width.
A premium seller needs three things from an elevated IV rank, and TLT fails on all of them right now.
- Meaningful dollar premium. Collecting roughly $1 per contract was noted as uncommon even at rank near 100, but it is not enough to compensate for the risk you take on.
- Justified reward relative to margin and risk. With absolute IV modest, the premium is thin against margin requirements and the gap risk of being short options.
- Manageable tail risk. TLT carries substantial macro regime uncertainty: Fed policy shifts, inflation surprises, and fiscal shocks can all drive sharp gaps that modest premium does not cover.
The question that matters for a premium seller is whether the absolute volatility level justifies the tail risk of being short options on an instrument with this much macro uncertainty. On TLT right now, it does not.
The practical consequences for strategy selection
A high IV rank on TLT signals that volatility is elevated within a narrow band. It does not signal a rich premium-selling environment. That distinction is the lesson, and it reframes the question entirely. If the chain is not rewarding premium sellers, what is it rewarding? The answer sits on the call side.
What call-side skew in longer-dated contracts reveals about market sentiment
Look at the March 2027 cycle and something stands out. Out-of-the-money calls carry higher delta and more premium than comparable out-of-the-money puts at the same distance from the money.
| March 2027 contract | Distance OTM | Delta | Prob. of touching | Prob. finish ITM |
|---|---|---|---|---|
| 84-strike call | ~7.5 pts up | ~24 | 40% | Higher premium than put |
| 70-strike put | ~7.5 pts down | ~17 | – | 20% |
Same distance from the money, different pricing. The upside call carries more delta, more premium, and a 40% probability of being touched during the contract’s life. The downside put sits lower on every measure.
This skew concentrates in longer maturities. In the near-term 31 December cycle, the picture is far more neutral: the 84 call shows roughly a 14% probability of finishing in the money at about 16 delta, while the 70 put shows about 11 delta and a lower in-the-money probability. The asymmetry builds as you extend out in time.
Why does it exist? The drivers run from concrete to analytical.
- Principal repayment floor. TLT holds U.S. Treasuries that repay par at maturity. Barring a default, the ETF cannot drift to zero the way a distressed equity can, which suppresses demand for deep crash puts.
- Duration convexity. As a long-duration instrument, TLT’s price reacts sharply to falling yields. A large drop in long rates can produce outsized capital gains, making OTM calls valuable convex bets.
- Asymmetric macro scenarios. A recession, a growth scare, or a flight to quality could push yields down hard, while the downside is capped because yields cannot rise forever and principal stays protected.
- Skew intensification on further declines. As the ETF falls, more participants chase upside exposure, which can make long-dated calls progressively richer relative to comparable puts.
The analogy is gold at multi-year lows. Markets tend to price a floor under assets that cannot realistically go to zero, and the options chain reflects that belief through call-side premium.
Call-side skew as a structural signal is not unique to bond ETFs: S&P 500 options showed a positive 25-delta skew in mid-September 2026, meaning calls were priced richer than puts across the broad equity market, the same asymmetric pricing dynamic that the TLT chain is exhibiting in longer-dated maturities.
Broader research confirms the pattern embeds deep into longer maturities.
September 2027 skew A $69 call in the September 2027 cycle carries implied volatility around 24.7%, notably above the mid-teens 30-day ATM IV reported across platforms.
The gap between that 84-strike call delta and the equivalent put delta is the market telling you it sees more plausible paths up than down from this price level. That asymmetry is the signal worth acting on, and it is doing two things at once: offering opportunity and reflecting consensus.
Building a position in long-dated OTM calls: the inventory approach and its failure modes
The strategy that follows from the skew is accumulation, not premium selling. You build directional delta to the upside incrementally, buying long-dated OTM calls as inventory ahead of a potential yield reversal. The structural advantage is time: extended expiration gives a rally room to materialise.
Here are the parameters from the original analysis, so you have a concrete anchor. Long OTM calls with roughly 500 days to expiration were being bought for about $1.00 per contract. The target was a move from the $77 level up into the $81-$82 range, where the positions turn profitable.
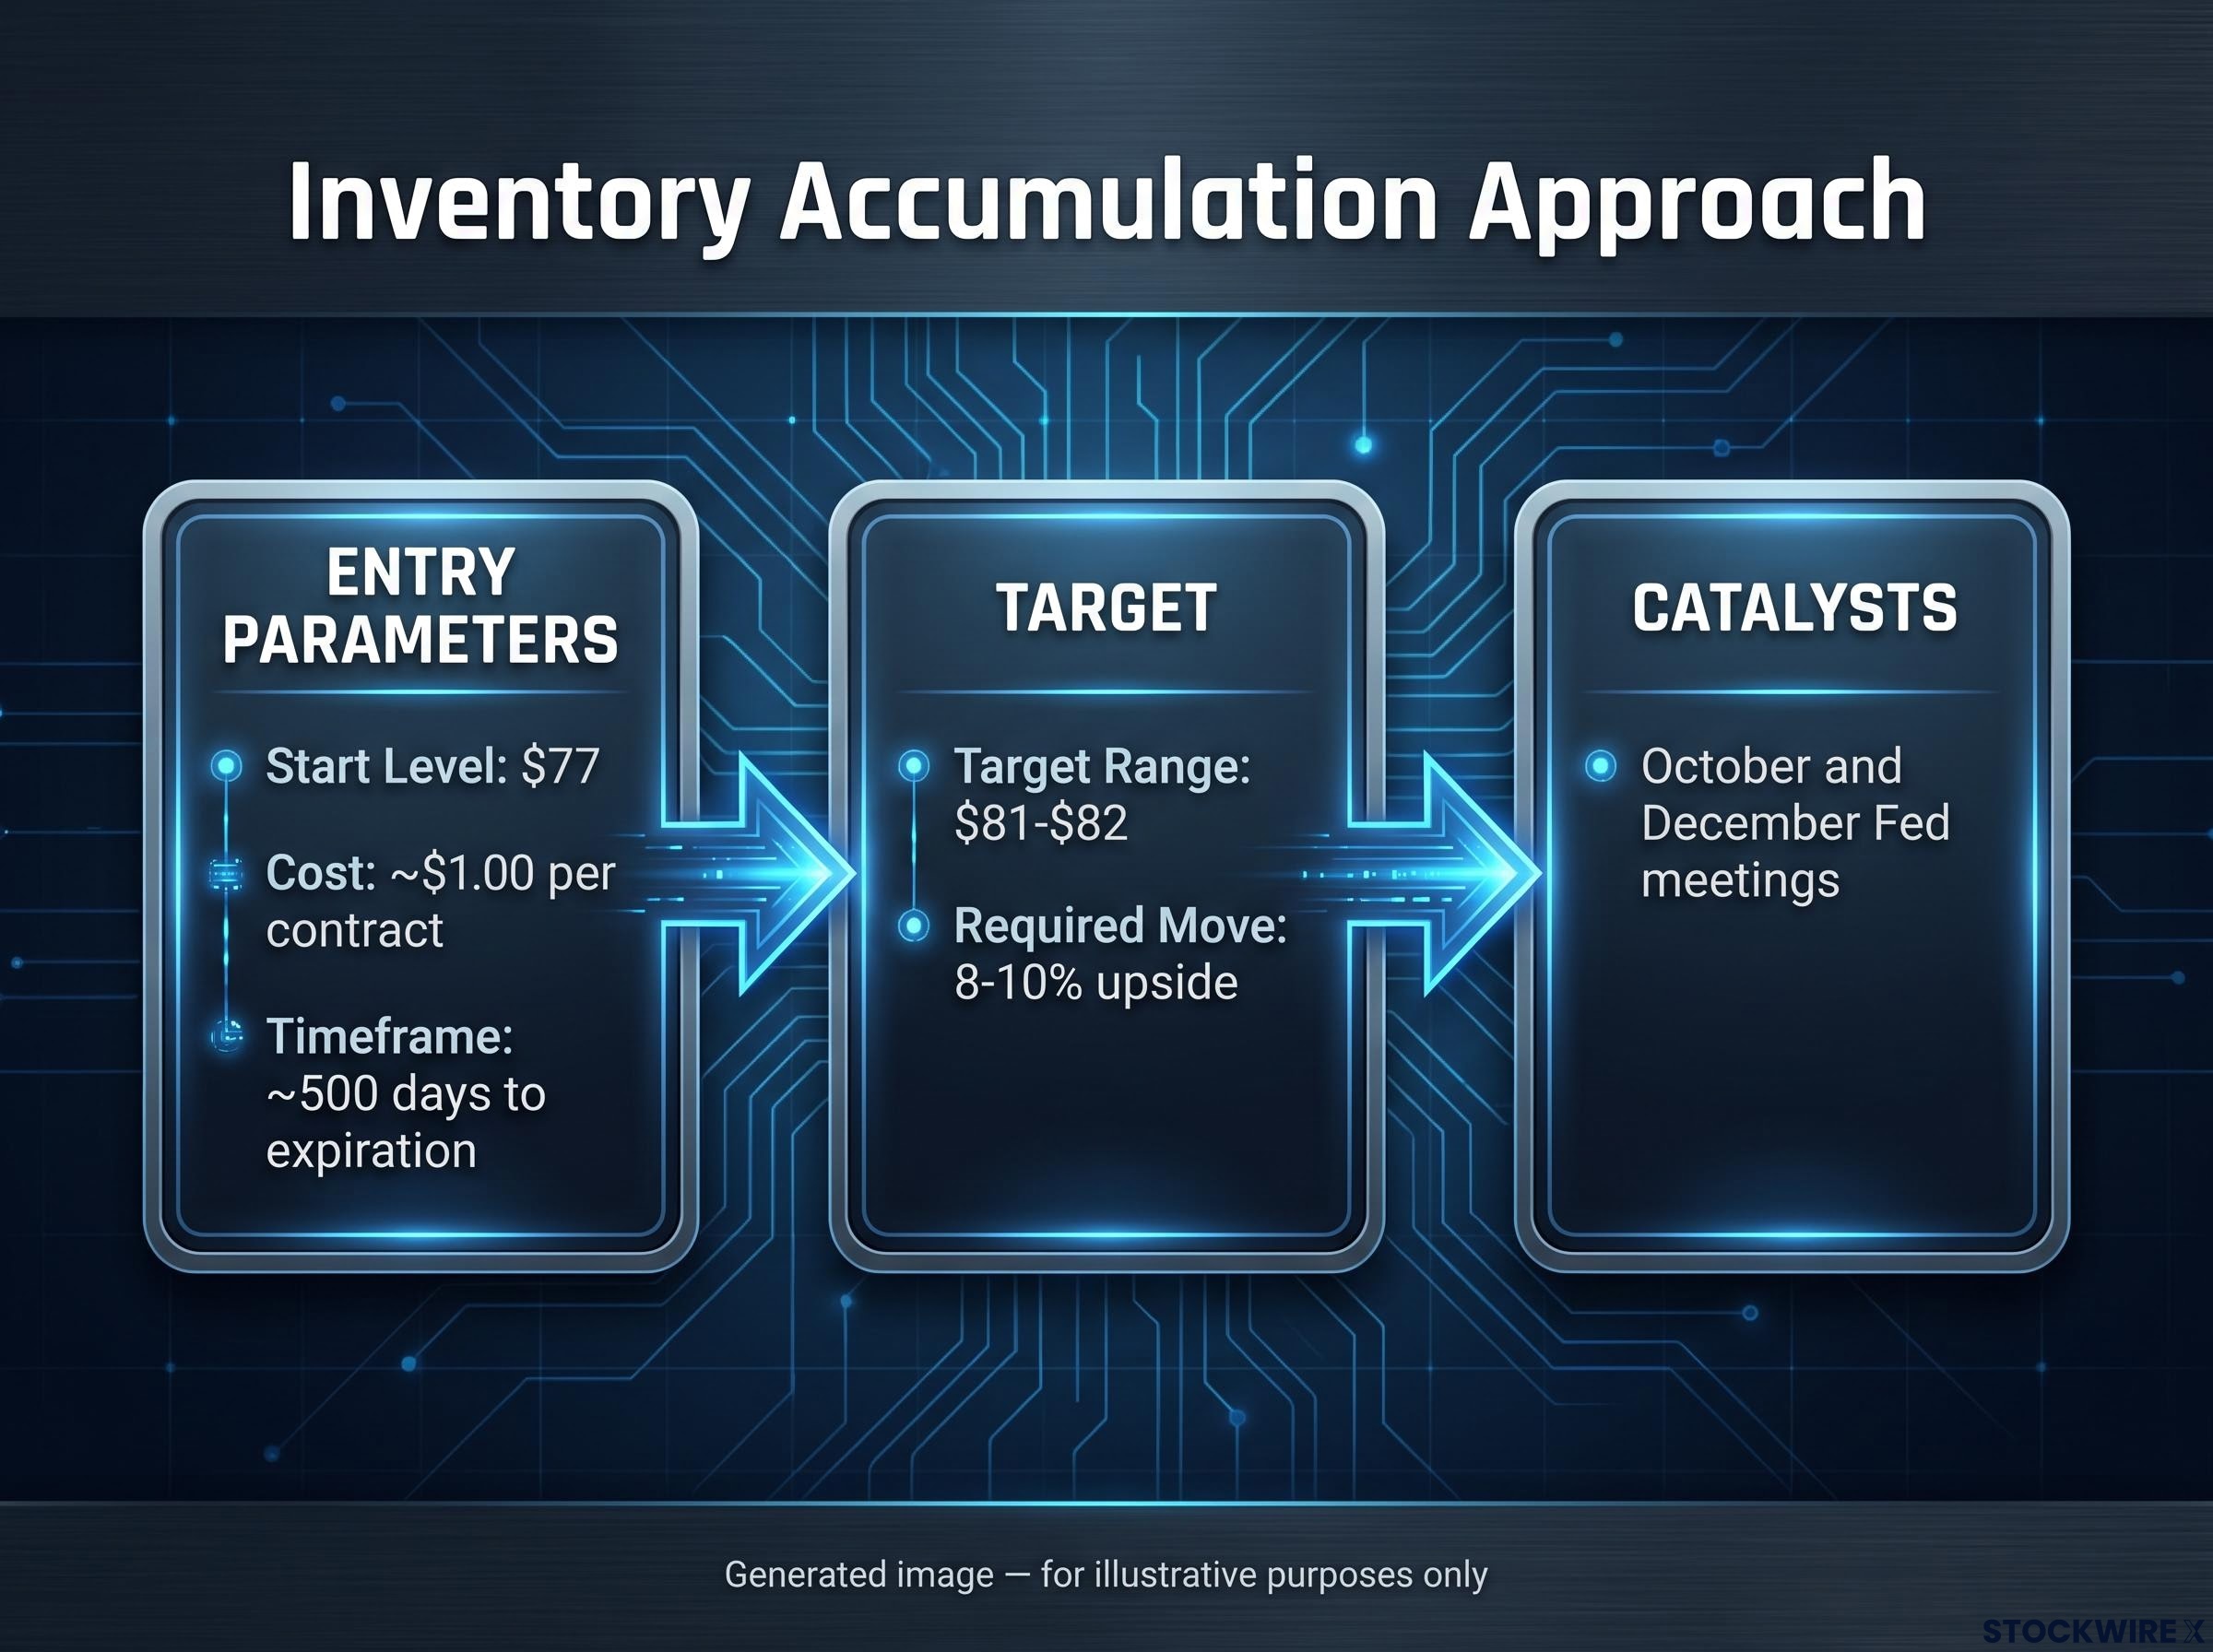
That corresponds to an 8-10% upside move in TLT as the threshold for a meaningful payoff. Near-term catalysts cited include the October and December Fed meetings, which set the timing horizon for the thesis.
The logic is clean: cheap optionality, long runway, asymmetric payoff confirmed by the skew. The failure modes deserve the same analytical weight.
Four failure modes to evaluate before entering
- The structural high-yield regime persists. Yahoo Finance frames a credible break of the 30-year yield below 5% as the trigger for a robust TLT recovery. If yields stay near or above that level for most of the calls’ life, a correct long-term thesis can still expire worthless. Size the position for the possibility that you are early by years, not months.
- Path dependency and timing risk. MarketBeat notes TLT’s acute sensitivity to further rate increases. Continued tightening or a rising term premium can hit the ETF before any recovery, so calls can decay or expire even if yields later retreat. Plan your exit around the path, not just the destination.
- A slow, orderly yield decline. Seeking Alpha suggests yields may ease gradually as inflation improves, possibly over years. A drawn-out, modest recovery may never push deep-OTM strikes into the money within the term. Favour strikes and maturities that survive a slow grind, not just a sharp rally.
- Volatility crush after a regime shift. You would be entering with IV at or above its one-year high. A shift that lowers yields and compresses volatility, from roughly 15.4% implied toward realised levels nearer 11.6%, can make the options underperform the underlying move through vega losses. Expect the directional win to be partly offset by falling volatility.
None of these are exotic edge cases. They are the central risks, and sizing for them is what separates inventory accumulation from speculation.
There is also a structural alternative worth weighing.
Vertical call spreads Financing part of the long call with a short higher-strike call reduces theta and vega exposure, and avoids complete loss of premium at expiration. The trade-off is a capped upside versus the open-ended payoff of an outright long call.
The inventory approach is attractive only when three conditions align: absolute volatility is modest enough that long calls are cheap in dollar terms, the skew confirms market sentiment supports the direction, and you have a clear view on the catalysts that would drive the required move. Check all three before committing capital.
Applying this framework beyond TLT
Step back from the TLT specifics and you have a repeatable diagnostic. The same three questions apply to any low-volatility ETF where rank and absolute IV diverge.
- Check whether absolute IV is genuinely elevated or just high relative to a narrow range. TLT’s 7-percentage-point band is the benchmark illustration: a narrow baseline produces a high rank reading that overstates how expensive options really are.
- Read skew across maturities to locate where sentiment is concentrated. Near-term chains may look neutral while longer-dated contracts reveal a clear directional lean, as TLT’s call skew does.
- Evaluate whether long-dated OTM calls are cheap enough in dollar terms to make accumulation sensible. Cheap optionality plus a confirmed skew plus a catalyst horizon is the combination that supports the trade.
This framework fits a particular class of instruments.
- Structurally low volatility relative to equities
- A perceived downside floor, such as principal repayment in bond ETFs or the utility floor beneath gold
- An IV range that is narrow compared with equity instruments
- A material macro or policy catalyst on the horizon
The gold analogy holds here too. Assets with a perceived floor tend to show call-side skew in longer-dated contracts as a structural feature, not a short-term quirk, for the same reason TLT does.
So the single question to carry into any low-volatility ETF is this: does the IV rank reflect a wide absolute range or a narrow one? The answer determines whether the options market is offering you premium to sell or directing you toward long gamma on the call side.
For readers wanting to apply the same diagnostic framework across other tickers, our full explainer on reading options chain sentiment walks through IV rank, skew, expected-move mapping, and far-OTM crowding using HOOD as the worked example, covering the five-step process professionals use to extract directional signals from any chain.
When the rank is right but the strategy is wrong: what TLT options actually reward
The rank is not lying. IV at the top of its one-year range is a real signal. It simply points toward a different trade than the one most people reach for.
On a structurally low-volatility instrument, rank near 100 combined with absolute IV in the mid-teens tells you where volatility sits within its own range, not whether options are genuinely expensive. That distinction decides which side of the market you belong on. Here, it redirects you away from premium selling and toward the call side.
Long-dated OTM call accumulation is the structurally supported choice only when three conditions hold:
- Absolute IV is modest in dollar terms, as the roughly $1.00 cost for a 500-day call illustrates even at peak rank
- Call skew is confirmed in longer maturities, not just the near-term chain
- The macro catalyst horizon, the October and December Fed meetings in this case, falls within the option’s life
Build the habit. Separate the rank signal from the absolute level signal, check the skew for direction, and let those two diagnostics guide strategy selection rather than defaulting to premium selling whenever rank is high.
This article is for informational purposes only and should not be considered financial advice. Investors should conduct their own research and consult with financial professionals before making investment decisions. Past performance does not guarantee future results. Financial projections are subject to market conditions and various risk factors, and forward-looking statements are speculative and subject to change.