A condition that almost never happens is showing up in U.S. equity options right now: on days when stocks rise, the implied volatility priced into those upside moves is running higher than the implied volatility priced into days when stocks fall. That is the reverse of how options markets are supposed to behave.
Implied volatility skew has a default shape in equity markets, one set by decades of institutional hedging. Upside calls are almost always cheaper than downside puts, because money managers buy protection against declines as a matter of routine. When that relationship flattens or flips, something has shifted in the balance of fear and greed at the institutional level.
The timing sharpens the point. Quarter-end is arriving, and AI and tech names are absorbing unusually large call-side flows.
This piece walks through what asymmetric upside volatility actually means, why it is appearing now, what institutional positioning data confirms, and where the risks sit before anyone treats this as a clean bullish setup. Read it and you will be able to interpret the live data yourself rather than lean on a single verdict.
Why equity options almost always price downside more expensively than upside
Start with what normal looks like. In a standard equity market, out-of-the-money puts trade at higher implied volatilities than out-of-the-money calls. Put simply, the market charges more for protection against a fall than for a bet on a rise.
Why? Because institutions are permanent buyers of downside insurance. Pension funds, asset managers, and insurers hold vast equity portfolios, and they buy puts continuously to cap their losses in a crash.
That persistent demand creates a supply-demand imbalance. Steady buying pressure on puts keeps their implied volatility permanently richer than the equivalent calls. The industry name for this condition is negative skew, and it is the resting state of the equity options market.
The standard way to measure it is the 25-delta skew. The number compares the implied volatility of a moderately out-of-the-money put against a moderately out-of-the-money call. A negative reading means puts are the more expensive side. A positive reading means calls are.
For decades, that number has sat in negative territory as a rule. Which is exactly why the current data is worth a second look.
Implied volatility regimes shape which strategies make sense at any given moment: elevated IV favours premium-selling structures while compressed IV, exactly the condition present in tech names after the August-September pullback, tilts the advantage toward buyers of upside calls.
- Normal skew: puts more expensive, negative 25-delta reading, driven by structural hedging demand
- Current condition: calls more expensive, positive 25-delta reading, driven by upside speculation
When the skew flips: what a positive 25-delta reading actually means
A September 18, 2026 snapshot of S&P 500 (SPX) options showed at-the-money implied volatility of roughly 11.9%, an IV rank of just 10.5%, and a 25-delta skew of +0.041. That positive figure is the tell: calls were priced richer than puts. The Nasdaq-100 (NDX) showed the same lean, with a 25-delta skew of +0.035 back in August 2026.
A positive reading tells you the options market is pricing upside surprises as more probable than downside ones. That is the market’s own way of leaning bullish, regardless of what commentators are saying out loud.
According to a Goldman Sachs note from late September 2026, the average one-month skew across Nasdaq-100 stocks had fallen all the way to zero, meaning puts and calls were priced equally. Even a flat reading is historically unusual. A positive one is rarer still.
When big ASX news breaks, our subscribers know first
What the VXN-VIX spread and current volatility data are showing right now
The skew is one piece of evidence. The volatility indices are another, and they point the same way once you separate them.
Most people watch the VIX, the Cboe index that measures expected 30-day volatility on the S&P 500. Fewer watch the VXN, its Nasdaq-100 equivalent. The gap between the two is where the current story lives.
On September 17, 2026, the VIX sat at 17.71 while the VXN reached 22.44, a spread of 4.73 points and a ratio of 1.27. The day before, on September 16, the VIX was 15.44 against a VXN of 19.96, a spread of 4.52 points. Back at its August 6, 2026 peak, the spread had stretched as wide as 8.8 points.
| Date | VIX | VXN | VXN-VIX Spread |
|---|---|---|---|
| 16 September 2026 | 15.44 | 19.96 | 4.52 points |
| 17 September 2026 | 17.71 | 22.44 | 4.73 points |
| 6 August 2026 (peak) | – | – | 8.8 points |
A persistently elevated VXN relative to the VIX matters because it tells you where the options market is pricing more uncertainty and more potential movement. It is not the broad market. It is Nasdaq names specifically, the tech and AI cohort that has drawn concentrated positioning.
Here is the part worth holding onto: the absolute VIX level is still modest. The Cboe VIX spot reading was 15.09 on September 21, 2026, which is a calm number by any historical measure.
So the condition is tech-specific volatility running hot against a placid broad market. That tells you institutional concern is concentrated in tech names rather than smeared across everything, which means the options activity in those names carries more weight as a directional signal than it otherwise would.
Tail-risk pricing corroborates the tension. The Cboe SKEW index held well above neutral through mid-September.
Cboe SKEW hit 154.49 on September 14, 2026. Readings above 130 indicate the market is pricing elevated tail risk. The index also registered 149.25 on September 10, 147.02 on September 11, and 145.95 on September 17.
One-month S&P 500 put skew jumped from the 36th to the 73rd percentile in September, a rapid repricing of downside protection. So downside fear and upside speculation are rising at the same time, in different corners of the market.
How the spot-up, vol-up feedback loop works in practice
Now to the mechanism. When you see tech stocks lurch higher on a day with no obvious news, options positioning is often the reason, and the chain that produces it is worth understanding step by step.
It starts on the screen with institutions buying calls in size. The dealers who sell those calls are now short upside exposure, and they cannot leave it unhedged.
To stay neutral, the dealer buys the underlying stock. That is the first push of buying pressure, and it comes not from conviction but from the mechanical need to hedge.
Here is the loop, in sequence:
- An institution buys a large block of call options on a tech name.
- The dealer on the other side sells those calls and is now short gamma, meaning their exposure grows more negative as the stock rises.
- To hedge, the dealer buys the underlying stock.
- That buying helps push the stock price higher.
- The higher price forces the dealer to buy even more stock to stay delta-neutral, which pushes the price higher again.
That self-reinforcing sequence is the spot-up, vol-up dynamic. Rising prices generate more hedging, which generates more rising prices.
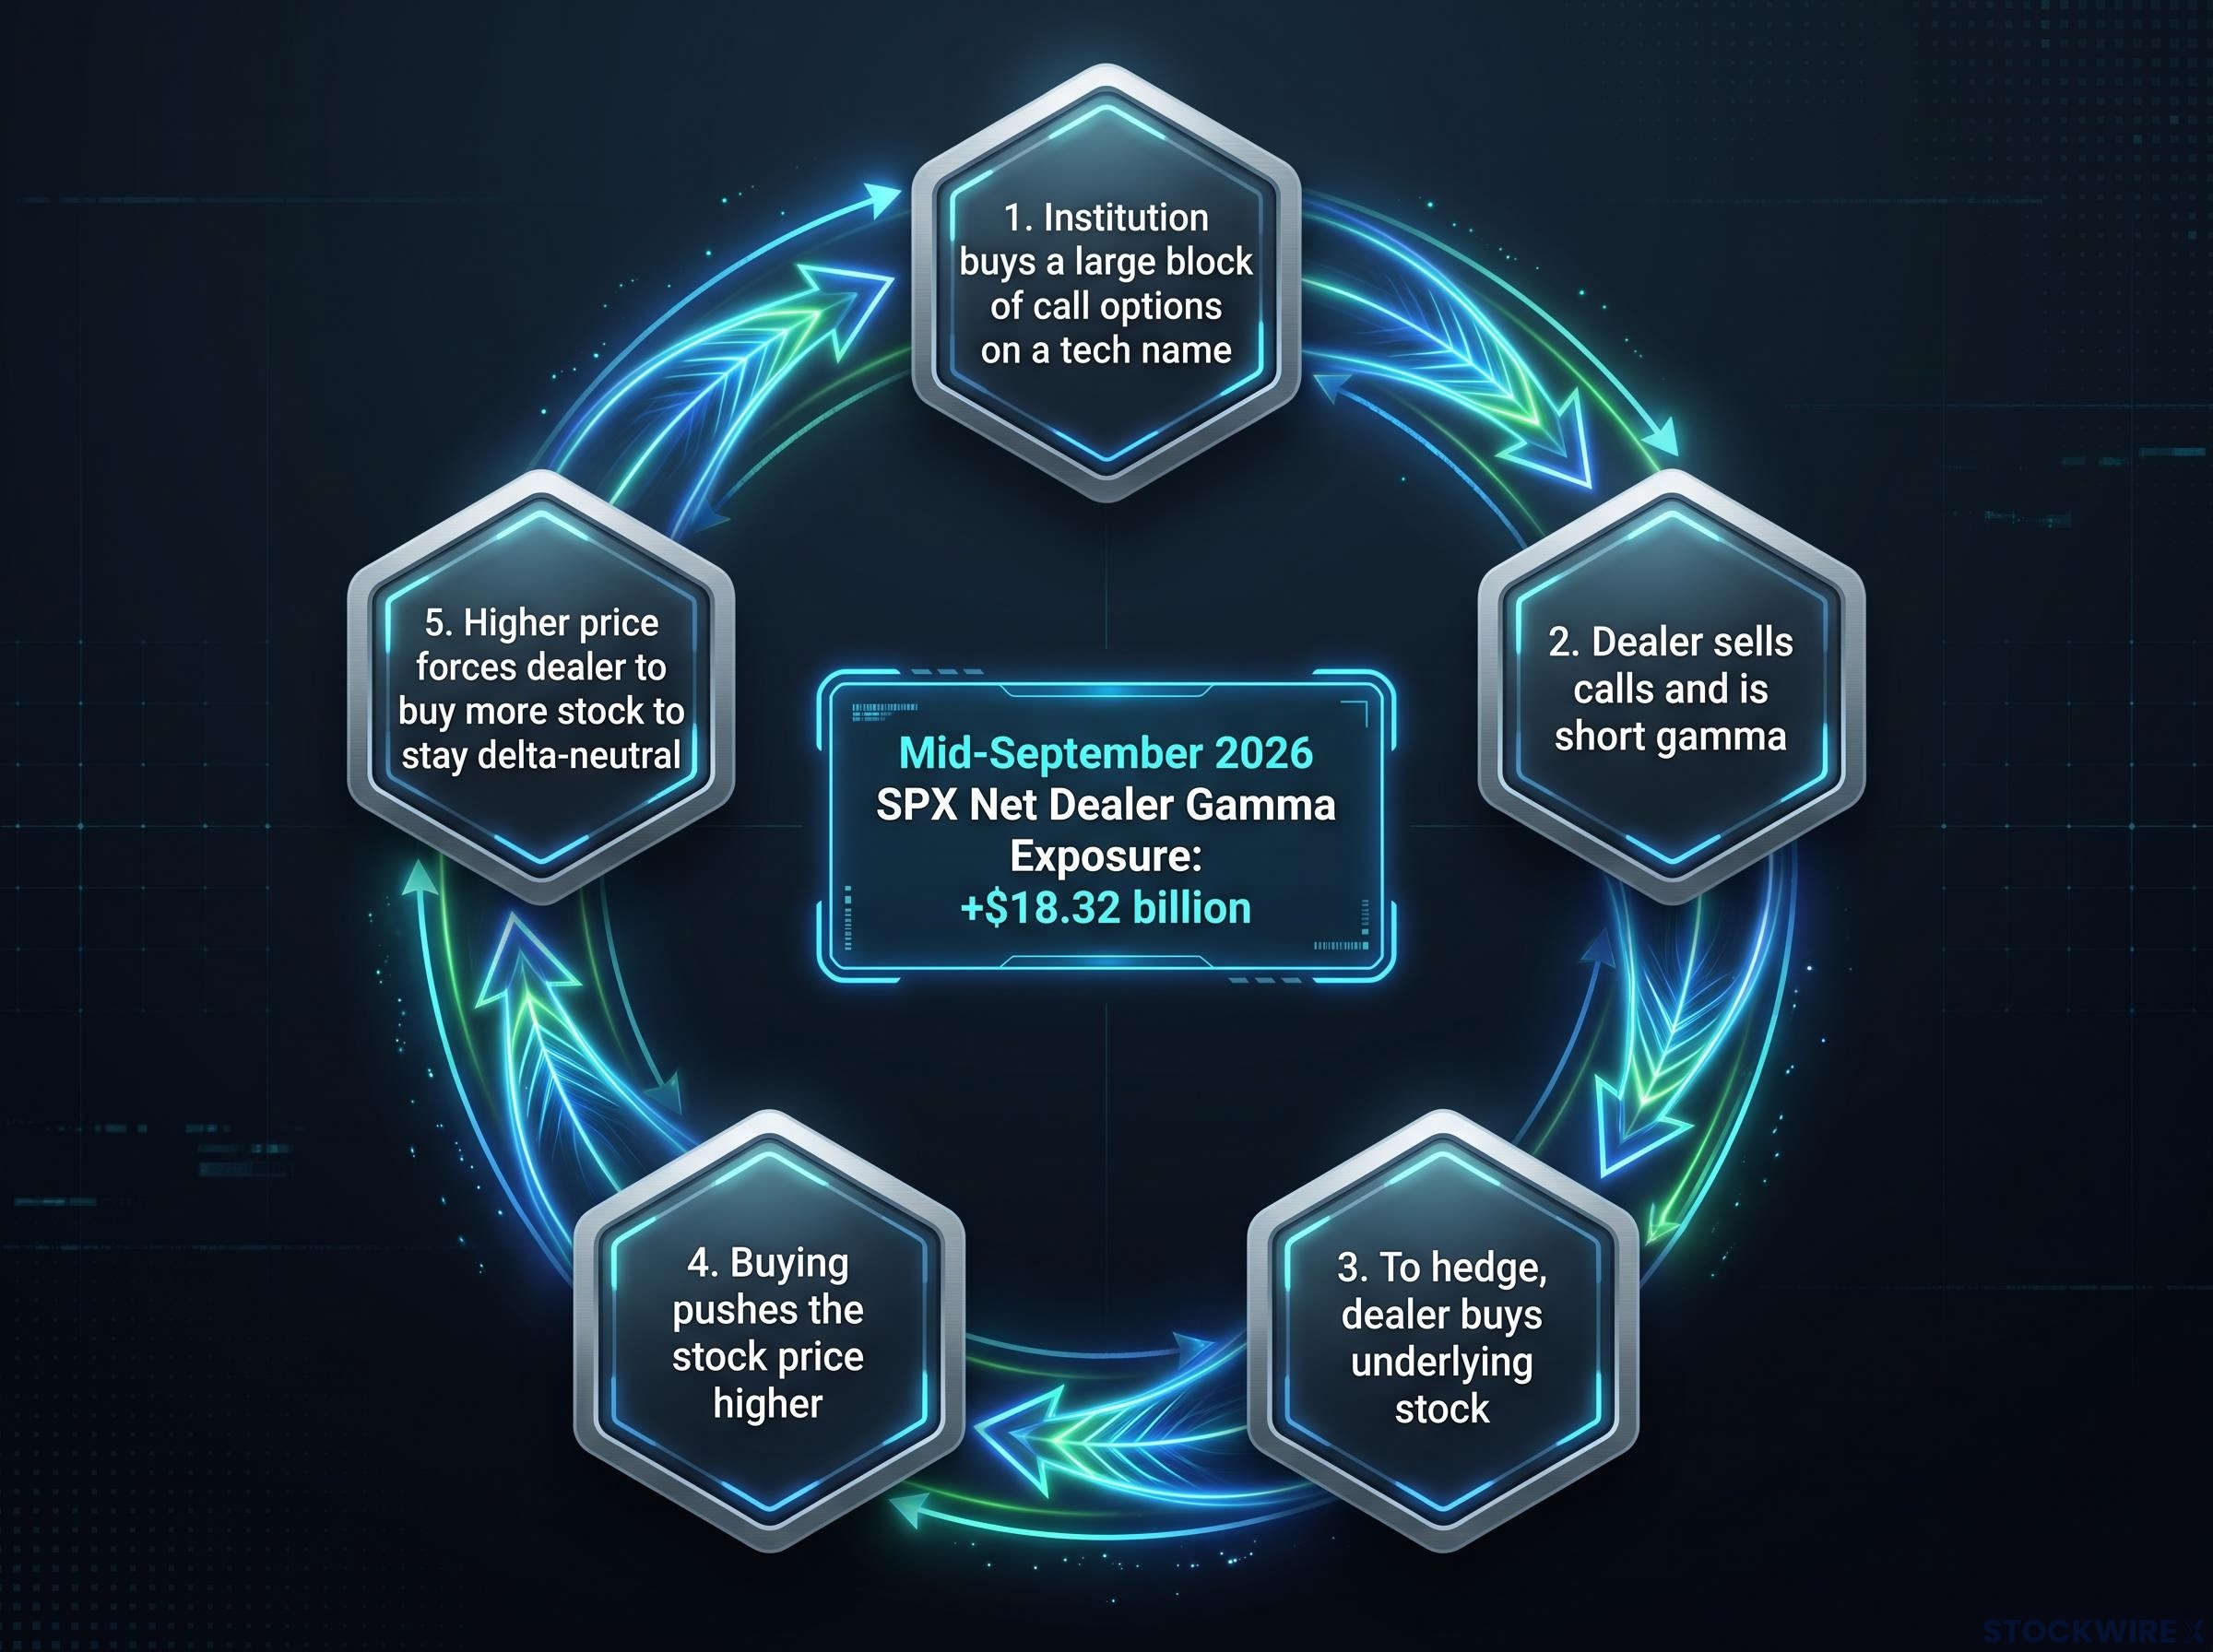
The current data shows the fuel is loaded. Net dealer gamma exposure on the SPX was observed at roughly +$18.32 billion in mid-September 2026, a heavily positive figure that amplifies exactly this effect.
Dealer gamma exposure of roughly +$18.32 billion on the SPX sits at the stabilising end of the spectrum, a condition in which dealers are mechanically buyers of dips rather than sellers into weakness, which is the opposite of the destabilising regime that accelerates declines.
For you, the practical implication is direct. Large institutional call purchases in tech are not passive bets sitting on a shelf; they are active forces that reshape the stock underneath them. Once you understand the hedging mechanic, a sharp single-day rally with no headline behind it stops looking mysterious.
Why compressed implied volatility after a pullback creates a better entry for calls
There is a second condition that made this setup attractive: cheap premium. Buying calls when implied volatility is low and skew is flat or positive means paying less for the same exposure than buying into elevated volatility.
The August and September pullback compressed tech implied volatility, and that compression is the setup. Intel (INTC) implied volatility recently fell to lows of roughly 57-58% with earnings still a month out, a low base from which upside call structures look cheap.
The SPX told the same story with its IV rank of 10.5% on September 18. Weekly SPX options expiring September 21 even quantified the asymmetry inside a single contract: average implied volatility of 9.74% for calls against 12.63% for puts. When calls are the cheaper side, the cost of expressing an upside view drops, and that alone invites more of it.
What quarter-end positioning dynamics are adding to the bullish tilt
The options signal does not stand alone. The calendar is quietly working alongside it, and that changes how you should read the current momentum.
The behaviour at work is called window dressing. Near quarter-end, fund managers tend to buy recent winners and hold onto them rather than sell, so their reported portfolios show off strong positions when disclosure arrives.
Academic research puts numbers on the reluctance to sell.
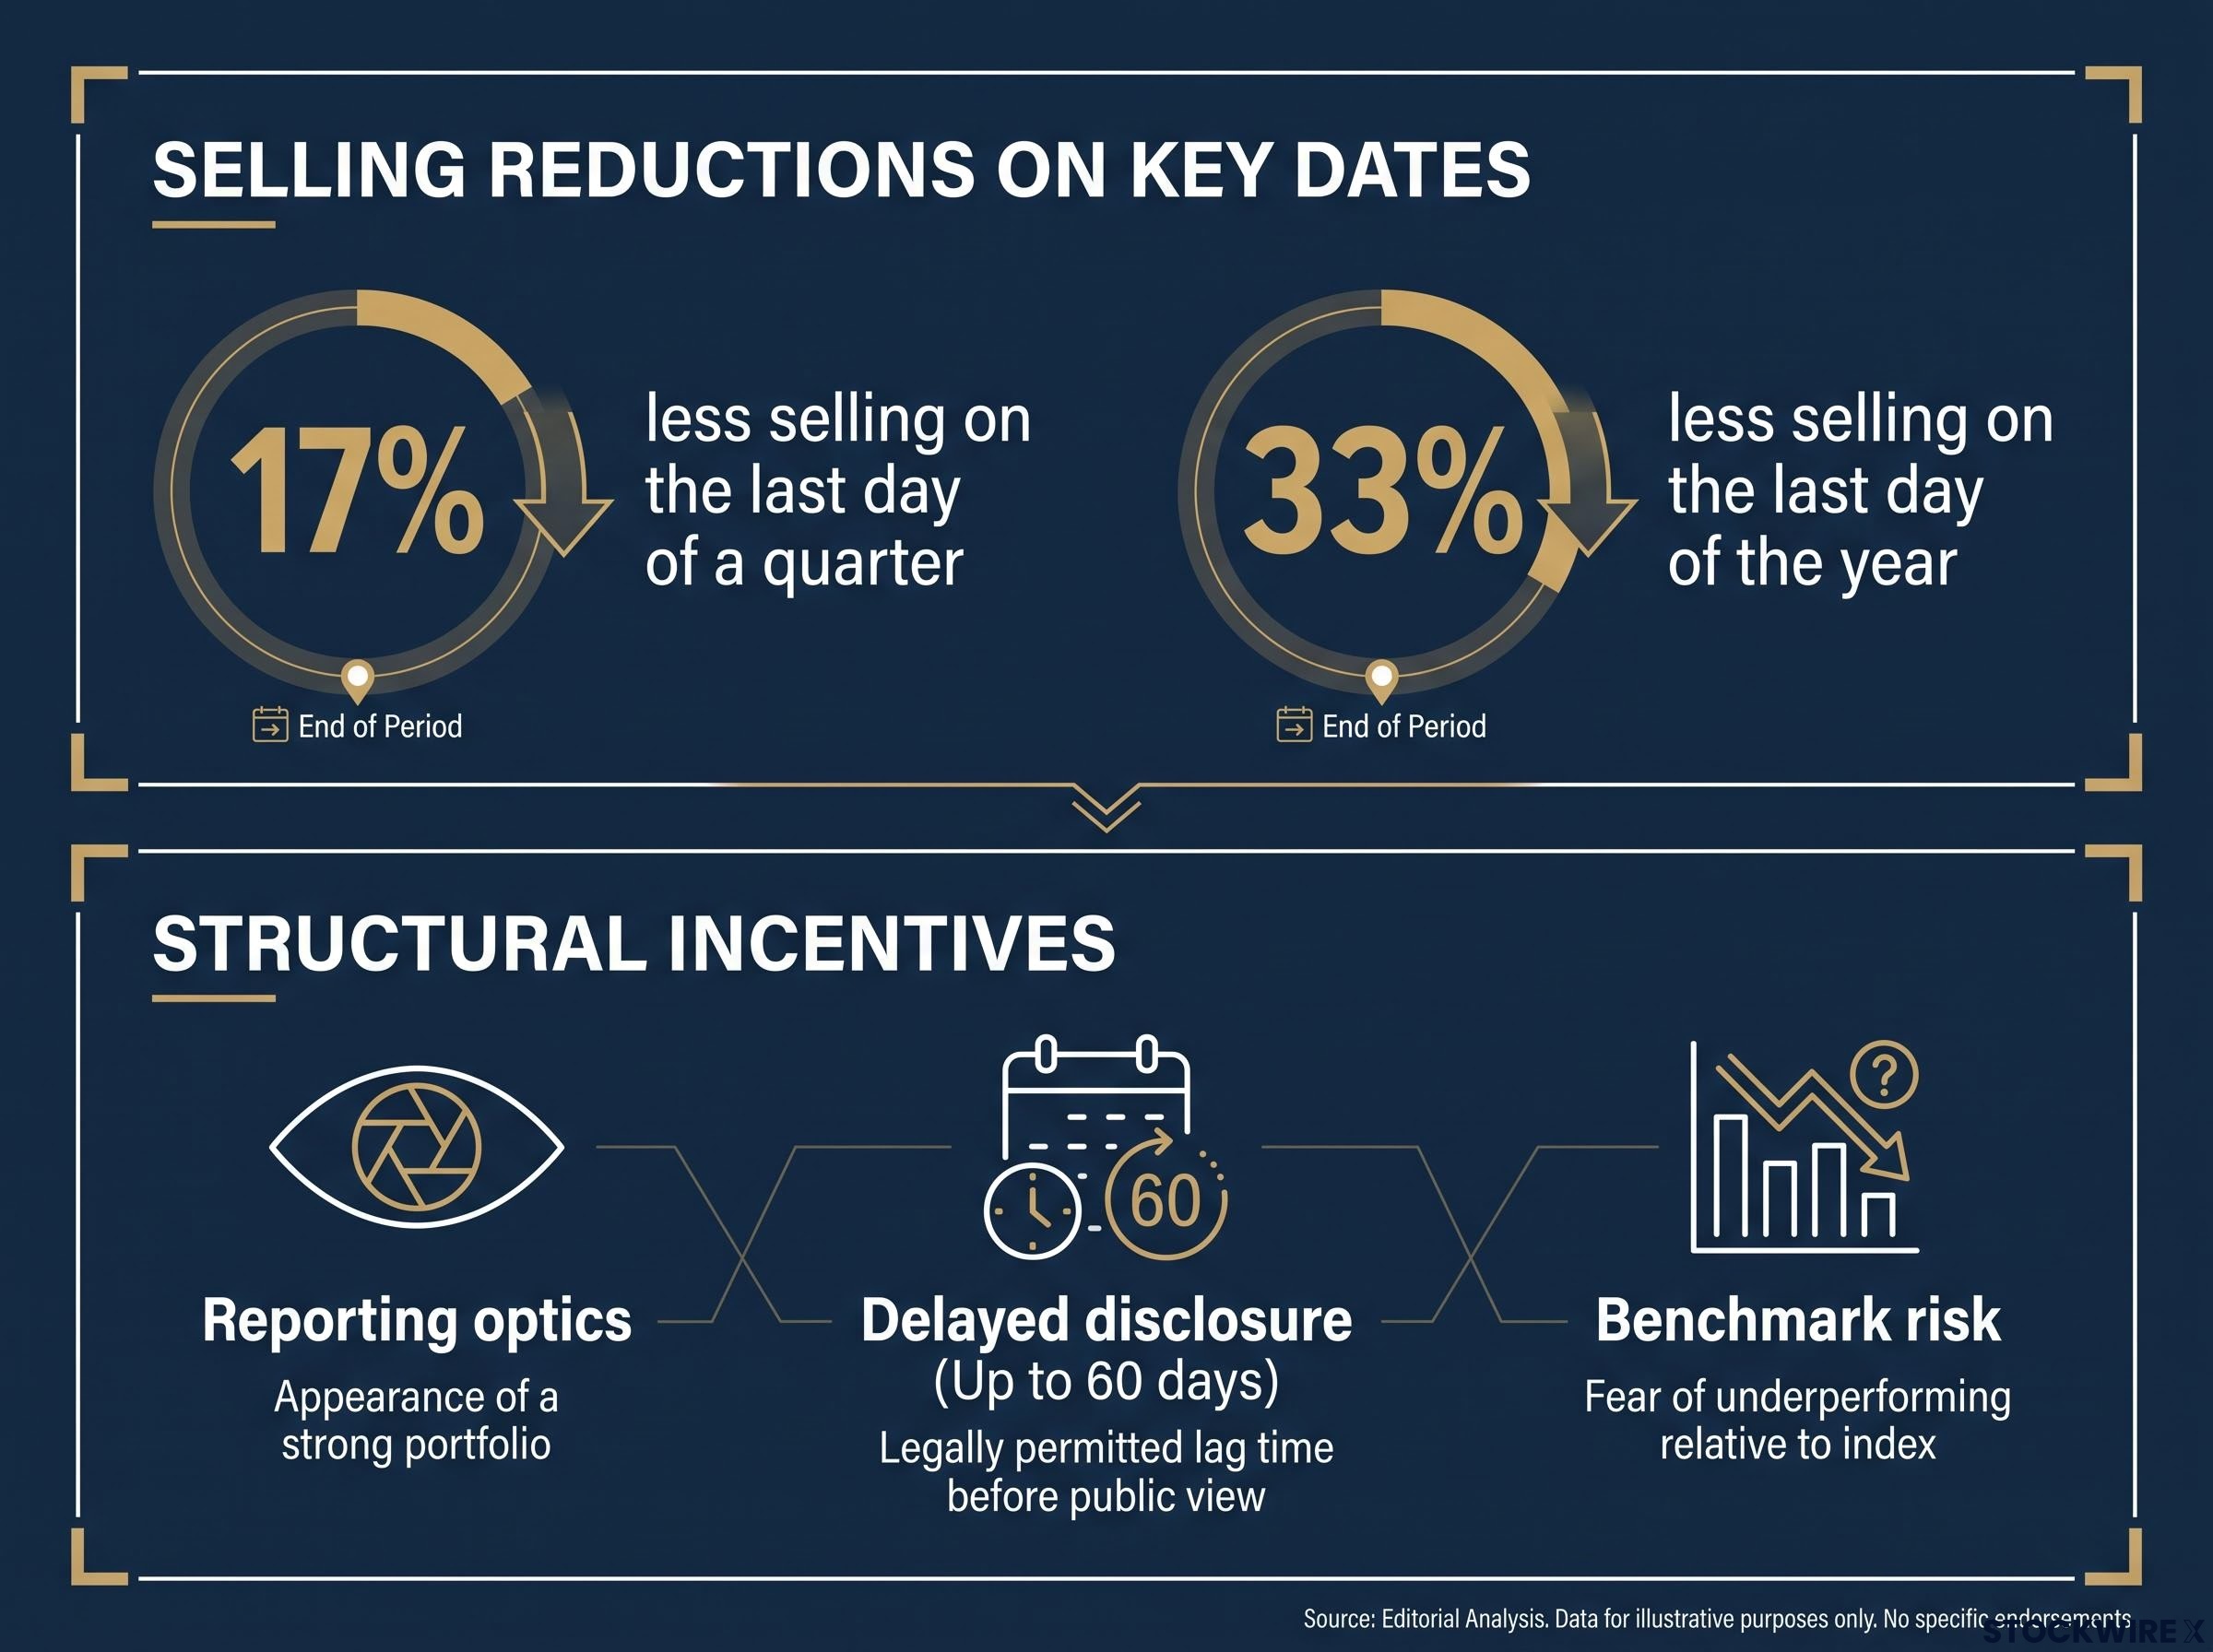
Studies find institutions execute 17% less selling on the last day of a quarter than at other month-ends, and 33% less selling on the last day of the year, according to research on mutual-fund window dressing.
Three structural incentives keep managers holding rather than trimming:
- Reporting optics: portfolios that display the quarter’s winners look stronger to clients and prospects.
- Delayed disclosure: funds can delay portfolio reporting for up to 60 days, extending the window in which holding winners pays off cosmetically.
- Benchmark risk: cutting exposure to a name that keeps rising means falling behind the benchmark, which damages quarterly numbers directly.
Connect that to the current AI and tech call flow. If leading tech names are the quarter’s standout performers, managers have every incentive to hold or add rather than reduce in the final weeks, which layers real demand on top of the options-driven demand.
The momentum has been visible in the underlying equities. AMD posted a single-day gain of roughly 9%, and E-mini S&P 500 futures climbed 65.5 points to reach 5,778 on a post-expiration Monday.
For you, this means the bullish signal has a time-limited amplifier behind it. The window-dressing pressure is specific to this moment in the calendar, and knowing when it fades, early in the new quarter, matters as much as knowing why it exists now.
One nuance keeps the picture honest. According to Nomura, funds buying AI and tech calls are simultaneously hedging via VIX upside calls, with three-month VIX call skew near the 91st percentile. The bullish positioning is risk-managed, not naked.
VIX futures structure explains why three-month VIX call skew sitting near the 91st percentile does not simply mean the VIX itself is expected to reach that level: futures price a forward expectation that incorporates contango, roll drag, and non-replicability in ways the spot reading does not capture.
Where the signal breaks down: crowding risk, IV crush, and post-quarter reversals
The uncomfortable truth is that the same mechanics building this bullish signal are also building its fragility. Understanding where it fails is what makes it usable rather than dangerous.
The signal breaks down in three distinct ways:
- Crowding and unwind risk: when everyone is positioned the same way, a reversal becomes self-amplifying in the opposite direction. The spot-up, vol-up loop runs in reverse, forcing aligned participants to exit at once and turning a bullish flow into a violent drawdown.
- IV crush risk: an options buyer can be right on direction and still lose money. If implied volatility collapses faster than the option gains intrinsic value, the premium bleeds away, a specific hazard when volatility is already compressed.
- Post-quarter mean reversion: window-dressing effects are well documented to reverse early in the following quarter. Once the reporting incentive expires, the artificial demand can drain out just as quickly as it arrived.
There is also the question of how rare the current setup truly is, and the historical record cuts both ways.
The distinction between VIX calls vs SPX puts matters here because the two instruments respond differently to the same selloff: SPX puts gain from both price decline and volatility expansion, while VIX calls require the futures curve to move, not just spot VIX, a nuance that shapes how institutions choose between them when managing tail risk alongside a bullish position.
The four historical precedents and what they do and do not tell you
According to the Goldman Sachs note, the average one-month Nasdaq-100 skew falling to zero has happened only four times in 20 years, with every prior instance preceding a strong tech rally. On its face, that is a striking record.
The research flags the specific parallel breakout dates as January 8, 2018, December 19, 2018, and June 3, 2019, but these are noted as unverified and should be treated as illustrative rather than confirmed. A separate measure, the NDX 110/90 skew exceeding 70%, has also shown a positive relationship with future Nasdaq-100 returns.
The caveat is the sample size. Four data points across two decades is far too thin to treat as a reliable timing rule, however clean the pattern looks. That is precisely why sophisticated funds are hedging with VIX calls even as they buy tech upside; they are not treating this as a one-way bet, and neither should you.
This article is for informational purposes only and should not be considered financial advice. Investors should conduct their own research and consult with financial professionals before making investment decisions. Past performance does not guarantee future results, and these statements are speculative and subject to change based on market developments.
Reading this signal with the quarter-end clock in mind
Three forces are converging. Flattened or positive skew is pricing upside as more likely than downside, institutional call flows are concentrated in AI and tech, and quarter-end window dressing is discouraging managers from selling their winners. Together they explain the current tilt without needing a single fundamental catalyst.
The setup is not one-directional, though. On September 15, QQQ options flows traded $339 million in premium skewed 71% to puts, a reminder that plenty of institutional activity is still hedging against the Nasdaq, not chasing it higher.
The rarest and most statistically notable element remains the zero-skew condition, tempered always by that four-instance sample size. From the current baseline VIX of 15.09, any macro shock would register quickly.
The practical takeaway is a watchlist, not a trade. Three variables tell you when the signal has run its course:
- VXN/VIX spread direction: compression back toward parity signals the tech-specific tension is easing.
- Put skew percentile movement: a re-steepening toward negative territory means downside protection is being rebuilt.
- Early-quarter institutional selling: the appearance of selling in the new quarter marks the window-dressing amplifier switching off.
Watch those three, and you will know whether the setup is still live or already closed.