The Federal Reserve’s preferred inflation gauge came in cooler than anyone expected, and the central bank is still signalling another rate hike. Core PCE registered 3.0% year over year against a 3.3% forecast, yet the hawkish messaging has not softened at all.
That tension is what makes the current moment genuinely hard to read. The same week delivered a stronger GDP revision (2.2%, up from 1.5%) and above-forecast private payrolls (90,000 versus 70,000 expected), so on the surface it looks like a soft landing quietly assembling itself. The surface, in this case, is deceptive.
The purpose here is to give you a working framework. After reading, you will know which data points the Fed actually weights in its decisions, why the headline inflation miss changed far less than it first appeared to, and what Minneapolis Fed President Neel Kashkari’s hawkish signals imply for the Fed rate path through the end of 2026 and into 2027.
The data picture from Wednesday: strong growth, a softer inflation print, and why analysts were not relieved
Three data releases landed together, and two of them beat expectations. Automatic Data Processing (ADP) reported private sector payroll additions of 90,000 in September, comfortably above the 70,000 the market had penciled in. The labour market, in other words, is not rolling over.
Labour market signals complicate this picture in a way that the headline payroll beat obscures: long-term unemployed reached 1.93 million in August 2026, exceeding job leavers at 914,000, a crossover that historically precedes recession rather than soft landings.
Then came the Bureau of Economic Analysis (BEA) revision to second-quarter growth. Annualised GDP was revised up to 2.2%, from a prior estimate of 1.5%, a meaningful upgrade that reshaped how analysts read the economy’s starting position for the back half of the year.
Here is the part that matters most. The GDP revision carries more weight for the rate outlook than the inflation surprise does, because a stronger economic base reduces the urgency to cut and keeps the case for further hikes alive. A resilient economy can absorb more tightening without the recession risk climbing sharply. That single revision reframes the entire conversation about where rates go next.
| Metric | Actual | Forecast / Prior | Policy implication |
|---|---|---|---|
| ADP private payrolls (September) | 90,000 | Forecast 70,000 | Labour resilience supports tightening |
| Q2 GDP annualised (revised) | 2.2% | Prior 1.5% | Most consequential for rate direction |
| Core PCE (August, YoY) | 3.0% | Forecast 3.3% | Softer, but limited reassurance |
What the core PCE miss actually told economists
A below-forecast inflation print would normally ease rate pressure. This one did not, and the reason sits inside the components.
The miss was driven by softer core goods prices. Underneath the headline, core services and super-core inflation (services excluding housing) actually picked up, which points to price pressures that are stickier than a single number suggests.
Economists at Societe Generale flagged this divergence as the reason the below-consensus print did not materially shift the rate outlook. The headline moved in the right direction. The internals did not.
August PCE inflation came in below forecast at just +0.2% month-over-month, cooling the annual rate to roughly 3.0%, yet the Fed’s September projections still placed core PCE at 3.4% for full-year 2026 and did not forecast a return to the 2% target until 2029, confirming that a single soft print changes nothing about the multi-year disinflation baseline.
When big ASX news breaks, our subscribers know first
Why Kashkari’s neutral rate argument changes the calculus
Kashkari put a number on the table that should stop any reader scanning for a dovish pivot: a neutral rate of approximately 3.25%.
He raised that estimate in a CNBC interview on 30 September 2026, and it registered a hawkish tone score of 7.1 out of 10 on the FXS Speechtracker, the most prominent hawkish signal in the current policy environment. The number deserves a moment of attention before you move past it.
The neutral rate is the level at which policy is neither stimulating nor restricting the economy. When Kashkari lifts his estimate to 3.25%, he shifts the baseline for what counts as restrictive. With the federal funds target range currently at 3.75%-4.00%, that implies policy is only modestly tight.
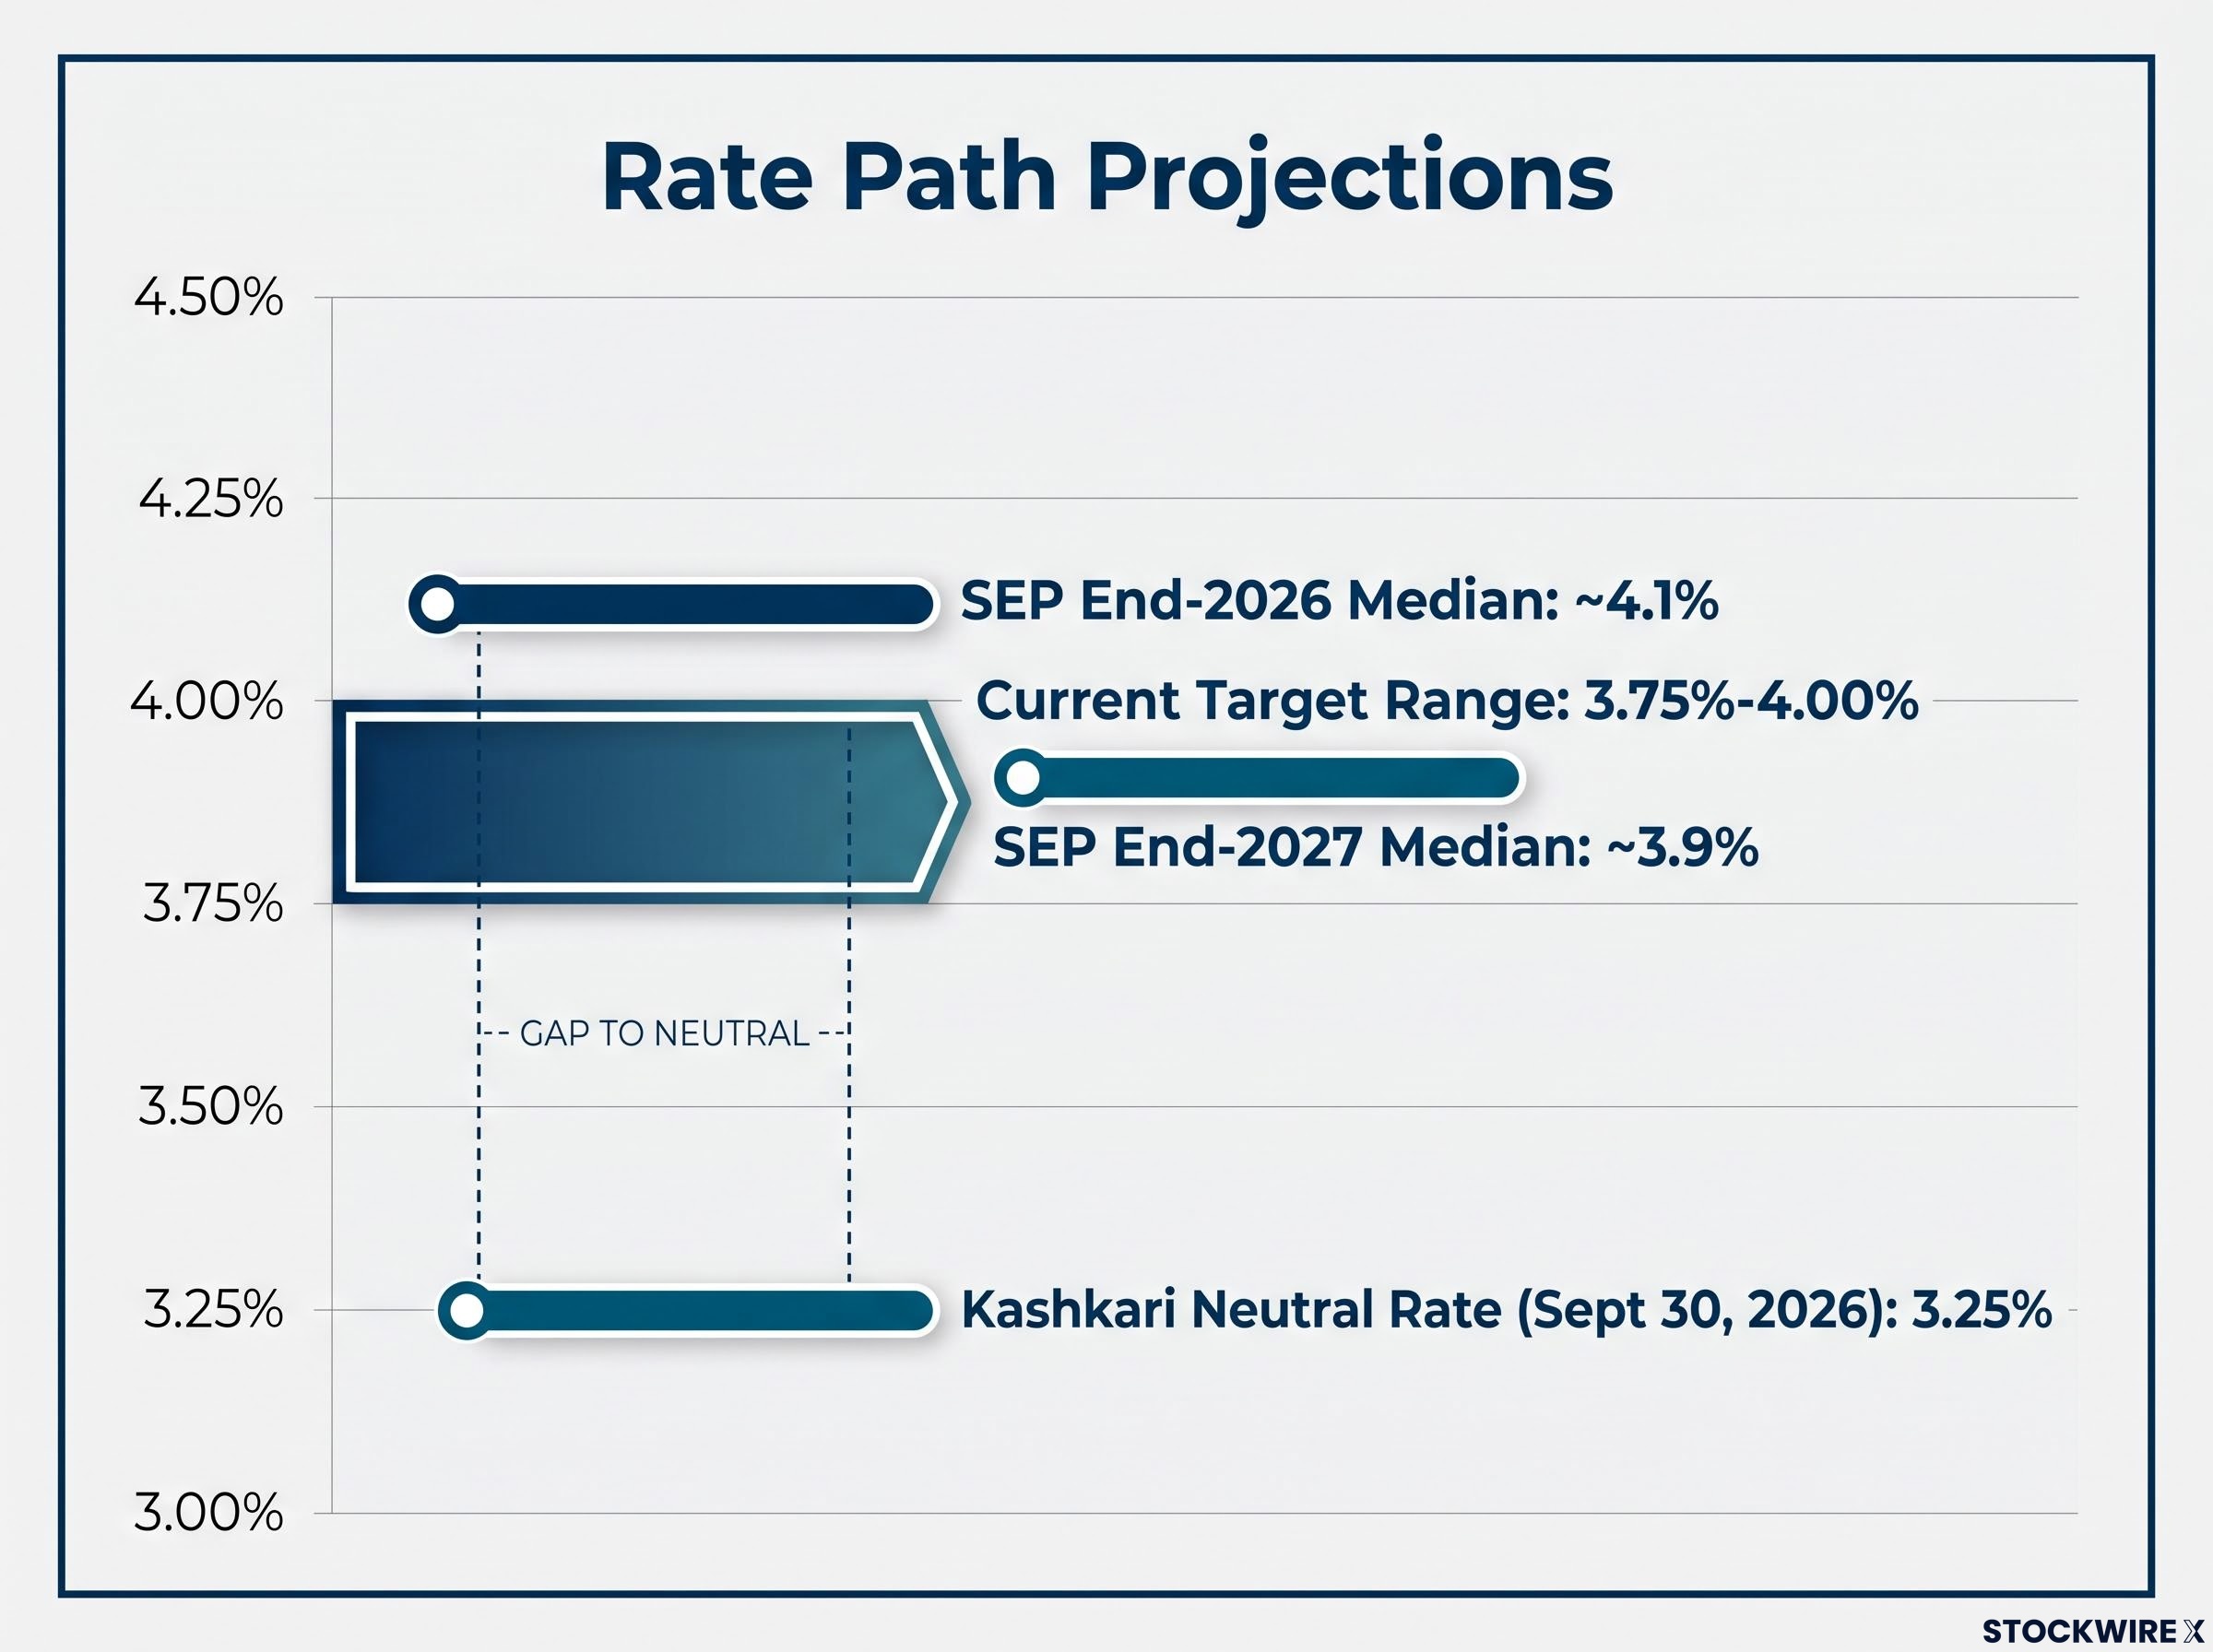
Here is what that means for you. If 3.25% is correct, the current rate is doing far less disinflationary work than the same level would have done in a pre-pandemic world, when the neutral rate was assumed to be lower. Rates would then need to stay elevated for longer simply to achieve the same effect.
“Inflation near 3% remains unacceptably elevated.” Neel Kashkari, President, Federal Reserve Bank of Minneapolis
Kashkari laid out his forward view and the reasoning behind it:
- One additional rate increase in 2026, and another in 2027
- Inflation near 3% is too high to tolerate
- The economy’s resilience through recent shocks justifies caution
- The neutral rate has risen, driven partly by heavy investment demand tied to the artificial intelligence boom
That last point is the structural piece. Kashkari argues the elevated neutral rate may be temporary, propped up by strong demand for investment capital, but temporary in this context could still mean years. Set against the Summary of Economic Projections (SEP), which show a median near 4.1% for end-2026 and roughly 3.9% for 2027, his view is not an outlier. It is the sharpest articulation of where the committee already leans.
How the Fed weighs contradictory signals: the inflation divergence framework
When a data batch sends mixed signals, the instinct is to wait for a headline to tell you what it meant. A better approach is to understand how the Fed’s own decision architecture sorts the noise, so you can read the next release yourself.
Start with why the Fed watches core PCE rather than the more widely quoted Consumer Price Index (CPI). Core PCE strips out volatile food and energy prices and better captures the spending patterns the Fed cares about. Within that measure, super-core inflation (services excluding shelter) has become a key internal signal, because it reflects the part of inflation driven by wages and demand rather than temporary supply effects.
That distinction is the heart of the framework. Goods disinflation is largely a one-time effect, the unwinding of supply chain disruptions, so softer goods prices tell the Fed little about underlying momentum. Services inflation is different. It is driven by wages and demand, which are hard to bring down without slowing the economy, and that makes it the component the Fed treats most seriously.
Core goods disinflation has been the dominant driver of headline CPI softness in recent months, but as the August data showed, that channel can reverse quickly when fuel costs spike through airline fares and transport, making goods-driven improvements a structurally unreliable basis for any Fed pivot.
So when core PCE printed 3.0% against a 2% target, the number alone did not reassure anyone. The goods-driven miss that Societe Generale economists highlighted was, in the Fed’s framework, the least meaningful kind of good news.
Here is how to rank what the Fed is actually watching, in rough order of priority:
- Super-core services inflation, the stickiness test the Fed cannot blame on temporary goods effects
- The core PCE trend, as the broader confirming signal
- Labour market tightness, which feeds directly into wage-driven services inflation
- The GDP trajectory, which sets how much tightening the economy can absorb
For the next release, the question to ask is not whether headline inflation rose or fell. It is whether services and super-core components moved closer to or further from the 2% target. That is the signal the Fed cannot dismiss as noise. The pending September CPI and Producer Price Index (PPI) data will be read through exactly this lens.
Why the GDP revision complicates the case for a pause
A stronger growth baseline does more than look good on a chart. It lowers the Fed’s fear that one more hike tips the economy into recession, which hands policymakers room to hold or raise.
That is why analysts assessed the GDP revision as more consequential than the inflation surprise. The inflation miss was ambiguous. The growth upgrade was not, and it quietly strengthened the hand of anyone on the committee arguing for another move.
What the rate path looks like through 2027 and where the uncertainty sits
The base case is cleaner than the noise suggests. The September SEP points to one more hike by end-2026, lifting the funds rate toward roughly 4.0%-4.25%, followed by modest easing to around 3.9% in 2027. Kashkari’s personal path, one hike this year and one next, lines up with that trajectory.
The near-term pivot sits with two releases. September CPI and PPI, neither yet published, will most directly determine whether the next meeting brings a hike or a pause. Both outcomes remain live.
“The central bank has signalled that another increase could be on the horizon.” Neel Kashkari, President, Federal Reserve Bank of Minneapolis
| Period | SEP median target | Kashkari’s view | Key contingency |
|---|---|---|---|
| Current | 3.75%-4.00% | Modestly restrictive | September CPI and PPI |
| End-2026 | ~4.1% | One further hike | Services inflation trend |
| End-2027 | ~3.9% | One further hike | Neutral rate convergence |
Honesty matters more than false precision here. The base case is one thing, but October is genuinely a coin flip until September inflation data lands. Market-implied probabilities for the next meeting were not yet available at the time of writing, and the Fed had two remaining meetings in 2026 as of mid-September, per Xinhua/People’s Daily coverage. If you position as though the outcome is settled, you are taking on a risk the Fed itself has not resolved.
The Fed credibility gap has already found expression in the yield curve, with long-term Treasury yields rising even as short-term rates held steady after the July meeting, a steepening that signals investors are pricing in doubt about the Fed’s long-run inflation resolve rather than confidence in its stated path.
What the data and the Fed’s signals are telling you to watch next
The tension resolves into a straightforward tug of war. A stronger economy and persistent services inflation pull toward more tightening. The headline PCE miss and the existing rate level of 3.75%-4.00% pull toward a pause. Neither side has won yet.
The September CPI and PPI releases are the events that most directly settle which force dominates the October decision. Watch the services and super-core components inside them, not just the top line.
The longer question is structural. The gap between where rates sit now and Kashkari’s estimated neutral rate of 3.25% tells you how much genuine restrictiveness is actually in the system. If that gap is narrower than the market assumes, the Fed has more work to do, and rates stay higher for longer than many expect. With core PCE at 3.0% against the 2% target, a full 100 basis point gap remains.
Here is what to track from here:
- September CPI and PPI, for the near-term hike-or-pause signal
- The core services and super-core inflation trend, as the stickiness test
- Kashkari’s neutral rate estimate, and whether other FOMC members converge on 3.25%, as the structural duration signal
If that neutral rate view becomes consensus, the read for you is blunt: the era of near-zero rates is structurally over, and your model of Fed behaviour over the next 12-18 months needs to account for it.
This article is for informational purposes only and should not be considered financial advice. Investors should conduct their own research and consult with financial professionals before making investment decisions.
Past performance does not guarantee future results. Financial projections are subject to market conditions and various risk factors. These statements are speculative and subject to change based on market developments and Fed policy decisions.