
On the last day of August 2023, a single number moved global markets in every direction at once. The core Personal Consumption Expenditures (PCE) print, the Federal Reserve’s preferred inflation gauge, came in at 0.1% for the month, below the 0.2% consensus. That soft reading was supposed to be unambiguously good news for risk assets.
Instead, within hours, US equities split by sector, Treasury yields rose on the dovish data point, oil pushed toward a 14-month high, and Australia’s stock market posted its strongest session in eight weeks. One softer-than-expected figure produced all of that simultaneously.
Inflation data is the most watched macro release on the calendar, yet most explanations of its market impact stay at the surface: soft print equals dovish Fed equals stocks up, bonds up, dollar down. The August 2023 episode is worth studying precisely because almost none of those relationships held cleanly.
What follows gives you a working map of how inflation data travels through each asset class, why it produces counterintuitive outcomes, and what that means the next time a major inflation release lands. By the time you finish, you will read the print differently.
What the August 2023 core PCE print actually showed
The headline surprise was small on paper and large in consequence. Here are the three numbers that mattered:
- Core PCE (month-on-month): 0.1% actual, against a 0.2% consensus
- Core PCE (year-on-year): 3.9%, down from 4.3% in July
- Headline PCE: 0.4% month-on-month and 3.5% year-on-year
Core PCE strips out food and energy to show the underlying trend in prices, which is why the Fed watches it more closely than any other single release. A miss of just 0.1 percentage points does not sound dramatic. The reaction across asset classes said otherwise.
The BEA Personal Income and Outlays release confirmed the 0.1% core PCE monthly reading and the 3.9% annual figure, providing the official data that markets were reacting to when yields and equities split so sharply across geographies.
The annual figure carried the real symbolic weight.
The 3.9% annual core PCE reading was the first time the measure had fallen below 4% since June 2021. For a market that had spent two years watching inflation run hot, that threshold mattered.
Here is the complication. Softer inflation did not arrive alongside a weakening economy. On the same stretch, the final reading for US second-quarter 2023 Gross Domestic Product (GDP) was revised up to an annualised 2.2%, confirming that growth remained solid even as price pressures eased.
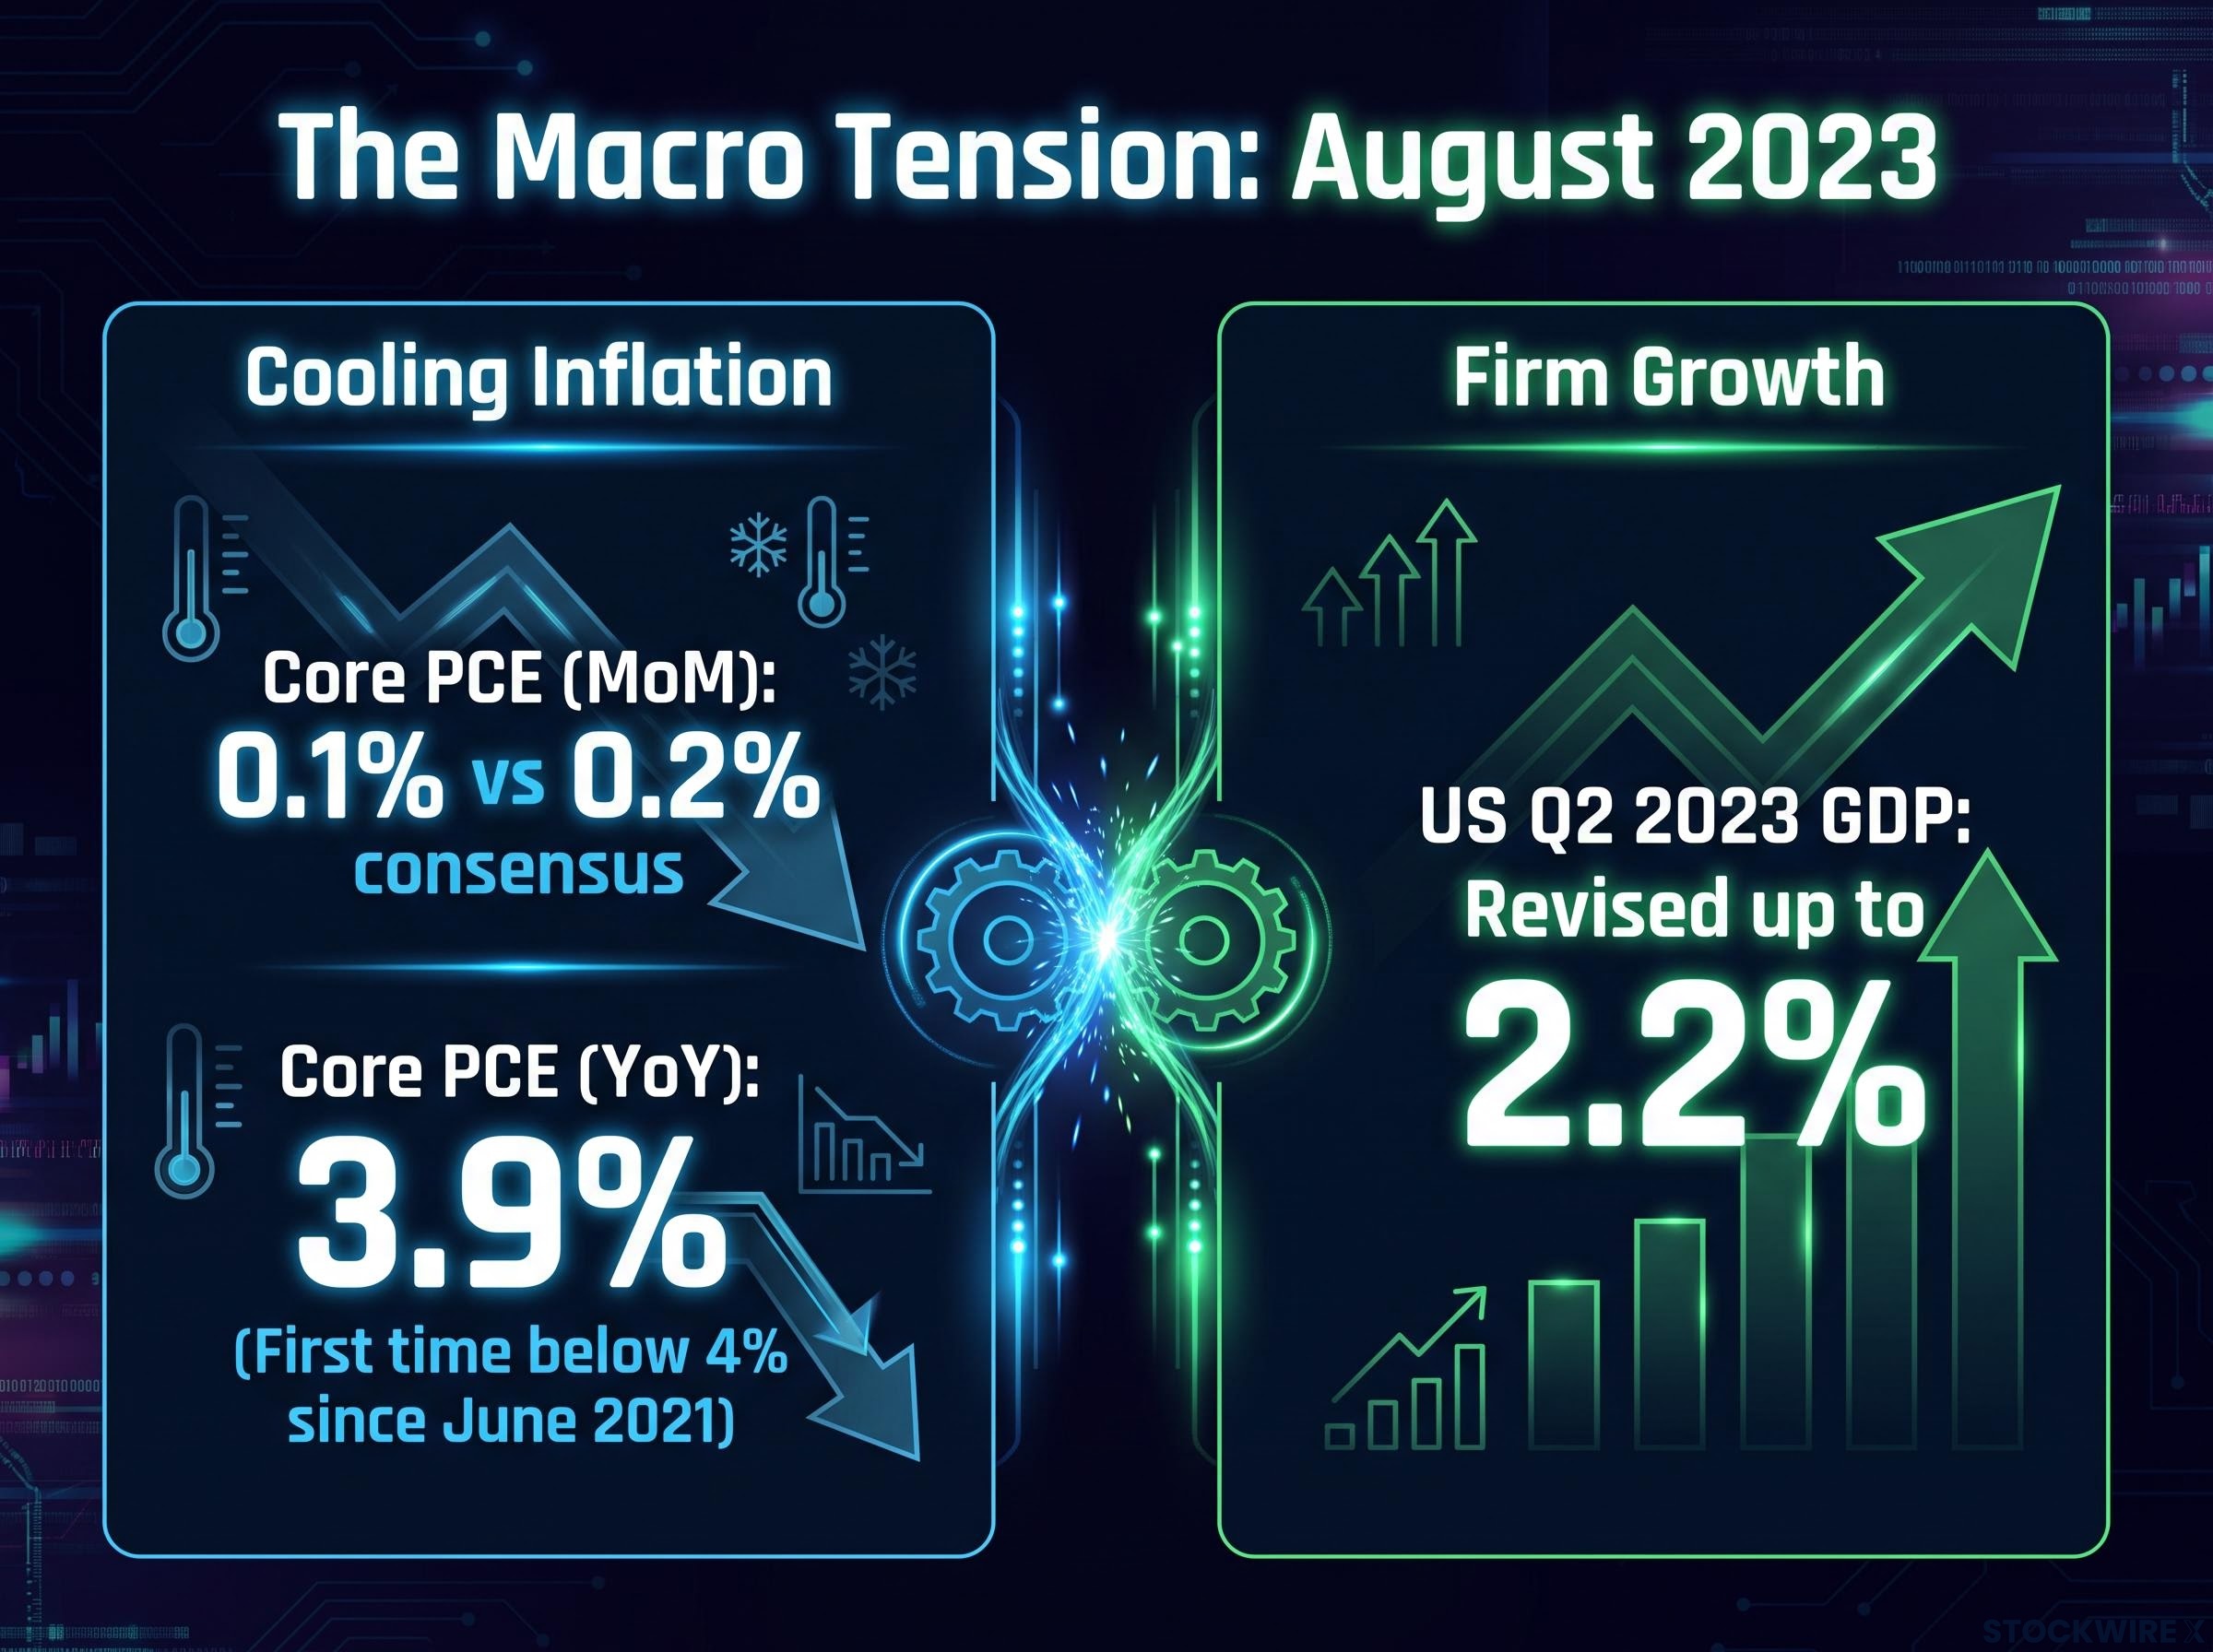
That combination is the whole story. When inflation cools while growth stays firm, the simple logic of “soft inflation equals rate cuts” stops working, because the economy is giving the central bank no reason to rush. Understanding that tension is what lets you interpret the reactions that followed, rather than being surprised by them.
When big ASX news breaks, our subscribers know first
Why bond yields rose when inflation came in soft
Bonds delivered the first counterintuitive result. The 10-year Treasury yield finished the session 3 basis points higher at 5.29%, a level not seen in roughly 24 years, while the 2-year held flat at 4.89%. A dovish inflation print, and yields went up.
| Instrument | Yield after release | Implied November hike odds |
|---|---|---|
| 2-year Treasury | 4.89% (unchanged) | ~41.2% |
| 10-year Treasury | 5.29% (+3 bp, ~24-year high) | ~41.2% |
To make sense of this, start with how sensitive yields have become to inflation news since the Fed began raising rates in 2022. The old assumption was that a soft print reliably rallied bonds. That relationship has changed.
Bond yield mechanics, specifically the inverse relationship between price and yield and how auctions continuously reprice sovereign debt based on growth and inflation signals, are the foundation for understanding why a 3 basis point rise on the 10-year Treasury the day of a dovish print is not a contradiction but a reflection of competing inputs.
A 2024 Kansas City Fed paper found that between April 2022 and May 2024, a 10 basis point core CPI surprise produced roughly a 9.6 basis point move in the 2-year Treasury yield, a far stronger response than in the prior regime.
The point is that yields now react hard to inflation surprises in both directions. But a soft print still lifted the long end, which the sensitivity finding alone does not explain. For that, you need the term premium.
The term premium factor most investors overlook
The term premium is the extra yield investors demand for lending money over a long stretch when the future path of interest rates is uncertain. The more uncertain that path, the more compensation they want, regardless of where inflation sits today.
Several forces inflate the term premium independently of the current inflation number: robust nominal growth, government borrowing needs, anticipated tax or spending changes, and plain volatility in rate expectations. None of those eased just because core PCE slipped.
In August 2023, the strong GDP revision and ongoing fiscal uncertainty pushed the term premium higher even as inflation softened. SimCorp analysis showed the “higher for longer” narrative carrying the 10-year toward roughly 5% by late October that year.
Cleveland Fed research adds the final piece: inflation surprises now move the 2-year yield more than they move near-term fed funds expectations directly. When soft inflation still leaves prices above target alongside firm growth, markets simply price in fewer future cuts, and yields stay elevated.
The lesson for you is direct. A yield rising on a soft print is not a market malfunction. It tells you that once term premia and growth expectations dominate, inflation data becomes one input among several, and treating it as a binary signal can put you on the wrong side of a trade.
How the same data produced opposite outcomes across equity markets
Equities made the divergence impossible to miss. The same inflation print pulled US markets apart internally and produced entirely different results across three geographies.
| Market | Index move | Key driver |
|---|---|---|
| Nasdaq Composite | +0.2% | Growth stocks benefit from softer rate outlook |
| S&P 500 | -0.3% | Gains faded into the close |
| Dow Jones | -0.9% | Value and cyclical weakness |
| FTSE Eurofirst 300 | -0.6% | Rising global yields suppressed risk appetite |
| ASX 200 | +0.9% | Domestic inflation relief plus reduced Fed tail risk |
In the US, growth beat value cleanly. The Nasdaq rose while the Dow fell nearly a full percentage point, with Amazon, Apple, and Alphabet each advancing more than 1%.
Europe went the other way. Rising global bond yields dimmed the appeal of riskier assets, dragging the FTSE Eurofirst 300 down 0.6% and the FTSE 100 down 0.3%, with insurers the weakest sector at -1.4% and banks off 0.8%.
Australia was the standout. The ASX 200 climbed 0.9%, trading in the 7,000 to 7,100 range, led by three sectors:
- Property (the day’s top performer)
- Financials
- Mining
The Australian rally ran on domestic fuel. Softer local inflation data reduced expectations of a Reserve Bank of Australia rate hike, and the soft US print cut the tail risk of aggressive external Fed tightening on top of that.
Here is the detail worth holding onto. The Australian dollar fell to 69.49 US cents even as the ASX rose. Equity strength and currency weakness sat side by side because the domestic policy relief story and the global capital-flow story were pointing in different directions. If you hold cross-border positions, that distinction is where real money is made or lost.
Why growth stocks diverge from value on inflation data
Growth stocks carry most of their value in earnings expected years out. When rate expectations fall, the discount rate applied to those distant earnings drops, and their present value rises more sharply than for value stocks whose cash flows land soon.
That is why the Nasdaq outperformed the Dow by 1.1 percentage points on identical data. It was not a different read on the economy. It was pure duration asymmetry, the same mechanism that governs long-dated bonds, playing out in equities.
S&P 500 and Nasdaq divergence events, where broad index strength masks sharp sector-level splits, have become a recurring feature of the post-2022 rate environment, with the equal-weighted S&P 500 outperforming the Nasdaq 100 by 7.6 percentage points in July 2026, the widest gap since 2003, echoing the same duration-driven sector rotation the August 2023 PCE release produced.
What happens to commodities and currencies when inflation data lands
Commodities ignored the inflation print almost entirely, and oil made the point loudest.
Brent crude posted a roughly 14% gain for the month, its largest since July, settling around $95 per barrel and up 0.9% on the session. None of that came from the PCE data.
The oil move ran on supply and geopolitics: stalled US-Iran negotiations and expectations that OPEC members would hold production targets at their upcoming meeting. Inflation data was a spectator.
| Commodity | Move | Primary driver |
|---|---|---|
| Brent crude | +0.9% (session), ~+14% (month) | Stalled US-Iran talks, OPEC supply discipline |
| Copper | +0.2% (third monthly gain) | Chinese factory activity, supply tightness |
| Aluminium | -1.1% (two-month low) | Supply-disruption fears eased |
| Iron ore | -0.1% ($96.59/ton) | Broadly flat |
| Gold | +0.2% (~$1,849/oz) | Energy prices offset lower rate pressure |
Base metals split on their own logic. Copper edged up 0.2% for a third straight monthly gain on improved Chinese factory activity and supply tightness, while aluminium dropped 1.1% to a two-month low as supply-disruption worries faded. Iron ore barely moved.
Gold is the most instructive of the group. It settled just 0.2% higher at around $1,849 per ounce. Reduced rate-hike pressure would normally lift gold, but elevated energy prices pulled the other way, and the two forces cancelled out.
That oil-versus-gold split is the takeaway. Oil rose on supply geopolitics completely disconnected from inflation, while gold’s flat response showed that any commodity reaction to inflation data is conditional on the balance of forces already in play. It is never a mechanical outcome.
Oil and inflation divergence is not limited to the August 2023 episode; the same dynamic reappeared in mid-2026, when WTI at $89.87 and headline CPI at 4.2% reflected a structural Hormuz supply disruption rather than demand-driven price pressure, with core inflation running a full 1.3 percentage points softer and confirming that commodity markets and inflation gauges routinely tell different stories.
For you, the practical warning is clear. Positioning commodities ahead of a CPI or PCE release is riskier than it looks, because supply shocks, geopolitics, or demand signals from China can dominate the session and leave the inflation trade stranded.
The transmission framework: how to read any inflation release going forward
The August 2023 case study is only useful if it hands you a repeatable method. Here is the framework that turns one event into a tool you can apply to the next release.
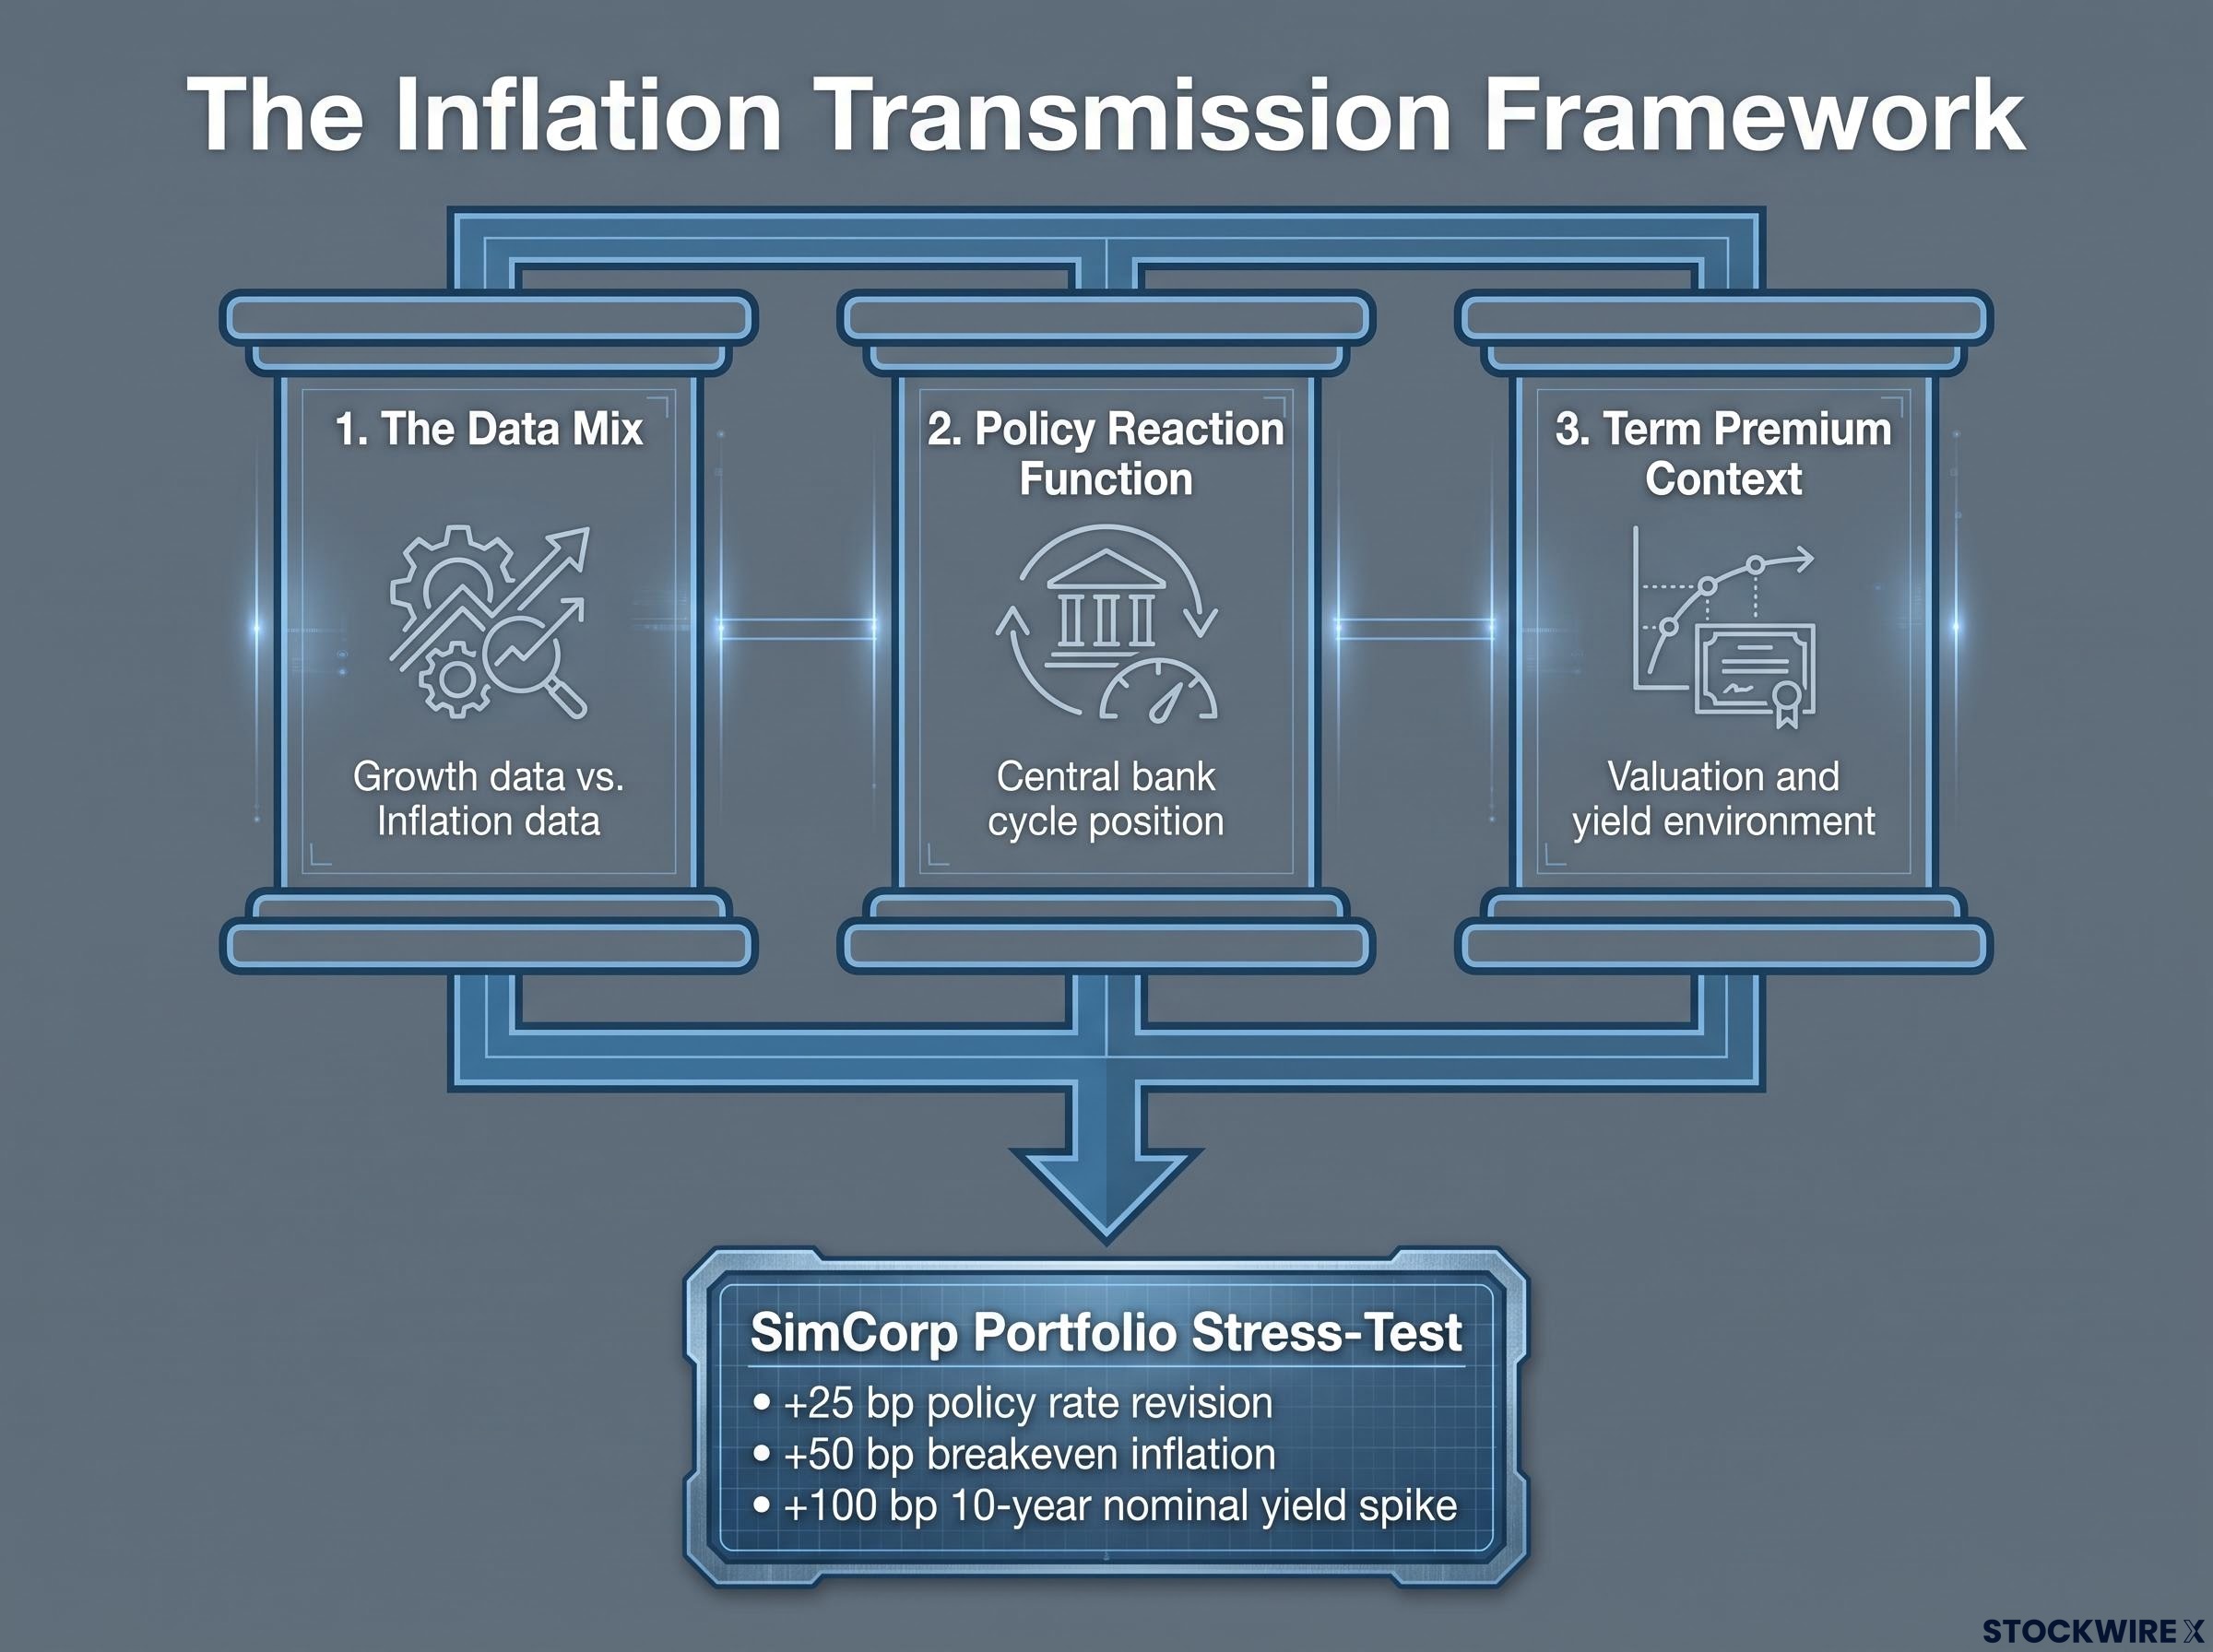
Three conditions determine how any inflation print actually lands:
- The data mix. Is growth data moving in the same direction as inflation, or against it? Soft inflation alongside firm GDP, as in August 2023, keeps rate expectations elevated rather than triggering a dovish repricing.
- The policy reaction function. Where is the central bank in its cycle, and how sensitive is it to this specific release? The same print means different things early in a hiking cycle versus near its end.
- The term premium and valuation context. Are stretched valuations or fiscal pressures already priced in? When the term premium is high, a soft print produces a muted or asymmetric response.
The core message is that soft inflation is not a switch that flips markets to risk-on. The BIS Quarterly Review of December 2024 noted that US Treasury implied volatility reached yearly highs amid shifting policy expectations, exactly the environment where term-premium swings overwhelm the direct effect of an inflation surprise.
JPMorgan Private Bank advises separating short-term, headline-driven volatility from durable changes in fundamentals such as debt issuance, tax policy, and long-term earnings growth. That distinction is the single most useful filter you can apply.
Rather than betting on the direction of the print, model your portfolio against defined scenarios. SimCorp recommends stress-testing across three dimensions:
- A 25 basis point upward revision to the policy rate
- A 50 basis point rise in breakeven inflation
- A 100 basis point spike in the 10-year nominal yield
Cleveland Fed research reinforces the approach, finding that inflation surprises exert stronger effects on the 2-year yield than on near-term fed funds expectations directly. The read is about how the data interacts with the reaction function, not whether it prints hard or soft.
Applying the framework before the next major release
Before the next CPI or PCE lands, run through the three conditions in order. First, check the data mix: is growth running hot or cool alongside inflation, and are they pointing the same way?
Second, locate the central bank in its cycle. Is it still tightening, on hold, or leaning toward cuts, and how much weight does it place on this particular gauge?
Third, look at what bonds have already priced. Are yields and the term premium reflecting prolonged elevated rates, or is there room for a repricing? If you can answer all three before the number hits, your response will be calibrated rather than reflexive, which already puts you ahead of most reactions in the market.
What the August 2023 episode reveals about investing around macro data
Step back and the paradox is complete. One soft inflation print lowered rate-hike expectations, yet lifted the 10-year Treasury yield to 5.29%. It sent the Nasdaq up while the Dow fell, drove the ASX up 0.9% while European indices dropped, and sat entirely apart from a Brent crude that gained roughly 14% on the month.
None of that was an anomaly. It is how macro transmission works in a post-zero-rate world, where term premia, fiscal dynamics, and growth data all compete with the inflation signal for control of the session.
The global bond market reset now underway, with ten-year sovereign yields in the US, UK, Germany, and Japan hitting simultaneous multi-decade highs, is the contemporary expression of the same term premium and fiscal dynamics the August 2023 episode illustrated in miniature, confirming that the lesson from that single session has compounded into a structural regime shift.
The Kansas City Fed finding is the anchor here: yields now respond far more sharply to inflation surprises than the old playbook assumed, which is why the reflexive “soft print equals risk-on” trade so often fails.
The edge is not in predicting the number. It is in diagnosing the environment the number lands in, and knowing which variable is dominating on the day.
That skill compounds. Read enough releases through the three-condition lens and your decisions around every future data point become more deliberate and less reactive, which is exactly the position most market participants never reach.
This article is for informational purposes only and should not be considered financial advice. Investors should conduct their own research and consult with financial professionals before making investment decisions. Past performance does not guarantee future results, and market reactions to any single data release are subject to conditions that change over time.