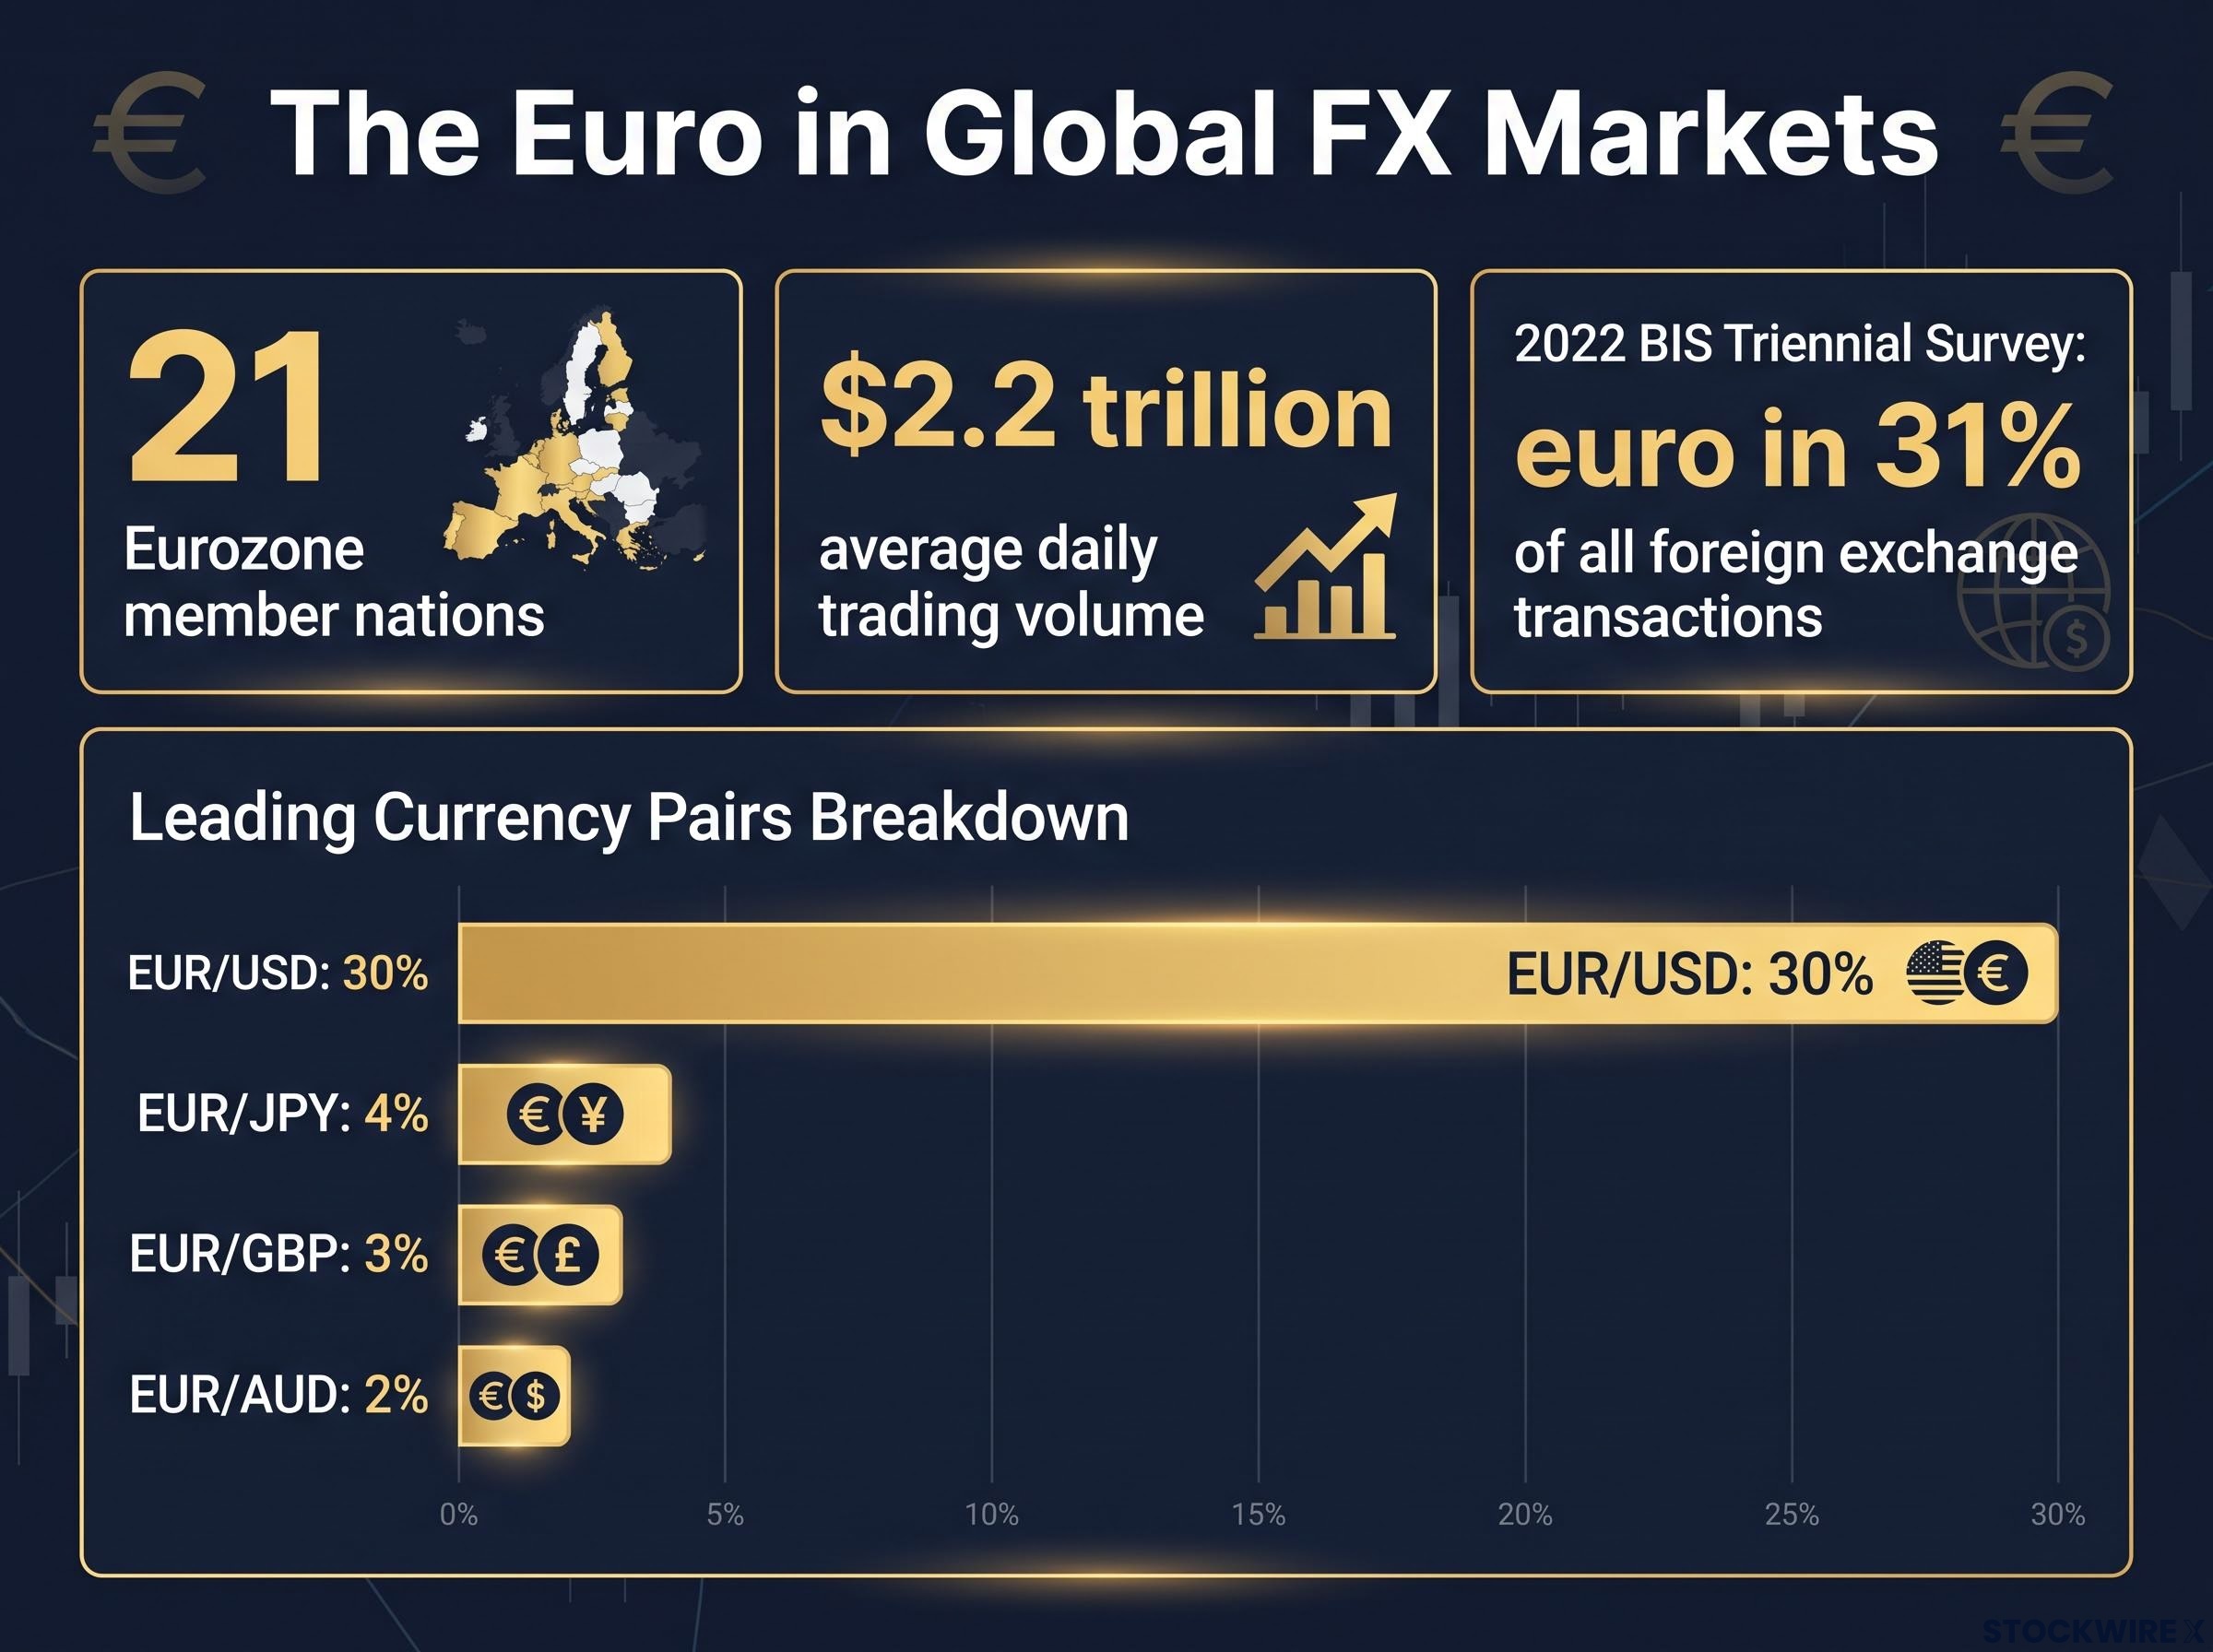
Every day, roughly $2.2 trillion in euros changes hands across the world’s currency markets. The single pair of EUR/USD accounts for around 30% of all global foreign exchange transactions, making the euro far more central to your portfolio than most casual mental models of “currency markets” suggest.
Yet despite that scale, most finance readers cannot name the three forces that actually decide whether the euro strengthens or weakens in any given week.
That gap matters. If you hold European equities, a global ETF, or any asset priced against the dollar, euro movements shape your returns in ways that monetary policy headlines alone never fully explain.
So here is what each of those signals really tells you about where the euro is heading. By the time you finish, you will be able to read an ECB announcement, a Harmonised Index of Consumer Prices (HICP) inflation print, and a Eurozone trade release as connected inputs to euro valuation, not as three unrelated news items.
Why the euro moves markets the way it does
Start with the numbers, because they are genuinely larger than most people expect.
The euro is the shared currency of 21 Eurozone member nations and ranks as the second most actively traded currency on the planet. In the 2022 Bank for International Settlements (BIS) Triennial Central Bank Survey, the euro featured in 31% of all foreign exchange transactions, with average daily trading volume exceeding $2.2 trillion.
The BIS 2022 Triennial Central Bank Survey confirmed that global foreign exchange turnover averaged $7.5 trillion per day, with the euro featuring in 31% of all transactions, establishing the scale of euro-denominated flows that makes this currency relevant to portfolios well beyond active FX traders.
EUR/USD alone represents an estimated 30% of all global FX transactions, making it the single most heavily traded currency pair in the world.
The euro’s reach does not stop at the transatlantic corridor. It shows up across every major currency zone, and the four leading pairs illustrate that spread:
- EUR/USD: approximately 30% of global FX activity
- EUR/JPY: approximately 4%
- EUR/GBP: roughly 3%
- EUR/AUD: around 2%
That $2.2 trillion daily figure is the point to hold onto. Euro-denominated moves are not niche events that only currency traders feel; they ripple through equity valuations, bond yields, and fund returns across every corner of a globally diversified portfolio. Understanding what drives the euro is therefore relevant even if you never consciously trade a single currency.
The complication is that the euro’s drivers do not all operate on the same clock. Short-term moves are dominated by monetary policy signals and inflation surprises, which can shift within hours. Medium-term direction is shaped by slower forces like trade balances and structural factors that build over months or years.
To read the euro properly, you have to separate those timeframes and understand the mechanism behind each one. The rest of this piece takes them in turn, starting with the force that moves the currency fastest: the European Central Bank.
When big ASX news breaks, our subscribers know first
The ECB’s role: how interest rate decisions shape the euro
The European Central Bank (ECB), headquartered in Frankfurt, is the Eurozone’s central bank, and its single most important tool is the interest rate. Its core mandate is price stability, which in practice means keeping inflation controlled while supporting economic conditions.
The deposit facility rate is the rate that actually prices overnight money across the banking system, and the ECB rate corridor structure around it, spanning the deposit facility, main refinancing, and marginal lending rates, explains why a single Council decision can shift funding costs for banks across all 21 member states simultaneously.
Policy is set by the Governing Council, which brings together the heads of the Eurozone’s national central banks and six permanent members, including ECB President Christine Lagarde. The Council meets eight times a year to decide the direction of rates.
Here is why those decisions move the currency. When the ECB raises rates relative to the US Federal Reserve, euro-denominated assets start offering comparatively higher returns. That attracts capital inflows, and to buy euro assets, investors must first buy euros, which supports the currency. When the ECB cuts, or signals easing while the Fed holds firm, that return advantage narrows or reverses, and the euro tends to soften.
Consider the ECB’s first rate cut of the cycle in mid-2024. The euro weakened against the dollar afterwards, but the size of the move was driven far less by the cut itself than by how it reshaped expectations about the path of rates over the following year. That distinction is the key to reading these events correctly.
What the market is really pricing in
The ECB has been explicit that its mandate is price stability, not exchange-rate management. It watches the euro for what a stronger or weaker currency means for imported inflation and financial conditions, but it does not target a specific level.
This matters for how you read a rate decision, because markets price policy moves in advance. When a decision matches consensus, the currency reaction is often muted. The euro tends to move far more sharply on surprises, whether in the ECB’s forward guidance or in the inflation outlook, than on the headline rate change itself.
Three caveats are worth keeping front of mind:
- The relative stance versus the Fed matters more than ECB policy in isolation. If both central banks move together, “ECB hike equals stronger euro” breaks down.
- Market expectations are frequently priced in already. Guidance surprises usually move the currency more than the rate decision.
- Risk sentiment can override everything. In a global risk-off episode, the dollar often strengthens as a safe haven even when the rate differential favours the euro.
The recent policy record puts this in context. The ECB held its three key rates unchanged at both the 18 December 2025 and 19 March 2026 Governing Council meetings. At the December meeting, staff projections showed headline HICP averaging 2.1% in 2025 and 1.9% in 2026, both sitting close to the 2% target.
That combination, steady rates alongside near-target projections, tells you the ECB was in a watchful, data-dependent posture. The next meaningful catalyst for EUR/USD would not come from the ECB acting, but from whether incoming inflation data confirmed those projections or broke from them. Which brings the story directly to the HICP.
Reading the HICP: what inflation data actually tells currency markets
The Harmonised Index of Consumer Prices (HICP) is the Eurozone’s standardised inflation gauge, built so that price data from every member state can be compared on the same basis. It is the ECB’s primary input for setting policy, which makes it the single most important data release for anyone trying to read the euro. It differs from national consumer price measures precisely because it is harmonised across the bloc.
Follow the chain of cause and effect, because this is where a single statistic turns into a currency move. When an HICP print surprises to the upside, traders raise the probability they assign to tighter-for-longer ECB policy. That expectation compresses real-yield differentials in the euro’s favour and tends to produce short-term euro strength. A downside surprise does the reverse, accelerating easing expectations and weakening the currency.
There is a subtlety here worth internalising. The same nominal ECB rate can imply very different real returns depending on where inflation is running. A 3% rate means one thing when inflation is at 1% and something else entirely when inflation is at 3%. This is why professional analysts increasingly focus on real rate differentials, nominal rates adjusted for inflation, rather than headline rates when explaining EUR/USD over weeks and months.
Energy’s share of the HICP basket is approximately 9%, which caps how much even a large energy price spike can directly add to the headline reading, a detail that matters when separating a temporary supply-driven overshoot from the kind of broad-based inflation that genuinely changes ECB policy direction.
Eurozone HICP inflation reached 3.3% in August 2026, well above the ECB’s 2% target and far above the 1.9% the ECB’s own staff had projected for the year back in December 2025.
That is a material upside surprise, and it is exactly the kind of print that has historically triggered short-term euro repricing.
| Period | HICP reading | Versus ECB projection | Market implication |
|---|---|---|---|
| Dec 2025 projection (for 2026) | 1.9% (forecast avg) | Reference baseline | Near-target, easing bias plausible |
| July 2026 | 2.9% | Above projection | Upward repricing pressure |
| August 2026 | 3.3% | Well above projection | Material upside surprise, euro-supportive short term |
For you, the practical value is this: if you watch HICP release dates and understand the surprise dynamic, you can interpret an EUR/USD move during an inflation release rather than being baffled by a currency swing that looks random after the data drops. The move is not noise. It is the market repricing the odds of the ECB’s next step.
Trade balances and the medium-term forces behind euro strength
The trade balance is the slow-moving force that serious euro-watchers track alongside monetary policy, and the mechanism is straightforward. When Eurozone exporters sell goods abroad, overseas buyers must acquire euros to settle those invoices. That generates net demand for the currency. A sustained surplus supports the euro over time; a persistent deficit means the reverse flow dominates and drags on it.
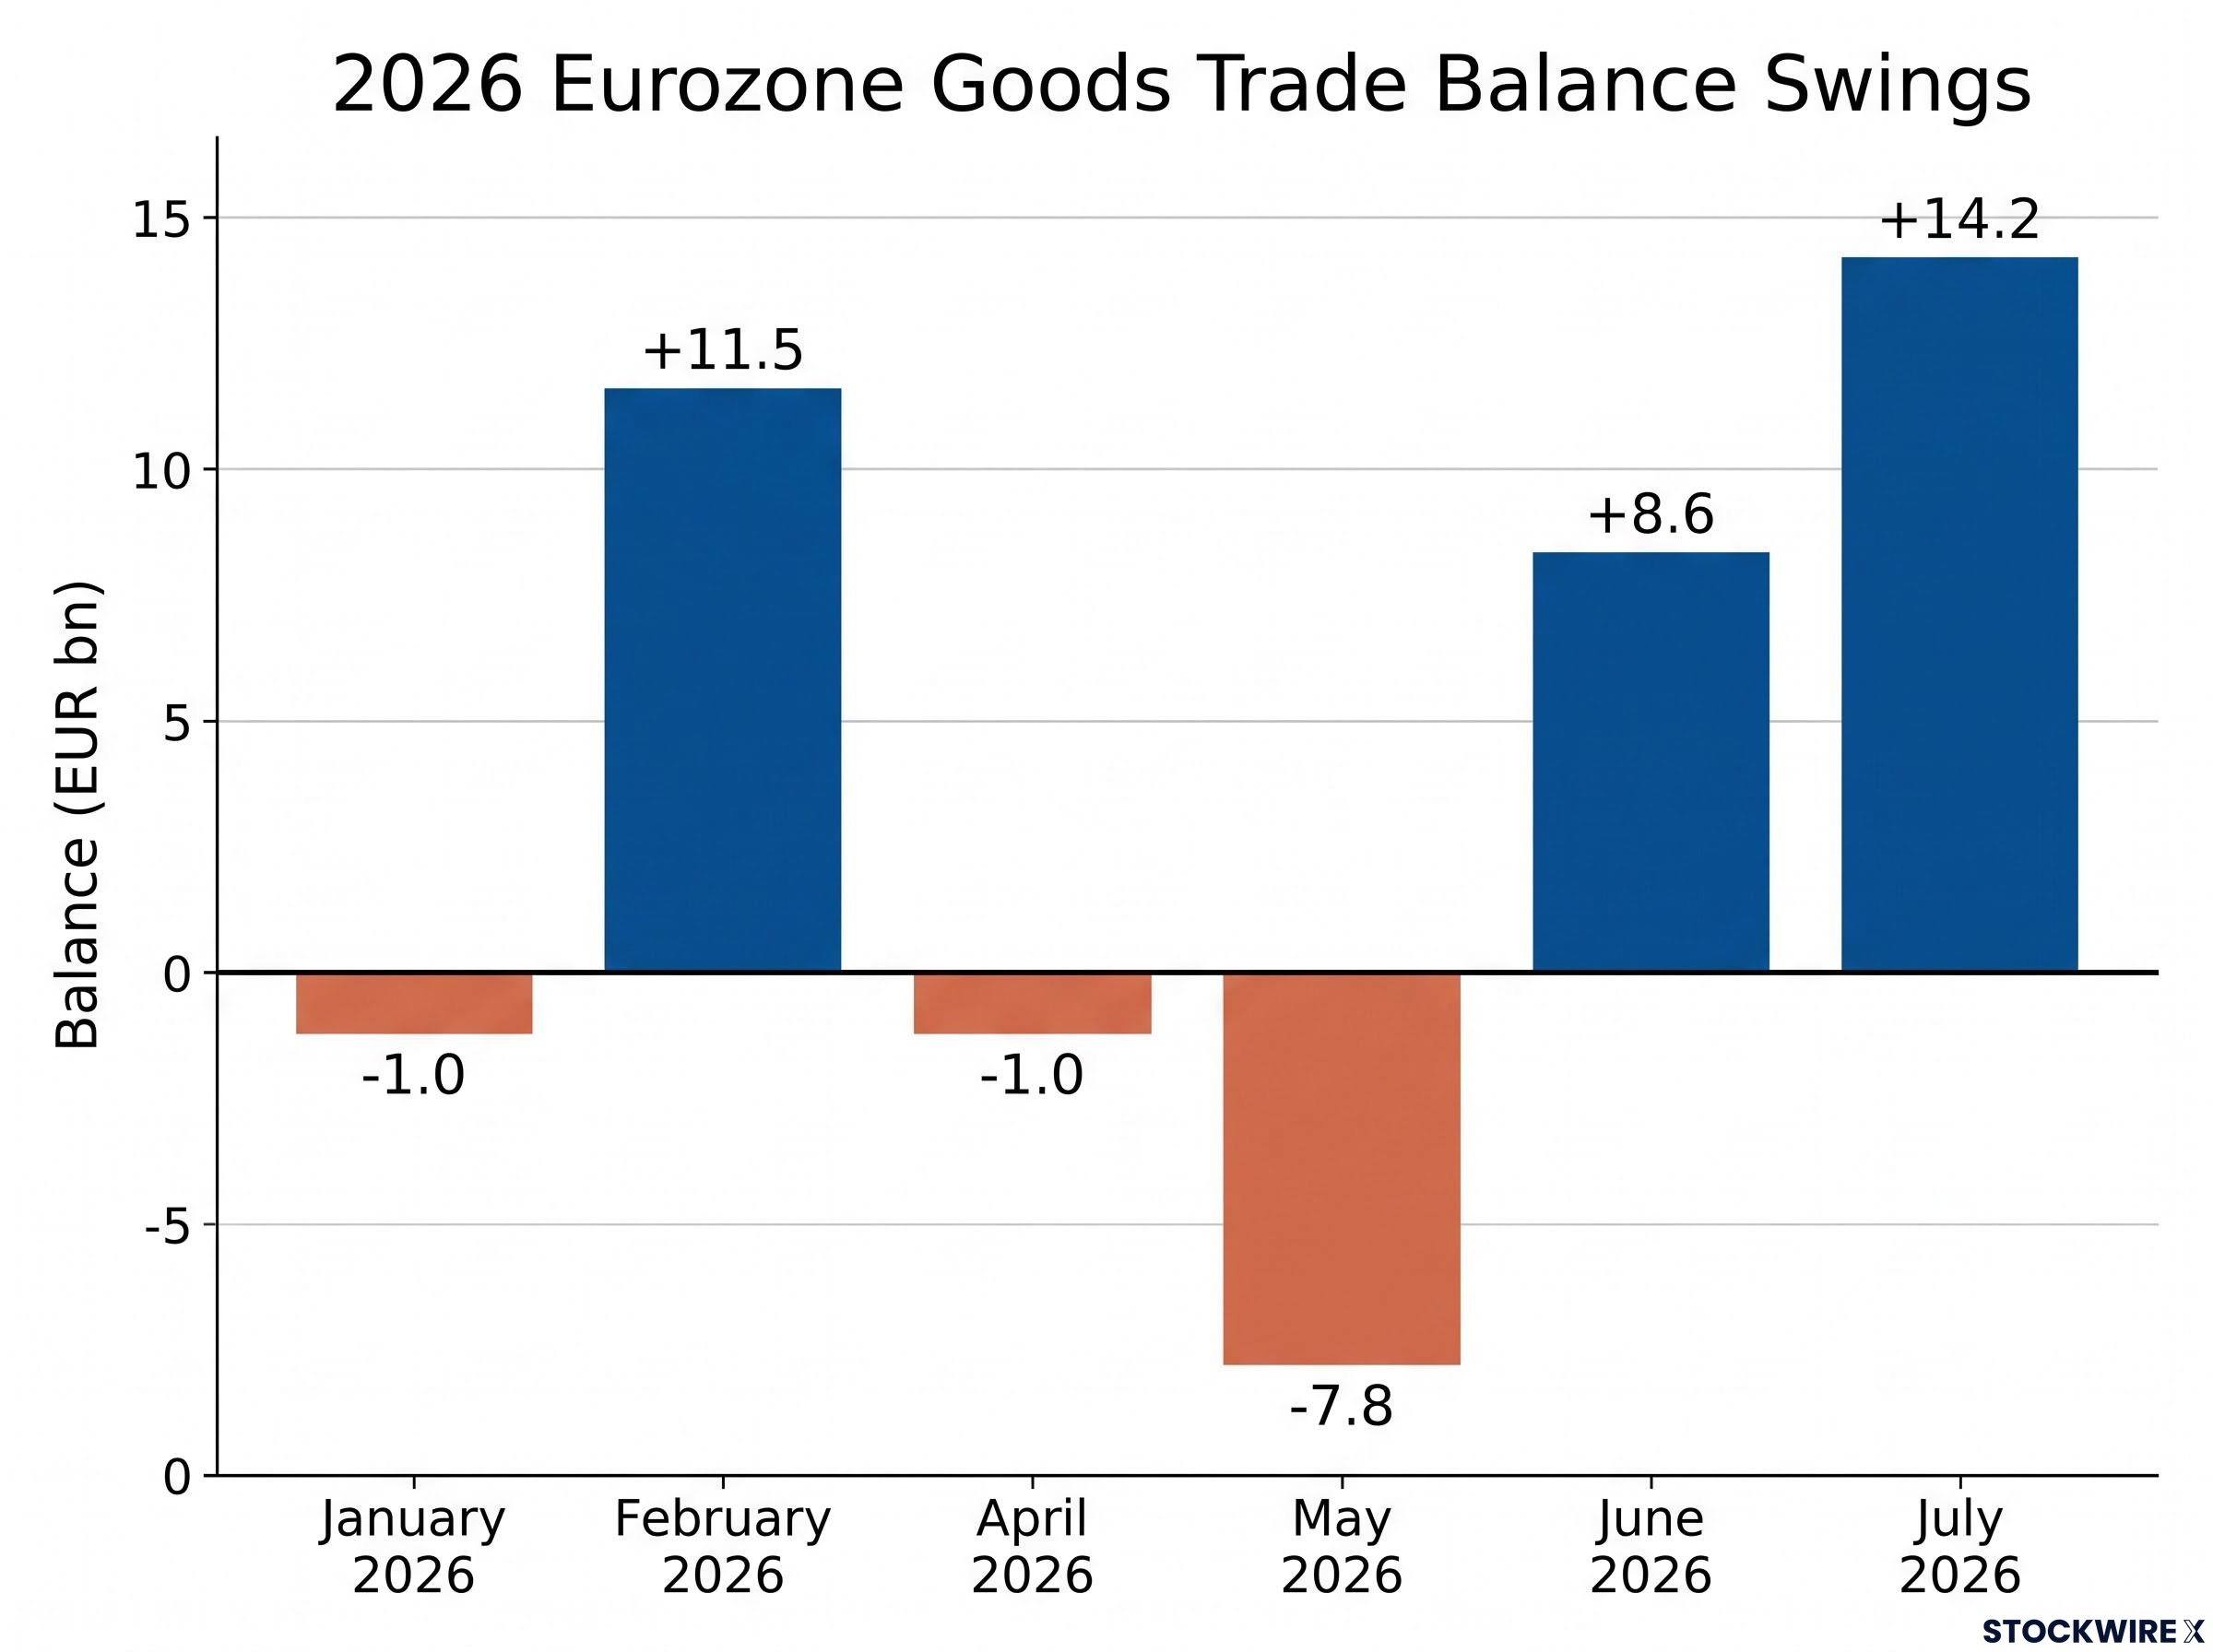
The euro area’s 2026 data shows why this is a medium-term driver rather than a daily one. The goods trade position swung repeatedly between surplus and deficit within a single year.
| Month | Balance (EUR bn) | Direction |
|---|---|---|
| January 2026 | -1.0 | Deficit |
| February 2026 | +11.5 | Surplus |
| April 2026 | -1.0 | Deficit |
| May 2026 | -7.8 | Deficit |
| June 2026 | +8.6 | Surplus |
| July 2026 | +14.2 | Surplus |
The most recent figures point in a supportive direction. According to Eurostat, the euro area recorded a goods trade surplus of EUR14.2 billion in July 2026, up from EUR10.7 billion in July 2025. Exports reached EUR276.0 billion, a 9.0% increase year-on-year.
The swing from a EUR7.8 billion deficit in May to a EUR14.2 billion surplus in July tells you something important: the Eurozone’s external position is not fixed. It is sensitive to demand conditions and, above all, to energy costs. If you are tracking the euro over a quarter rather than a day, these Eurostat releases belong on your calendar rather than being treated as static background.
That energy sensitivity is the structural vulnerability worth understanding. When energy prices spike, the euro area’s trade position deteriorates quickly, imported inflation rises, and the ECB faces a more complicated policy problem, weakening the euro through several channels at once. Three structural weaknesses shape trade-driven euro dynamics:
- Energy import dependency: a spike in energy prices erodes the trade balance and lifts imported inflation simultaneously.
- Incomplete fiscal union: limited joint fiscal capacity amplifies stress during external shocks.
- Sovereign-spread risk: divergent bond spreads between core and peripheral states can revive fragmentation concerns.
One caveat keeps this in perspective. Short-term FX reactions to trade data are typically modest compared with the response to an ECB or Fed announcement. Trade shapes where the euro should sit over the medium term; it rarely dictates where it sits this afternoon.
What matters most depends on the timeframe you are watching
You now have three drivers, ECB policy, inflation, and trade, plus a set of structural factors. The trap is treating them as competitors for a single explanation. They are not. They operate at different speeds, and the apparent contradictions dissolve once you match each driver to its correct timeframe.
Professional analysts tend to cluster around four framings: policy divergence versus the Fed, real interest-rate differentials, external balances and trade, and structural growth combined with the dollar’s safe-haven dominance. These are not mutually exclusive views. They are different frequencies of the same signal.
| Timeframe | Primary drivers | Key data to watch |
|---|---|---|
| Short-term (days) | Monetary policy signals, inflation surprises, risk sentiment | ECB guidance, HICP prints, global risk episodes |
| Medium-term (months) | Trade and current account dynamics | Eurostat goods trade releases |
| Long-term (years) | Growth differentials, reserve competition, institutional completeness | Structural reform, fiscal integration, demographics |
The 2024 rate cut illustrates the short-term layer: euro weakness driven by rate-path repricing more than the cut itself. The August 2026 HICP jump to 3.3% against a 1.9% projection is inflation-driven repricing. The July 2026 trade surplus of EUR14.2 billion is the medium-term fundamental analysts cite as supporting fair value without moving the currency day to day.
So if you see EUR/USD fall on a day when Eurozone trade data looked strong, you have not found a contradiction. You have watched risk sentiment or a Fed signal dominate the short-term picture while the trade improvement quietly builds its medium-term case in the background.
The structural risks that long-term euro-watchers monitor
Over the longest horizon, five structural conditions frame whether the euro can ever close the gap on the dollar’s reserve dominance:
- Eurozone fragmentation and sovereign spreads: widening spreads between core and peripheral states can raise redenomination risk premiums.
- Incomplete fiscal and banking union: unfinished institutional architecture limits the euro’s claim as a truly unified reserve currency.
- Energy import dependency: exposure to terms-of-trade shocks whenever energy prices move sharply.
- Reserve-currency competition: slow global diversification away from both dollar and euro over decades.
- Low potential growth and demographics: ageing populations and modest productivity gains that dampen structural capital inflows.
These are not crisis alarms. They are the conditions analysts weigh when judging the euro’s long-run trajectory.
Dollar reserve dominance frames the ceiling on what the euro can achieve structurally: the dollar holds approximately 57% of global official reserves against the euro’s 20%, and that gap persists not because of rate differentials but because of the depth of US Treasury markets and the dollar’s embedded role in global trade invoicing and commodity pricing.
Putting the ECB, inflation, and trade together as a working framework
You do not need a trading desk to read the euro like a professional. You need a repeatable process, and it comes down to three questions asked in order.
- Where does ECB policy stand relative to the Fed? The ECB held rates unchanged at both its December 2025 and March 2026 meetings, so the policy baseline entering the second half of 2026 was steady and data-dependent.
- What is the latest HICP print relative to the 2% target? At 3.3% in August 2026, inflation was running well above target, tilting rate expectations and short-term pressure in the euro’s favour.
- Which way is the Eurozone goods trade position pointing? The EUR14.2 billion July 2026 surplus offered medium-term support, even if it would not move the currency on any single day.
The drivers interact, and that is the feature to remember, not a flaw to be frustrated by.
A trade surplus can support the euro’s medium-term fair value and still be completely overwhelmed by a rate-differential shift or a risk-off episode. Reading the euro means holding several signals at once, each running on its own clock.
With EUR/USD representing roughly 30% of all global FX transactions, movements in this pair are core signals for any globally exposed portfolio, not marginal events. Track the three questions systematically and you shift from reacting to individual headlines to interpreting them as parts of one connected picture.
For readers wanting to apply the three-question framework to live calendar events before they land, our comprehensive walkthrough of reading macro events before they move currency markets covers OIS curve pricing, CFTC positioning data, and options risk-reversal skew as pre-announcement tools that show whether a release has already been absorbed.
This article is for informational purposes only and should not be considered financial advice. Investors should conduct their own research and consult with financial professionals before making investment decisions. Past performance does not guarantee future results, and financial projections are subject to market conditions and various risk factors.